. 2025 Jul;10(7):1723-1740.
doi: 10.1038/s41564-025-02012-9. Epub 2025 Jul 1.

In situ structure of a bacterial flagellar motor at subnanometre resolution reveals adaptations for increased torque

Affiliations

In situ structure of a bacterial flagellar motor at subnanometre resolution reveals adaptations for increased torque

Tina Drobnič et al. Nat Microbiol. 2025 Jul.

Erratum in

Abstract

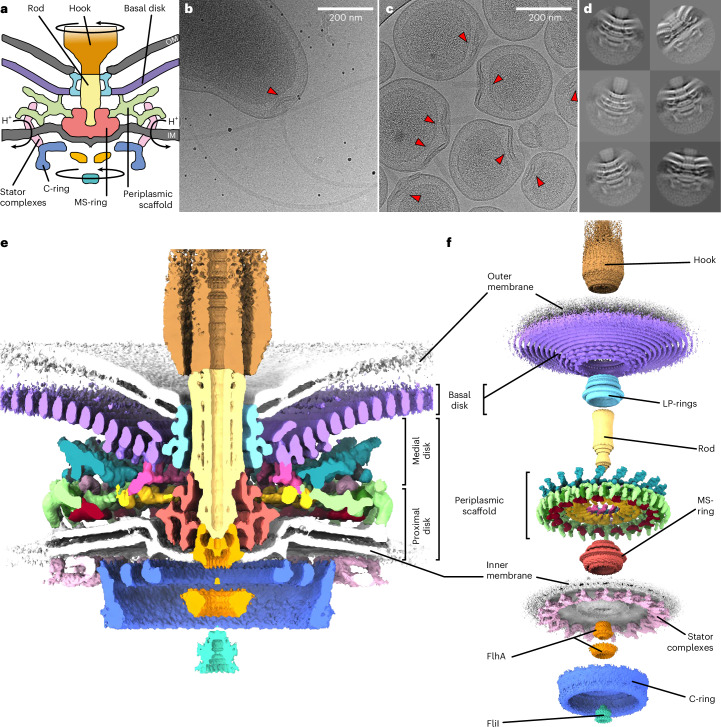
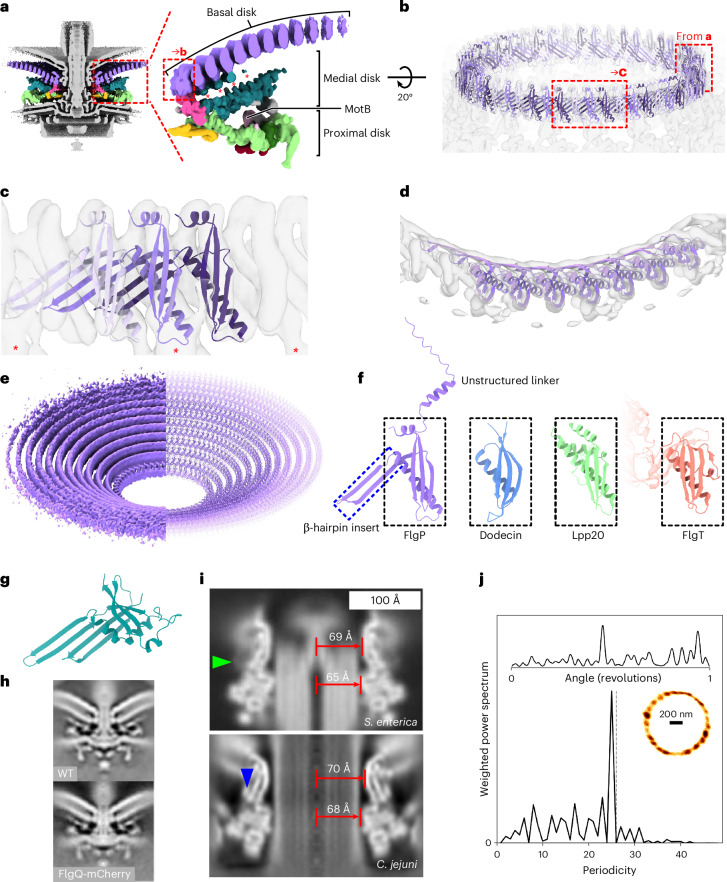
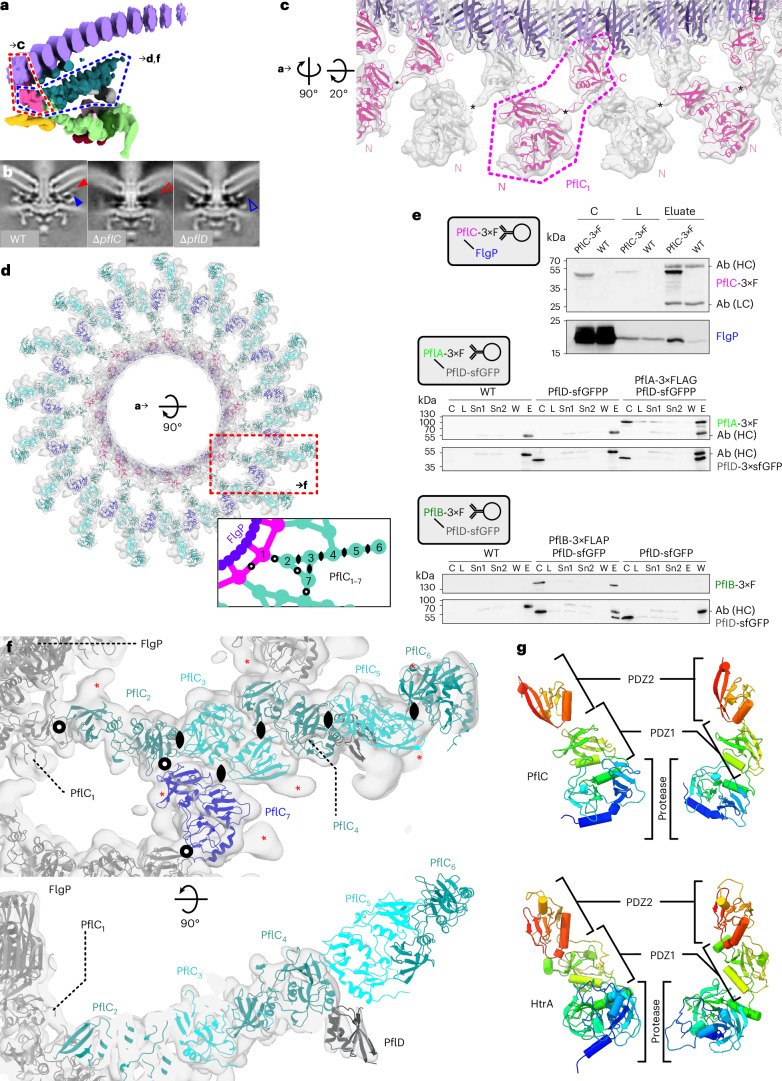
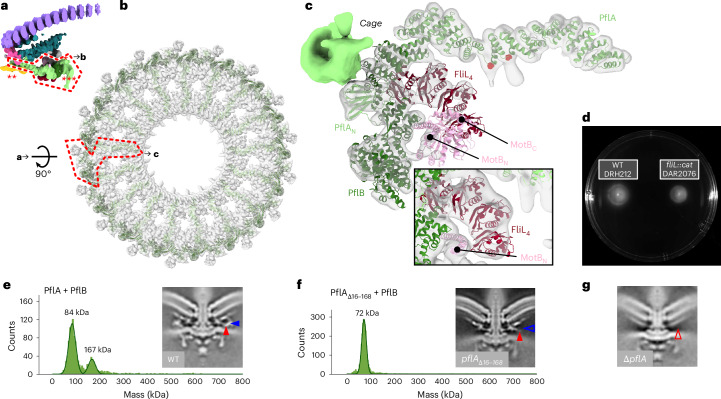
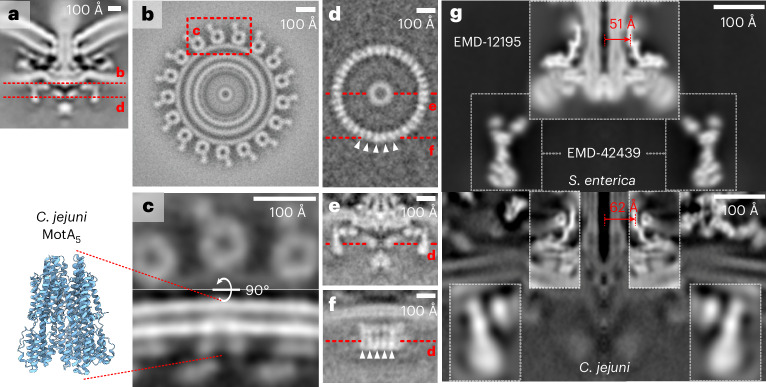
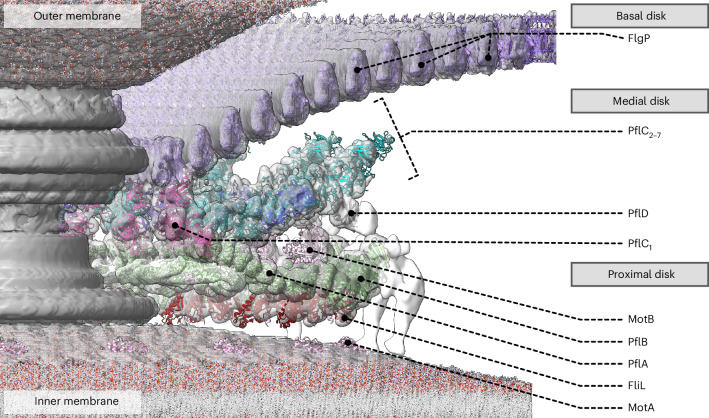
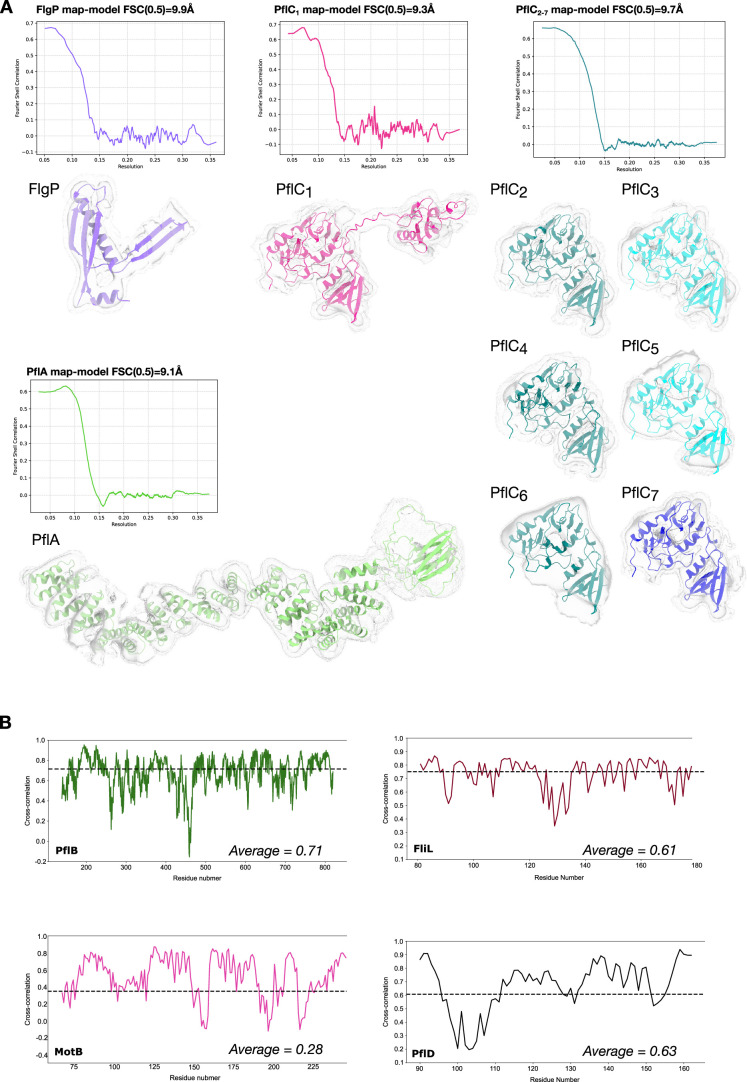
The bacterial flagellar motor, which spins a helical propeller for propulsion, has undergone evolutionary diversification across bacterial species, often involving the addition of structures associated with increasing torque for motility in viscous environments. Understanding how such structures function and have evolved is hampered by challenges in visualizing motors in situ. Here we developed a Campylobacter jejuni minicell system for in situ cryogenic electron microscopy imaging and single-particle analysis of its motor, one of the most complex flagellar motors known, to subnanometre resolution. Focusing on the large periplasmic structures which are essential for increasing torque, our structural data, interpreted with molecular models, show that the basal disk comprises concentric rings of FlgP. The medial disk is a lattice of PflC with PflD, while the proximal disk is a rim of PflB attached to spokes of PflA. PflAB dimerization is essential for proximal disk assembly, recruiting FliL to scaffold more stator complexes at a wider radius which increases torque. We also acquired insights into universal principles of flagellar torque generation. This in situ approach is broadly applicable to other membrane-residing bacterial molecular machines.


Conflict of interest statement

Competing interests: The authors declare no competing interests.

Figures

Fig. 1
Fig. 1. Engineering of homogeneous C. jejuni minicells enabled determination of an in situ structure of a flagellar motor by single-particle analysis electron cryo-microscopy.
a, Schematic of the flagellar motor. Proton flux through the stator complexes drives rotation of the C-ring, MS-ring, rod and hook/filament. In C. jejuni and other Campylobacterota, a basal disk and periplasmic scaffold have evolved that scaffold a wider ring of additional stator complexes thought to increase motor torque. IM/OM, inner/outer membrane. b, Wildtype C. jejuni cells used in previous studies typically provide 1 flagellar motor per field of view (arrowhead) as compared with c, many motors per field of view in our minicell strain (arrowheads), greatly increasing throughput and reducing sample thickness for higher-quality electron micrograph acquisition. Note that curvature of minicells is comparable to wildtype cells. The 51781 raw micrographs are available from EMPIAR (10.6019/EMPIAR-11580). d, Periplasmic and cytoplasmic features are evident in single-particle analysis 2D classes of manually picked motors. e, Cross-section through an isosurface rendering of a C17 whole-motor 3D reconstruction (deposited as EMD-16723). f, Map from e segmented and exploded along the z axis to highlight component substructures. Source data
Fig. 2
Fig. 2. The basal disk is composed of concentric rings of FlgP.
a, Left: focused C17 refinement of the periplasmic scaffold and inner ring of the multi-ring basal disk (deposited as EMD-16724) shows that the scaffold attaches to the innermost 5 concentric rings of the basal disk. Right: 1 asymmetric unit of the periplasmic scaffold. Asterisks denote densities beneath the first 5 rings. Only the innermost ring (dashed box) is 17-fold symmetric; subsequent rings were not part of the focused refinement. b, AlphaFold2 (ref. ) structures of FlgP oligomers reveal that the innermost basal disk ring is composed of 51 FlgP monomers as 17 trimers. c, Fit of a FlgP trimer and interaction with the 17-fold symmetric density of the medial disk (asterisks). d, Top view of a fit of 7 FlgP monomers. e, Density of 10 concentric basal disk rings (left) and fitted FlgP models (right). f, The SHS2-like fold of FlgP (dashed box) is shared with dodecin (PDBID: 1MOG), Helicobacter pylori Lpp20 (ref. ) (PDBID: 5OK8) and Vibrio alginolyticus FlgT (PDBID: 3W1E). FlgP uniquely features the ring-forming β-hairpin insert. g, AlphaFold2 (ref. ) model of FlgQ structurally resembles a 2-FlgP repeat. h, 100 × 100 nm slice through the subtomogram average structure of a motor in which FlgQ was fused to mCherry is indistinguishable from the WT motor (deposited as EMD-17419). i, The C. jejuni LP-rings have comparable diameters to the 26-fold symmetric Salmonella LP-rings. The density map of the Salmonella LP-rings (EMD-12183) was low-pass filtered to 15 Å resolution and cylindrically averaged for comparison with the C. jejuni LP-rings (Additional data for EMD-16723). The C. jejuni L- and P-rings are of comparable diameters to those from Salmonella. Green arrowhead indicates Salmonella YecR, blue arrowhead an unidentified C. jejuni density. j, Support for the C. jejuni LP-rings having comparable stoichiometry to E. coli and Salmonella from ~26 steps in flagellar rotation. Top: kernel density estimation of bead position as a function of rotation. Bottom: weighted power spectrum of angular position; grey dashed line highlights 26. Inset: x,y-position histogram with density represented by darkness of coloration (Extended Data Fig. 5 shows 10 other traces).
Fig. 3
Fig. 3. The medial disk is a lattice of PflC and PflD that interacts with the basal and proximal disks.
a, Asymmetric unit of the periplasmic scaffold highlighting the medial disk. Dashed box regions are enlarged in c, d and f. b, Comparing the WT subtomogram average motor structure (100 × 100 nm cross-section of EMD-3150 (ref. )) to a pflC deletion (100 × 100 nm cross-section, deposited as EMD-17415) reveals loss of the medial disk (open arrowhead; filled on WT structure), while pflD deletion (deposited as EMD-17416) abolishes assembly of a peripheral post-like density (open arrowhead; filled on WT structure). c, Close-up below the innermost basal disk ring shows a ring of 17 domain-swapped PflC protomers attached to FlgP trimeric repeats. A single PflC (dashed outline) contributes domains to 2 protomeric units. Asterisks denote the interdomain linker. d, View of the medial disk from outside the cell depicting 17 asymmetric units (dashed box highlights 1 asymmetric unit) of 7 PflC protomers and 1 PflD. PflC1 in pink; PflC2,4,6 in teal; PflC3,5 in cyan; PflC7 in blue. Inset: differential oligomerization interfaces of PflC protomers. Twofold symmetry axis symbols highlight symmetric dimerization; empty circles represent asymmetric interfaces. See focus in f. e, PflC and PflD interact with known flagellar components. Top: western blot of coIP of PflC-3×FLAG. Detected heavy (HC) and light (LC) antibody chains are indicated. C, culture; L, lysate. Middle: western blot of coIP of PflA-3×FLAG, PflD-sfGFP double-tagged strain. Sn1/2, supernatant 1/2; W, wash; E, eluate. Bottom: western blot of coIP of PflB-3×FLAG, PflD-sfGFP double-tagged strain. f, Top: molecular model of the PflC lattice denoting symmetry elements, enlarged from red box in d. Densities adjacent to every Asn239 denoted by asterisks correspond to a glycosylation site of PflC from a related species. Symmetry elements as in d. Bottom: side view of PflD beneath PflC4,5. g, The predicted structure of PflC (top) highlights common fold with HtrA (bottom), a periplasmic protease (PDB 6Z05 (ref. )). Left panel aligned to PflC1 in c. Protease and 2 PDZ domains labelled for comparison. See Extended Data Figs. 6 and 7 for further analysis.
Fig. 4
Fig. 4. PflA and PflB form a spoke-and-rim structure that scaffolds 17 stator complexes.
a, Side view of an asymmetric unit of the periplasmic scaffold highlighting the proximal disk (dashed red line). Asterisks denote unassigned PflD-adjacent density (*), E-ring (**) and peripheral cage (***). b, Top view of the proximal disk. Dashed red box denotes the asymmetric unit in c. c, Every asymmetric unit features 1 PflA, 1 PflB, 4 FliL and 1 stator complex (composed of 5 copies of MotA and 2 copies of MotB). PflA (light green) forms spokes whose N-terminal domain interacts with a rim of PflB (dark green) at the periphery of the scaffold. An arc of FliL (red) and periplasmic domain of MotB (pink, residues 68–247) are also evident at lower confidence. Inset: focus on FliL at lower threshold to demonstrate match of 4 FliL models into 4 periodic densities. d, A representative motility agar plate stabbed with WT and fliL::cat demonstrates that fliL knockout has only a minor effect on motility. e, Mass photometry measurements confirm that the PflAB dimer (167 kDa peak) forms in vitro. Inset: 100 × 100 nm cross-section through the subtomogram average density map of the WT motor exhibits PflAC (filled red arrowhead) and PflB densities (filled blue arrowhead). Structure from EMD-3150 (ref. ). f, Mass photometry shows that deleting the PflA β-sandwich and linker abolishes dimerization with PflB. Inset: 100 × 100 nm cross-section through a density map of the subtomogram average of this mutant reveals a vestigial PflAC density (filled red arrowhead) and loss of PflB (open blue arrowhead) (deposited as EMD-17417), whereas g, a 100 × 100 nm cross-section through a density map of the subtomogram average of a pflA deletion further lacks the vestigial PflAC density (open red arrowhead) (structure from EMD-3160 (ref. )).
Fig. 5
Fig. 5. Wider rings of additional stator complexes are incorporated in the C. jejuni periplasmic scaffold, while the rotor components are correspondingly wider.
a, A 100 × 100 nm cross-section through the subtomogram average of the wildtype C. jejuni motor (from EMD-3150 (ref. )) depicting locations of stator and rotor cross-sections illustrated in b and d. b, Cross-section through the whole-motor map just beneath the outer membrane shows 17 circular densities at the expected location of MotA. c, Top: focused refinement of the stator complexes reveals pentameric densities that, in cross-section (bottom), have the distinctive thimble-like shape of a MotA pentamer (from PDB 6YKM, with N-terminal helices of MotB removed). d, Cross-section through the C. jejuni C-ring showing 38-fold periodic structure (deposited as EMD-19642). Arrowheads highlight 5 of the 38 puncta. Labels E and F denote cross-sections depicted in respective panels. e, Cross-section through the centre of the C. jejuni C-ring. f, Cross-section through the edge of the C-ring showing post-like densities corresponding to the periodicity shown in d (arrowheads) as have been reported in the Salmonella C-ring. g, Comparison of Salmonella enterica serovar Typhimurium and C. jejuni MS-ring and C-rings. Top: cross-section through a composite map of the Salmonella MS-ring (middle top dashed box, from EMD-12195 (ref. )) and C-ring (two lower dashed boxes, from EMD-42439 (ref. )) rotor components depicting the 51-Å-radius MS-ring β-collar. Both maps were low-pass filtered to 15 Å resolution and cylindrically averaged for like-for-like comparison with Bottom: cross-section through a composite map of the whole-motor C. jejuni map, with superimposed corresponding cross-sections through focused, cylindrically averaged C. jejuni MS-ring and C-ring maps (deposited as Additional data for EMD-16723), highlighting the wider 62-Å-radius β-collar.
Fig. 6
Fig. 6. A ‘parts list’ of protein adaptations to increase torque by scaffolding a wider ring of additional stator complexes, thus exerting greater leverage on the axial flagellum.
A partial cut-away schematic of the structure of the C. jejuni flagellar motor contextualizing the protein components modelled in this study. The basal disk is formed of FlgP; the medial disk of PflC and PflD; and the proximal disk of PflA, PflB and FliL together with stator complex components MotA and MotB.
Extended Data Fig. 1
Extended Data Fig. 1. Flowchart and resolution estimates of structure determination of the Campylobacter jejuni bacterial flagellar motor using in situ single particle analysis.
(a) Simplified flowchart showing the generation of cryoEM volumes. (b) Central slice through the refined whole-motor structure. (c) FSC curve for B. (d) and (e) show slices through the volume of the refined, signal-subtracted periplasmic scaffold. (f) FSC curve for D, E.
Extended Data Fig. 2
Extended Data Fig. 2. Global context of components discussed in the manuscript.
(a) Context of the periplasmic scaffold focussed refinement map (EMD-16724) in the context of the whole motor map (EMD-16723). (b) Structure of the periplasmic scaffold density in isolation. (c) Location of one asymmetric unit from the 17-fold-symmetric periplasmic scaffold in pink as depicted in Figs. 2a, 3a, 4a, and 6. (d) Innermost basal disk ring of 51 FlgP as depicted in Fig. 2. (e4) Innermost basal disk ring of 51 FlgP and innermost medial disk ring of 17 PflC1 as depicted in Fig. 3c. (f) Innermost basal disk ring of 51 FlgP and medial disk lattice of 17 PflC1–7 as depicted in Fig. 3d, f. (g) Proximal disk of 17 PflAB FliL4 as depicted in Fig. 4b, c.
Extended Data Fig. 3
Extended Data Fig. 3. Validation of those protein chains modelled in the scaffold map to subnanometre resolution.
(a) Map-model FSC curves for protein models refined into the scaffold map: FlgP, PflA, PflC1, and PflC2–7 calculated in Phenix, alongside images of excised pieces of the density map corresponding to individual proteins. High and low isosurface thresholds are denoted by solid and mesh surfaces, respectively, to illustrate fit of models into secondary structure densities. (b) Cross-correlation per residue plots of proteins docked into the map: PflB, FliL, MotB, PflD, calculated using Phenix. Mean CC values are shown with dashed line and in text inset.
Extended Data Fig. 4
Extended Data Fig. 4. Comparison of starting predicted protein models with final structures after flexible fitting into density map.
(a) AlphaFold2 (ref. ) prediction of FlgP (dark grey) required bending of the oligomer to fit the curvature of the first ring of the basal disk (purple). (b) AlphaFold2 prediction of PflC1 required independent rigid-body docking of the N- and C-terminal domains (magenta). (c) The resulting N-terminal domain of PflC was rigid-body docked into density multiple times for PflC2–7. C-terminal domains were not modelled. Higher thresholds required for more peripheral, and presumably more flexible, components. (d) PflA and PflB AlphaFold2 models (dark grey) required bending to fit into density maps (pale and dark green for PflA and PflB, respectively).
Extended Data Fig. 5
Extended Data Fig. 5. Discrete steps in flagellar rotation are similar to those in Escherichia coli.
(a) Kernel density estimation bead position plots over many rotations for 11 cells. Measurements were of duration 20 to 240 s, substantially de-energized by CCCP to slow rotation. Their (x,y) histograms, a kernel density of the angular position, and the weighted power spectrum are depicted. The top left is the trace shown in Fig. 2. (b) Weighted power spectrum of all 11 traces.
Extended Data Fig. 6
Extended Data Fig. 6. PflC forms oligomers in vitro regulated by its C-terminal PDZ domain.
(a) Size Exclusion Chromatography of PflC (red) along with protein standards (grey) showing elution volume. (b) Calibration graph showing a dimer of PflC (red) corresponding to retention times during elution. (c) Mass photometry measurements of purified PflC (replicates). (d) Size Exclusion Chromatography of PflCN (∆236–349, green) along with protein standards (grey) showing elution volume. (e) Calibration graph of PflCN (green) corresponding to retention times during elution. (f) Mass photometry measurements of purified PflCN. Theoretical masses are shown in the inserts. The instrument’s limit of detection is 35 kDA, meaning the monomer mass is larger than expected.
Extended Data Fig. 7
Extended Data Fig. 7. PflC is a homolog of serine protease HtrA but lacking a catalytic triad.
(a) Needleman-Wunsch global sequence alignments of Campylobacter jejuni PflCN and PflCC with C. jejuni HtrA from ChimeraX MatchMaker using default parameters. Asterisks highlight HtrA His-Asp-Ser catalytic triad not conserved in PflC. Coloured boxes indicate pruned residue pairs between PflCN:HtrAN (red) and PflCC:HtrAC (green) from MatchMaker algorithm using a 4 Å RMSD cutoff (b) Core folds of PflC and HtrA from ChimeraX structural alignment using pruned residue pairs of PflCN and PflCN (left) to HtrA (right) (PDBID: 6Z05) guided by the global alignment in panel A. Pruned core residues are depicted in colour, while non-core residues are depicted in grey. (c) RMSD of PflC alignment to HtrA depicted on the structure of PflC as worm diameter and colour (blue: 0 Å, white: 4 Å, red: 8 Å). (d) Left panel shows PflC and HtrA oriented as with the PflC protomer in Fig. 3c Right panels depict PflC and HtrA rotated similarly to reveal the HtrA active site cleft. Close-up boxes include stick representation of residues, highlighting HtrA’s H119:D150:S224 catalytic triad, and PflC’s N65 and S122 residues that sequence align to D150 and S224, revealing divergence and atrophy of the active site region in PflC.
Extended Data Fig. 8
Extended Data Fig. 8. PflC and HtrA share a common fold and topology.
(a) Automated secondary structure annotation of HtrA using the ChimeraX implementation of the Defining the Secondary Structure of Proteins algorithm (top); and PflC (bottom) with HtrA nomenclature transferred based on structural correspondence. (b) Topology diagram of HtrA and PflC generated using PDBsum. Note that due to algorithmic nuances, PDBsum’s secondary structure definitions do not exactly correspond to those of DSSP. Locations of the three catalytic triad residues H119, D150 and S224 are labelled.
Extended Data Fig. 9
Extended Data Fig. 9. Mass photometry shows that PflA dimerises with PflB via its N-terminal β-sandwich domain.
(a–d) Mass photometry measurements of purified PflA and PflB constructs show the proteins are mainly monodisperse. There is a dimer peak present for the PflAΔCter construct, likely due to a reduction in stability and solubility. (e–g) Mass photometry measurements of mixtures of PflB and PflA variants. Dimer peaks appear only when β-sandwich and linker domain of PflA is present. In panels E and G, monomer peaks of PflA and PflB are not resolved due to their similar molecular weights. In the bottom panel, the 54 kDa peak corresponds to PflAΔCter, and the 79 kDa peak to PflB. Broadly, monomer peaks have a yellow background, dimer peaks red.

Update of

References

    1. Johnson, A. D. The rewiring of transcription circuits in evolution. Curr. Opin. Genet. Dev.47, 121–127 (2017). - PMC - PubMed
    1. Bridgham, J. T., Carroll, S. M. & Thornton, J. W. Evolution of hormone-receptor complexity by molecular exploitation. Science312, 97–101 (2006). - PubMed
    1. Finnigan, G. C., Hanson-Smith, V., Stevens, T. H. & Thornton, J. W. Evolution of increased complexity in a molecular machine. Nature481, 360–364 (2012). - PMC - PubMed
    1. Pillai, A. S. et al. Origin of complexity in haemoglobin evolution. Nature581, 480–485 (2020). - PMC - PubMed
    1. Schulz, L. et al. Evolution of increased complexity and specificity at the dawn of form I Rubiscos. Science378, 155–160 (2022). - PubMed

MeSH terms

Substances

LinkOut - more resources