. 2025 Jul;10(7):1630-1647.
doi: 10.1038/s41564-025-02032-5. Epub 2025 Jul 1.

Human gut bacteria bioaccumulate per- and polyfluoroalkyl substances

Affiliations

Human gut bacteria bioaccumulate per- and polyfluoroalkyl substances

Anna E Lindell et al. Nat Microbiol. 2025 Jul.

Abstract

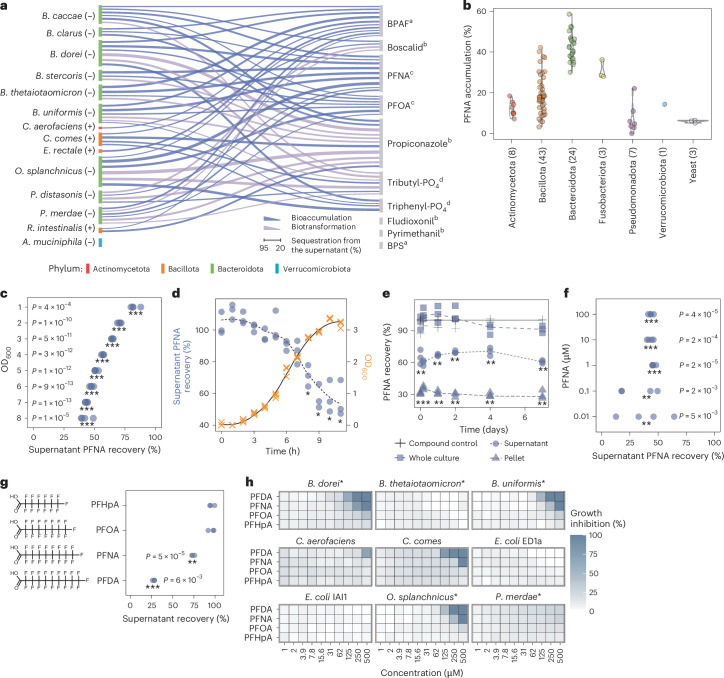
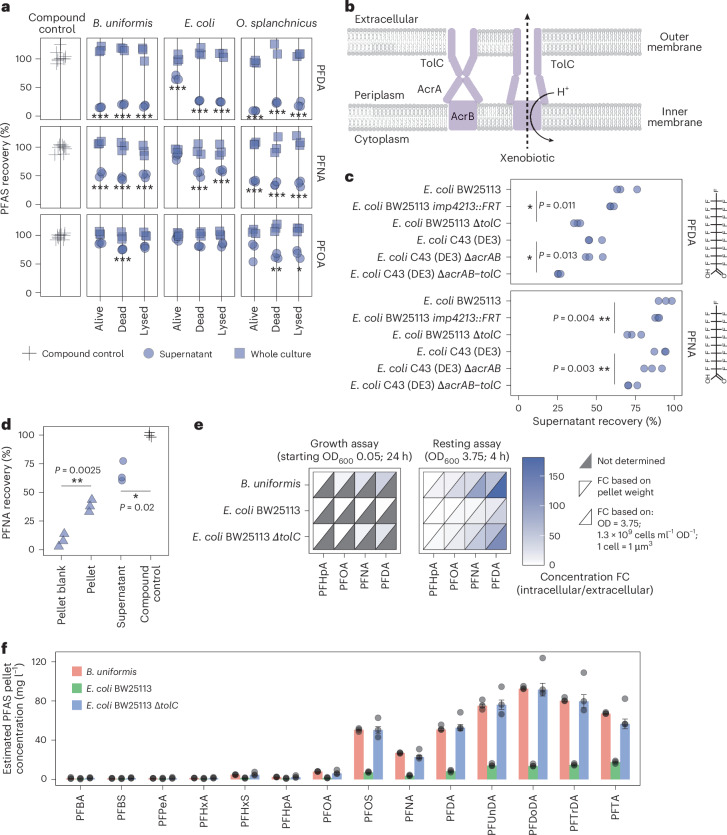
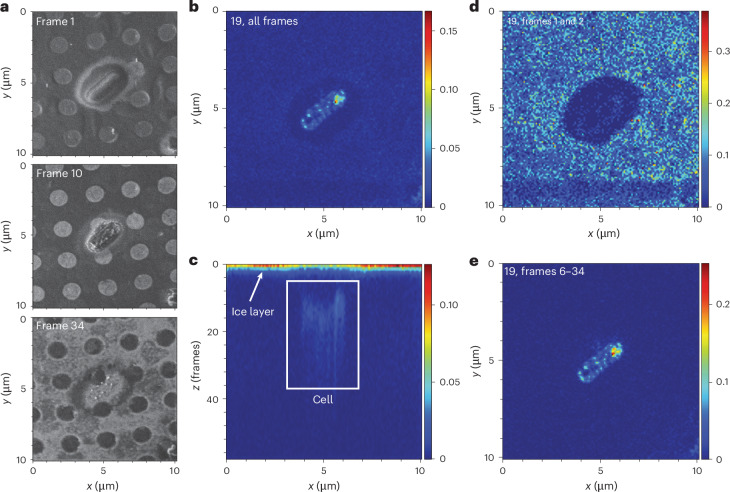
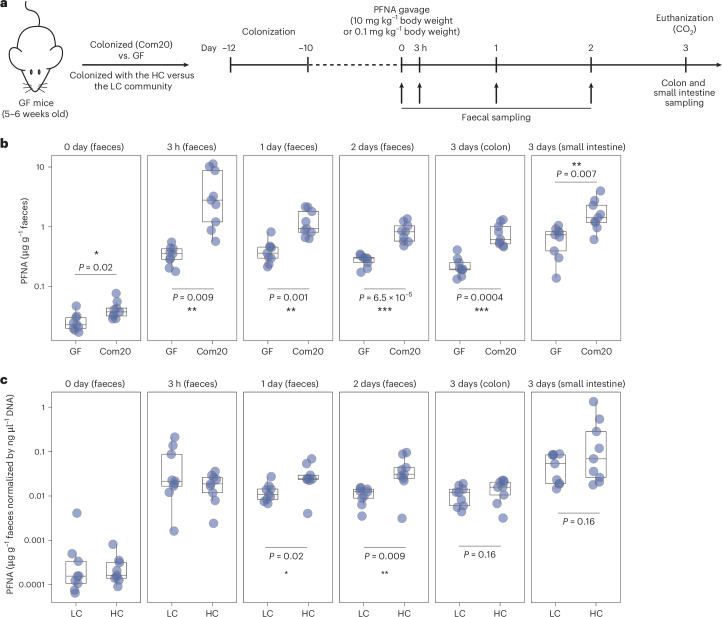
Per- and polyfluoroalkyl substances (PFAS) are persistent pollutants that pose major environmental and health concerns. While few environmental bacteria have been reported to bind PFAS, the interaction of PFAS with human-associated gut bacteria is unclear. Here we report the bioaccumulation of PFAS by 38 gut bacterial strains ranging in concentration from nanomolar to 500 μM. Bacteroides uniformis showed notable PFAS accumulation resulting in millimolar intracellular concentrations while retaining growth. In Escherichia coli, bioaccumulation increased in the absence of the TolC efflux pump, indicating active transmembrane transport. Cryogenic focused ion beam secondary-ion mass spectrometry confirmed intracellular localization of the PFAS perfluorononanoic acid (PFNA) in E. coli. Proteomic and metabolomic analysis of PFNA-treated cells, and the mutations identified following laboratory evolution, support these findings. Finally, mice colonized with human gut bacteria showed higher PFNA levels in excreted faeces than germ-free controls or those colonized with low-bioaccumulating bacteria. Together, our findings uncover the high PFAS bioaccumulation capacity of gut bacteria.


Conflict of interest statement

Competing interests: A.E.L. and K.R.P. are inventors in a patent application related to the findings presented in the paper (UK patent application number 2215307.6). A.E.L., J.E.D.T. and K.R.P. are co-founders of Cambiotics ApS. The other authors declare no conflicts of interest.

Figures

Fig. 1
Fig. 1. Abundant gut bacterial species bioaccumulate and tolerate PFAS over a broad concentration range.
a, Specificity of human gut bacteria to sequester (bioaccumulate and biotransform) chemical pollutants during a 24-h growth period as identified using mass spectrometry. Links between bacterial species and pollutant denote >20% depletion. The link thickness is proportional to the median depletion from 6 replicates (3 biological, 2 technical; initial pollutant concentration = 20 μM) (Supplementary Tables 7 and 8). C. comes, Coprococcus comes; E. rectale, Eubacterium rectale; P. merdae, Parabacteroides merdae; R. intestinalis, Roseburium intestinalis. Compound class: abisphenols, bpesticides, cper- and polyfluorinated alkyl substances, dsolvent and plasticizer. b, PFNA bioaccumulation in 89 strains spanning major bacterial phyla, and three yeasts. OD600 = 3.75; initial PFNA concentration = 20 μM (9.3 mg l−1); n = 3 technical replicates (Supplementary Tables 3 and 9). c, PFNA depletion by B. uniformis cultures at different OD600 values in PBS buffer and PFNA exposure concentration of 20 μM. P values are based on two-sided t-test; ***P < 0.001; n = 4 technical replicates (Supplementary Table 10). d, Kinetics of PFNA depletion during B. uniformis growth starting with low cell density and 20 μM PFNA. *P < 0.05 and >20% PFNA sequestration from the media compared with the compound control. P = 0.015 (8 h), 0.005 (9 h), 0.012 (10 h) and 0.014 (11 h); two-sided t-test; n = 3 biological replicates (Supplementary Tables 11 and 12). e, Kinetics of PFNA depletion by B. uniformis at high cell density in PBS over 7 days (OD600 = 3.75; initial PFNA concentration = 20 μM). Two-sided t-test; **P value < 0.01; ***P value < 0.001 (supernatant compared with the compound control; pellet compared with 0); n = 3 biological replicates (Supplementary Table 13). Exact P values in Supplementary Table 48. f, PFNA is significantly bioaccumulated by B. uniformis grown in mGAM at a range of initial concentrations (initial OD600 = 0.05; initial PFNA concentrations = 0.01–100 μM) compared with the compound control. Two-sided t-test; P value FDR corrected for number of concentrations tested; **adjusted (adj.) P value < 0.01; ***adj. P value < 0.001; n = 4 technical replicates (Supplementary Table 14). g, Bioaccumulation of PFAS compounds with varying chain length by B. uniformis (OD600 = 3.75; initial concentration for all compounds = 20 μM (PFHpA, 7,280 µg l−1; PFOA, 8,280 µg l−1; PFNA, 9,280 µg l−1; PFDA, 10,280 µg l−1)). Two-sided t-test; **P value < 0.01; ***P value < 0.001; n = 3 technical replicates (Supplementary Table 15). h, Growth sensitivity of gut bacteria to PFAS is independent of bioaccumulation (n = 3 technical replicates). Asterisks denote bioaccumulating bacteria (Supplementary Tables 16 and 17).
Fig. 2
Fig. 2. Gut bacteria concentrate diverse PFAS molecules and can export through a TolC-dependent mechanism in E. coli.
a, PFAS bioaccumulation by live, dead (heat inactivated) and lysed (heat inactivated, freeze-thawed and sonicated) B. uniformis, E. coli and O. splanchnicus cultures (OD600 = 3.75) in PBS buffer. Two-sided t-test; P value FDR corrected for number of strains and compounds tested; *adj. P value < 0.05; **adj. P value < 0.01; ***adj. P value < 0.001 and >20% reduction compared with the compound control; n = 3 technical replicates (Supplementary Table 18). b, AcrAB-TolC efflux pump schematic. The resting state of the pump is depicted on the left. The pump changes conformation to export the xenobiotic (right). TolC can work in combination with other pumps,,. c, Bioaccumulation of PFDA and PFNA by wild-type E. coli strains and corresponding efflux and permeability mutants. Efflux mutants E. coli BW25113 ∆tolC and E. coli C43 (DE3) ∆acrAB-tolC showed a ~1.5-fold increase in PFDA and ~5-fold increase in PFNA bioaccumulation. OD600 = 3.75; exposure concentration = 20 µM (PFNA, 9.3 mg l−1; PFDA, 10.3 mg l−1); two-sided t-test; *P value < 0.05; **P value < 0.01 compared with the corresponding wild type; n = 3 technical replicates (Supplementary Table 19). d, PFNA bioaccumulation by B. uniformis at 0.34 nM (160 ng l−1) exposure. Around 37% of PFNA is sequestered from the media into the bacterial pellet. Two-sided t-test (supernatant compared with the compound control; pellet compared with the pellet control); *P value < 0.05; **P value < 0.01; n = 3 biological replicates (Supplementary Tables 20 and 21). e, Capacity of gut bacteria to concentrate PFAS from the media into the bacterial pellet in a growth assay in mGAM or resting assay in PBS at 5 µM PFAS exposure (growth assay: initial OD600 = 0.05, 24-h incubation; resting assay: OD600 = 3.75, 4-h incubation). n = 3 technical replicates (Supplementary Table 22). f, PFAS recovery from the bacterial pellets after 1 h of exposure in PBS (OD600 = 3.75, PFAS mix of 14 compounds each at a concentration of 1 mg l−1). The bars depict the median concentration based on pellet weight; the error bars show standard error; n = 3 technical replicates shown as circles (Supplementary Table 23).
Fig. 3
Fig. 3. FIB-SIMS imaging shows intracellular bioaccumulation of PFAS by E. coli ∆tolC.
A given area of the sample is imaged by scanning over it repeatedly with a gallium focused ion beam and analysing the chemical composition of the ablated material using FIB-SIMS. Shown is one of 120 cells imaged (additional images in Extended Data Fig. 6 and Supplementary Data). a, Secondary electron images (formed by secondary electrons resulting from the FIB scanning) of three different Z-frames of the sample, that is, at three different positions along the z-stack, provide spatial images of the imaged cells. The cells are fully embedded in ice in the first panel (frame 1), the second panel (frame 10) shows the interior of the cell and the last panel (frame 34) features the substrate with the cell almost completely removed. be, Top (b) and side (c) views of the three-dimensional stack of SIMS data for a mass-to-charge ratio of 19, corresponding to fluorine (F), in which the colour scale represents the ion count per extraction. The top view (b) shows the lateral distribution (xy) of fluorine within the imaged area that is inside the cells. The side view (c), corresponding to an x–z slice through the stack: for the first few frames, there is a fluorine signal from the whole field of view, stemming from the thin ice layer covering the sample (white arrow in c). The fluorine signal away from the cells drops to zero within the first frames. As the cells are initially covered in ice, in the first frames, no highly localized fluorine signal is observed from the cells, as shown by the top view generated from the initial frames (d). Once the ion beam mills into the cell, a fluorine signal from the cell can be seen both in the side view (c, marked by a white rectangle) and in the top view generated from the corresponding slices (e), confirming that the fluorine signal originates from inside the cell.
Fig. 4
Fig. 4. Bioaccumulation of PFNA affects bacterial physiology.
a, Proteomics analysis shows proteins that are differentially abundant between B. uniformis treated with 20 µM PFNA and those treated with DMSO. The red and green dots mark proteins with a log2(abundance ratio) > 1 or < −1 (that is, twofold increase or decrease) and a multiple-testing corrected P value of less than 0.05; n = 6 biological replicates (Supplementary Table 24). The circle marks a protein from the RND efflux system (gene ID 962 corresponds to protein R9I2L8), for which nine missense variants within the coding region of the gene were identified in populations evolved under high PFAS concentrations (Supplementary Table 4). P values were calculated using analysis of variance followed by Benjamini–Hochberg correction for multiple testing. b,c, TPP analysis of E. coli BW25113 wt (wild type; low-PFNA bioaccumulating) (b) and E. coli BW25113 ΔtolC (high-PFNA bioaccumulating) (c). Lysate and live cells incubated with PFNA look more similar for E. coli BW25113 ΔtolC mutant compared with the wild type, supporting increased bioaccumulation in ΔtolC mutants. Each data point represents the summed log2(FC) across all temperatures for a specific protein. Black dashed line, diagonal; blue line, linear regression with 95% confidence interval (Supplementary Table 25). d, Principal component (PC) analysis shows a clear distinction between B. uniformis pellet samples treated with 20 µM PFNA and the control; n = 6 biological replicates (Supplementary Table 26). e, Aspartic acid, glutamic acid and glutamine concentrations in B. uniformis pellet and supernatant samples; n = 6 biological replicates (Supplementary Table 26). P values were calculated using two-sided t-test and corrected for multiple testing using the Benjamini–Hochberg method.
Fig. 5
Fig. 5. PFNA levels in the mouse faeces and gastrointestinal tract are microbiota dependent.
a, Experimental setup for comparison of faecal excretion between GF mice and mice colonized with human gut bacteria (Com20) or comparison between mice colonized with high-PFNA bioaccumulating gut bacteria (HC) and mice colonized with low-PFNA bioaccumulating gut bacteria (LC). b, Mice colonized with a community of 20 human gut bacterial strains (Com20) show higher PFNA excretion after 10 mg kg−1 body weight PFNA exposure compared with GF controls. Box plot: centre = 50th percentile, bounds of box = 25th and 75th percentiles, lower and upper whiskers = lower and upper hinges ± 1.5 × interquartile range; two-sided t-test; P values are FDR corrected; n = 9 mice per group (Supplementary Table 27). c, Mice colonized with a community of HC show higher PFNA excretion after 10 mg kg−1 body weight PFNA exposure compared with mice colonized with LC. Box plot: centre = 50th percentile, bounds of box = 25th and 75th percentiles, lower and upper whiskers = lower and upper hinges ± 1.5 × interquartile range; two-sided t-test; P values are FDR corrected; n = 9 mice per group (Supplementary Table 28). All y-axes are on log10 scale. In b,c, *P value < 0.05; **P value < 0.01; ***P value < 0.001.
Extended Data Fig. 1
Extended Data Fig. 1. Method setup and results from the community-screen.
a. Method workflow for the artificial community experiment. Each community consisted of 10 bacteria (community 1: Bacteroides caccae, Bacteroides dorei, Bacteroides thetaiomicron, Bacteroides uniformis, Bacteroides vulgatus, Colinsella aerofaciens, Coprococcus comes, Eubacterium rectale, Parabacteroides merdae, Roseburia intestinalis; community 2: Akkermansia muciniphila, Bacteroides clarus, Bacteroides stercoris, Clostridium difficile, Eggerthella lenta, Eubacterium eligens, Fusobacterium nucleatum subsp. animalis, Odoribacter splanchnicus, Parabacteroides distastonis, Ruminococcus bromii). b. 13 out of 42 tested pollutants were sequestered by at least one synthetic gut bacterial community. Coloured squares denote sequestration, that is, >20% reduction from the bacteria-free supernatant. PFAS are marked in blue. n = 6 (3 biological and 2 technical replicates) (Supplementary Table 31). c. Method workflow for the single strain experiment.
Extended Data Fig. 2
Extended Data Fig. 2. Abundant gut bacterial species bioaccumulate PFAS.
a. Distribution of PFNA accumulation across all 89 strains (Supplementary Tables 3,9). b. Gram-negative strains show on average higher PFNA accumulation compared to gram-positive strains (Supplementary Tables 3,9). c. Comparison of PFNA accumulation from the resting assay in PBS compared to the growth assay in mGAM (Fig. 1a) show strong positive correlation (Pearson correlation: r = 0.76, p-value = 0.002; Spearman rank correlation: ⍴ = 0.64, p-value = 0.015). d. Data from Fig. 1c including compound control and whole culture samples. PFNA depletion by B. uniformis cultures of varying OD600 in PBS buffer. All ODs show significant PFNA accumulation compared to the compound control. OD600 = 1–8; 20 μM initial PFNA concentration; two-sided t-test; *** p < 0.001; n = 4 technical replicates (Supplementary Table 10). e. Data from Fig. 1d including compound control and whole culture samples. Kinetics of PFNA depletion during B. uniformis growth starting with low cell density. A significant amount of PFNA was sequestered from the media after 8 h of growth and onwards. Initial OD600 = 0.05; 20 μM initial PFNA concentration; * p<0.05 and >20% PFNA sequestration from the media (Supplementary Tables 11,12). p = 0.015 (8h), 0.005 (9h), 0.012 (10h), and 0.014 (11h) (two-sided t-test; n = 3 biological replicates). f. Kinetics of PFNA depletion by B. uniformis when starting with high cell density in mGAM (OD600 = 4). Bioaccumulation of ca. 50% PFNA happens within the time frame of sample collection (ca. 5 min). two-sided t-test; ** p-value < 0.01; *** p-value < 0.001; n = 2 biological replicates (Supplementary Table 32). g. Data from Fig. 1g including compound control and whole culture samples. Bioaccumulation of PFAS compounds with varying chain length by B. uniformis. PFNA and PFDA are significantly accumulated compared to the compound control. OD600 = 3.75; 20 μM initial concentration for all compounds; two-sided t-test; ** p-value < 0.01; *** p-value < 0.001; n = 3 technical replicates (Supplementary Table 15). h. Data from Fig. 1f including compound control and whole culture samples. PFNA is bioaccumulated by B. uniformis grown in mGAM at a range of initial concentrations compared to the compound control. initial OD600 = 0.05; initial PFNA concentrations = 0.01 to 100 μM; Two-sided t-test; p-value FDR corrected for number of concentrations tested; ** adj. p-value < 0.01; *** adj. p-value < 0.001; n = 4 technical replicates (Supplementary Table 14). i. PFNA and PFOA are bioaccumulated by B. uniformis in PBS at a range of initial concentrations. OD600 = 3.75; initial PFAS concentrations = 0.78 to 500 μM; Two-sided t-test; p-value FDR corrected for number of concentrations tested; ** adj. p-value < 0.01; *** adj. p-value < 0.001; n = 3 technical replicates (Supplementary Table 33).
Extended Data Fig. 3
Extended Data Fig. 3. PFAS bioaccumulation in cell pellet.
a. Data from Fig. 2c including compound control and whole culture samples. Accumulation of PFDA and PFNA by wild-type E. coli strains and corresponding efflux mutants. OD600 = 3.75; exposure concentration = 20 µM; two-sided t-test; ** p-value < 0.01 and >20% sequestration compared to the compound control; *** p-value < 0.001 and >20% sequestration compared to the compound control; n = 3 technical replicates (Supplementary Table 19). b. Efflux mutants show increased PFAS sensitivity. n = 3 technical replicates (Supplementary Tables 16, 17). c. Independent measurement of samples from Fig. 2d at Imperial College London supports PFNA accumulation by B. uniformis at 160 ng/l exposure concentration. Two-sided t-test (supernatant compared to the compound control; pellet compared to pellet control); * p-value < 0.05; ** p-value < 0.01; n = 3 biological replicates (Supplementary Table 34). d. Data from Fig. 2d displayed in a different way: based on wet pellet weight, concentration within the bacterial pellet was a median of circa 8200 ng/l, which is a 50-fold increase compared to the exposure concentration. Two-sided t-test (supernatant compared to the compound control; pellet compared to pellet control); * p-value < 0.05; ** p-value < 0.01; n = 3 biological replicates (Supplementary Tables 20, 21). e. Data related to Fig. 2e: PFAS recovery from pellet and supernatant after exposure to 5 µM PFAS in mGAM (initial OD600 = 0.05, 24 h incubation) or PBS (OD600 = 3.75, 4 h incubation). Bars depict median percent recovery from the bacterial pellet, supernatant or compound control; error bars depict standard error; overlaid points depict single data points; n = 3 technical replicates; (Supplementary Table 35). f. Data from Fig. 2f including compound control, whole culture and supernatant samples. PFAS recovery after 1 h exposure in PBS (OD600 = 3.75, PFAS mix of 14 compounds each at a concentration of 1 mg/l). For PFAS compounds with a chain length of more than ten carbon atoms, the solubility is limited at this concentration; the low accumulation in E. coli BW25113 wild-type pellets acts as a biological control in this case. Bars depict median percent recovery from the compound control, whole culture, supernatant or bacterial pellet; error bars depict standard error; overlaid points depict single data points; n = 3 technical replicates; (Supplementary Table 36).
Extended Data Fig. 4
Extended Data Fig. 4. Transmission electron microscopy displays morphological changes upon PFAS exposure.
a-f. TEM of B. uniformis cells grown in mGAM + DMSO (59 images from 3 biological replicate) (a), 5 μM PFNA (31 images from 1 biological replicate) (b), 50 μM PFNA (40 images from 1 biological replicate) (c), 125 μM PFNA (51 images from 1 biological replicate) (d), 250 μM PFNA (79 images from 3 biological replicate) (e), or 125 μM PFDA (46 images from 1 biological replicate) (f) for 24 h. g,h. TEM of E. coli. BW25113 wild-type cells grown in mGAM + DMSO (40 images from 1 biological replicate) (g) or 250 μM PFNA (45 images from 1 biological replicate) (h) for 24 h. i,j. TEM of E. coli. BW25113 ∆tolC cells grown in mGAM + DMSO (31 images from 1 biological replicate) (i) or 250 μM PFNA (50 images from 1 biological replicate) (j) for 24 h. k,l. TEM of O. splanchnicus cells grown in mGAM + DMSO (37 images from 1 biological replicate) (k) or 250 μM PFNA (38 images from 1 biological replicate) (l) for 24 h. A tomogram for B. uniformis cells exposed to 250 µM PFNA confirming that the structures are inside the cells is available as a supplementary video.
Extended Data Fig. 5
Extended Data Fig. 5. Morphological data supports intra-cellular accumulation of PFAS.
a-f. Bacteria show distinct morphological features in transmission electron microscopy (TEM). a,b. Automatic identification of bacterial cells (a) and condensates (b) for B. uniformis cells grown in mGAM + 250 µM (116 mg/l) PFNA. 119 images analysed in total including all strains and exposures. c. Mean pixel intensity of bacterial cells show significant differences between DMSO and PFNA treated cells for B. uniformis, E. coli BW25113 and O. splanchnicus; two-sided t-test; p-values FDR corrected; Boxplot: centre = 50th percentile, bounds of box = 25th and 75th percentile, lower/upper whisker = lower/upper hinge −/+ 1.5 * inter quartile range; Number of cells analysed: B. uniformis: DMSO = 141, PFNA_250µM = 178; E. coli (BW25113): DMSO = 115, PFNA_250µM = 61; E. coli (BW25113) ∆tolC: DMSO = 56, PFNA_250µM = 14; O. splanchnicus: DMSO = 76, PFNA_250µM = 57 (Supplementary Table 37). d. Condensate count per bacterial cell show significant increase in condensates for B. uniformis and O. splanchnicus, supporting morphological changes through PFNA exposure; two-sided t-test; p-values FDR corrected; Number of cells analysed: B. uniformis: DMSO = 141, PFNA_250µM = 178; E. coli (BW25113): DMSO = 115, PFNA_250µM = 61; E. coli (BW25113) ∆tolC: DMSO = 56, PFNA_250µM = 14; O. splanchnicus: DMSO = 76, PFNA_250µM = 57 (Supplementary Table 37). e. B. uniformis data from c including data for 5, 50, 125 µM PFNA and 125 µM PFDA. Mean intensity of bacterial cells show significant differences between DMSO and PFNA or PFDA treated cells; two-sided t-test; p-values FDR corrected; Boxplot: centre = 50th percentile, bounds of box = 25th and 75th percentile, lower/upper whisker = lower/upper hinge −/+ 1.5 * inter quartile range; Number of cells analysed: DMSO = 141, PFNA_5µM = 34, PFNA_50µM = 29, PFNA_125µM = 26, PFNA_250µM = 178, PFDA_125µM = 38 (Supplementary Table 37. f. B. uniformis data from d including data for 5, 50, 125 µM PFNA and 125 µM PFDA. Condensate count per bacterial cell show significant increase in condensates for B. uniformis exposed to 50, 125 and 250 µM PFNA, supporting morphological changes through PFNA exposure; two-sided t-test; p-values FDR corrected; Number of cells analysed: DMSO = 141, PFNA_5µM = 34, PFNA_50µM = 29, PFNA_125µM = 26, PFNA_250µM = 178, PFDA_125µM = 38 (Supplementary Table 37).
Extended Data Fig. 6
Extended Data Fig. 6. Cryogenic FIB-SIMS of E. coli ∆tolC exposed to 250 µM PFNA show intra-cellular accumulation of PFAS compared to the DMSO control.
During cryogenic FIB-SIMS imaging, the vitrified sample is scanned by a Gallium focused ion beam (FIB) and time-of-flight secondary electron mass spectrometry (ToF-SIMS) is performed on the secondary ions created by the interaction of ion beam and sample at each scanning position. Thus, the chemical composition of the sample can be visualised pixel-by-pixel. a-c. E. coli ∆tolC exposed to 250 µM PFNA. d-f. E. coli ∆tolC exposed to DMSO control. For both cases, a spatial image of a cell resulting from the secondary electrons created during FIB imaging is shown on the left (a,d). Please note that because the specimens were frozen on a holey cryo-EM grid, round holes in the film are additionally observed, in addition to the elongated cells. On the right (b,c,e,f), ToF-SIMS images of the same cell are shown for mass-to-charge ratios 19 and 63, corresponding to F and PO2, respectively. The colour bars indicate ion count, that is, regions shown in red are those where the most ions of the particular species were detected. F signal indicates the presence of PFNA, PO2 was chosen as a comparison as it occurs in most bacterial cells and hence is a reliable marker for cells in negative SIMS imaging mode. In E. coli ∆tolC cells exposed to PFNA, a strong F signal is observed within the cell (b), which is not the case for the DMSO treated cells (e), in which a faint background signal can only be observed when adjusting the colour scale by several orders of magnitude.
Extended Data Fig. 7
Extended Data Fig. 7. PFAS tolerance and bioaccumulation following adaptive laboratory evolution.
a. Five gut bacterial species were evolved through serial passaging in growth medium containing one of four PFAS compounds (500 μM PFHpA, 500 μM PFOA, 250 μM PFNA, 125 μM PFDA) over 20 days. b. Improved growth of adapted P. merdae in presence of 125 μM PFDA at days 5, 10, 15 and 20 compared to day 0 (day 20: 1.3-fold change, p-value = 0.001). n = 4 independent populations per compound (Supplementary Tables 38,39). c. Improved growth of adapted B. uniformis population in presence of 250 μM PFNA and 125 μM PFDA after 5, 10, 15 and 20 days compared to day 0 (day20 PFNA 7-fold change, p-value = 0.0004; day 20 PFDA 46-fold change, p-value = 0.00003). n = 4 independent populations per compound (Supplementary Tables 38,39). d. Improved growth of adapted E. coli BW25113 ΔTolC population in presence of 500 µM PFHpA, 500 µM PFOA, 250 μM PFNA and 125 μM PFDA at day 20 compared to day 0 (PFHpA 1.3-fold change, p-value = 0.002; PFOA 1.7-fold change, p-value = 0.0006; PFNA 2.3-fold change, p-value = 0.0006; PFDA 1.6-fold change, p-value = 0.00005). n = 4 independent populations per compound (Supplementary Tables 38,39). e. Adapted populations retain PFDA and PFNA bioaccumulation capability. Mean of n = 4 independent populations per compound (Supplementary Table 40).
Extended Data Fig. 8
Extended Data Fig. 8. Proteomics results show effects of PFNA on abundance of proteins.
a-c. Results showing the proteins that are differentially abundant between (a) E. coli BW25113, (b) E. coli BW25113 ΔTolC, and (c) O. splanchnicus treated with 20 µM PFNA in comparison to DMSO. The green and the blue dots mark proteins with a log2 abundance ratio >1 or <−1 (that is, two-fold increase or decrease) and a multiple-testing corrected p-value of less than 0.05. n = 6 biological replicates (Supplementary Table 24).
Extended Data Fig. 9
Extended Data Fig. 9. Effects of PFNA on abundance of metabolites in pellet and supernatant samples.
a. PCA analysis shows clear distinction between bacterial strains, with E. coli wild-type and TolC mutant overlapping. n = 6 biological replicates (Supplementary Table 26). b. PCA analysis of pellet and supernatant samples shows clear distinction of PFNA and DMSO treated cells only for B. uniformis pellet samples (B. uniformis pellet PCA is a replicate of Fig.4d, added for completion). n = 6 biological replicates (Supplementary Table 26). c. Metabolomics analysis show change in intra- and extracellular metabolites. Fold change of analysed metabolites in supernatant and pellet samples of 20 µM PFNA exposed cells compared to control (DMSO) samples. Significance: * p<0.05, p<0.01, * p<0.001. P-values calculated using two-sided t-test and Benjamini-Hochberg correction for multiple testing. n = 6 biological replicates (Data and p-values provided in Supplementary Table 41).
Extended Data Fig. 10
Extended Data Fig. 10. PFNA does not affect gut microbiota composition of mice colonised with human gut bacteria.
a. Gut microbiota composition of mice colonised with 20 human gut bacterial strains (Com20) and exposed to 10 mg/kg body weight by oral gavage on day 0. 17 out of 20 gut bacteria colonised the mice with 7 strains making up 90% of bacterial composition (P. vulgatus, R. gnavus, B. thetaiotaomicron, B. uniformis, A. rectalis, Veillonella parvula, Dorea formicigenerans). The composition in the small intestine differed from that in the feces and colon, with the dominating species being R. gnavus and V. parvula (Supplementary Table 42). b. In the colon and fecal samples 70% of bacteria were classified as high-PFNA accumulating strains, while in the small intestine only 20% of bacteria were classified as high-PFNA accumulating (Supplementary Table 43). c. Gut microbiota composition of mice colonised with a community of five high-PFNA accumulating strains (HC) and five low-PFNA accumulating strains (LC) exposed to 10 mg/kg body weight by oral gavage on day 0. All gut bacteria colonised the mice, but A. muciniphila was present in both HC and LC colonised mice (Supplementary Table 44). d. LC (low-PFNA accumulating community) colonised mice showed higher DNA yields after DNA extraction compared to HC (high-PFNA accumulating community) colonised mice (1.96-fold change, p-value = 0.002), indicating higher bacterial content in LC colonised mice; two-sided t-test; Boxplot: centre = 50th percentile, bounds of box = 25th and 75th percentile, lower/upper whisker = lower/upper hinge −/+ 1.5 * inter quartile range; n = 54 samples per group (Supplementary Table 28). e. HC colonised mice showed higher relative abundance of Acetobacter fabarum spike-in compared to LC colonised mice (2-fold change, p-value = 0.0009), indicating higher bacterial content in LC colonised mice. Two-sided t-test; Boxplot: centre = 50th percentile, bounds of box = 25th and 75th percentile, lower/upper whisker = lower/upper hinge −/+ 1.5 * inter quartile range; Subset of 76 samples (Supplementary Table 45). f. Mice colonised with a community of 20 human gut bacterial strains (Com20) show higher PFNA excretion after 0.1 mg/kg body weight PFNA exposure compared to germfree (GF) controls; Boxplot: centre = 50th percentile, bounds of box = 25th and 75th percentile, lower/upper whisker = lower/upper hinge −/+ 1.5 * inter quartile range; two-sided t-test; p-values are FDR corrected; n = 6 mice per group; y-axes are on log10 scale (Supplementary Table 46).

References

    1. Cousins, I. T., Johansson, J. H., Salter, M. E., Sha, B. & Scheringer, M. Outside the safe operating space of a new planetary boundary for per- and polyfluoroalkyl substances (PFAS). Environ. Sci. Technol.56, 11172–11179 (2022). - PMC - PubMed
    1. Steffen, W. et al. Sustainability. Planetary boundaries: guiding human development on a changing planet. Science347, 1259855 (2015). - PubMed
    1. Frisbee, S. J. et al. The C8 health project: design, methods, and participants. Environ. Health Perspect.117, 1873–1882 (2009). - PMC - PubMed
    1. Caporale, N. et al. From cohorts to molecules: adverse impacts of endocrine disrupting mixtures. Science375, eabe8244 (2022). - PubMed
    1. Calafat, A. M. et al. Serum concentrations of 11 polyfluoroalkyl compounds in the U.S. population: data from the National Health and Nutrition Examination Survey (NHANES). Environ. Sci. Technol.41, 2237–2242 (2007). - PubMed

LinkOut - more resources