

Predicting car accident severity in Northwest Ethiopia: a machine learning approach leveraging driver, environmental, and road conditions
- PMID: 40595301
- PMCID: PMC12217725
- DOI: 10.1038/s41598-025-08005-2
Predicting car accident severity in Northwest Ethiopia: a machine learning approach leveraging driver, environmental, and road conditions
Abstract
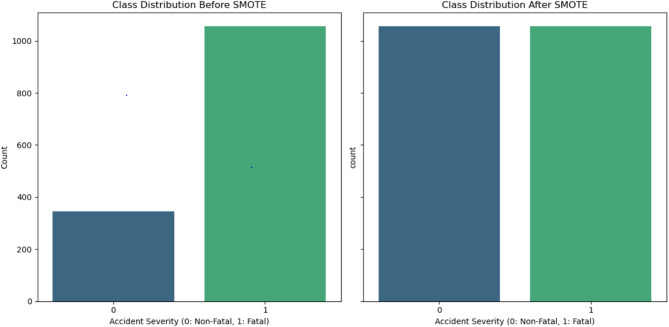
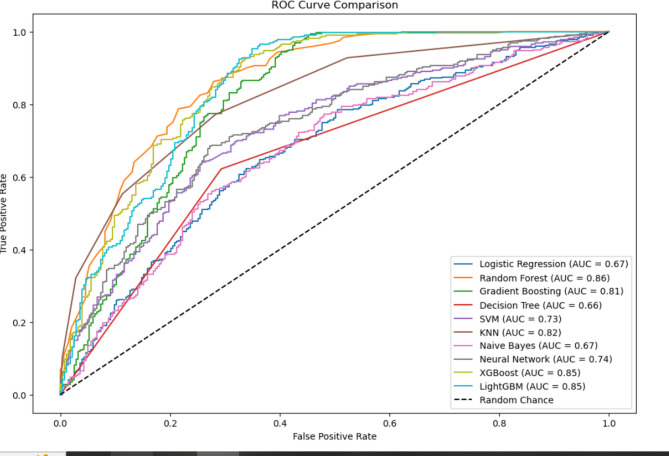
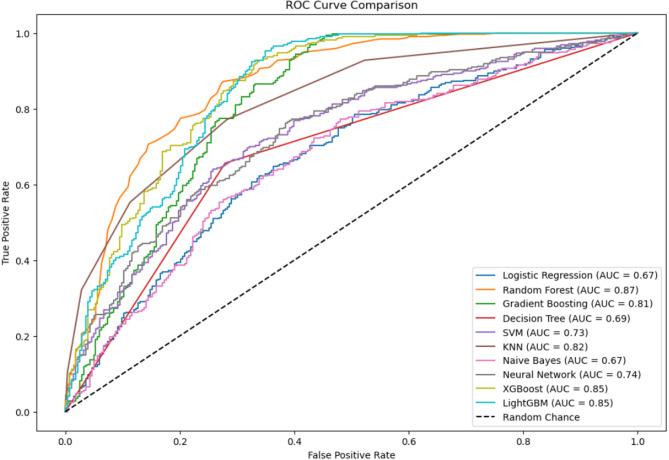
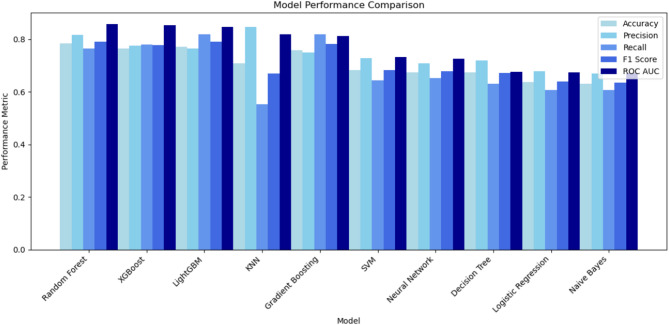
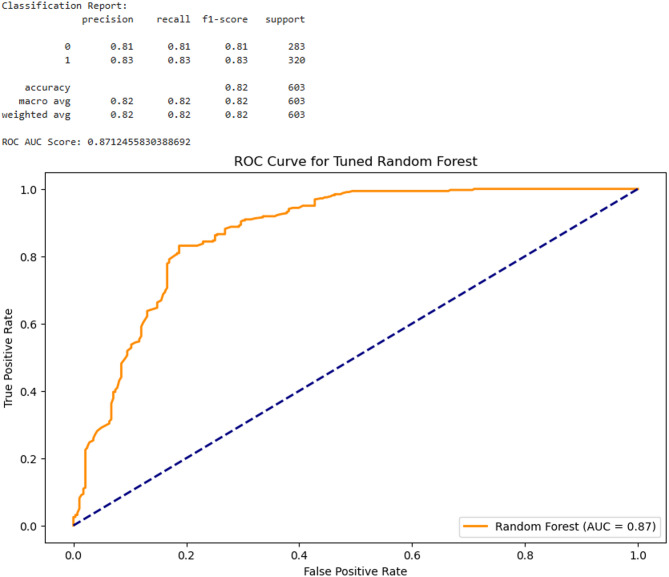
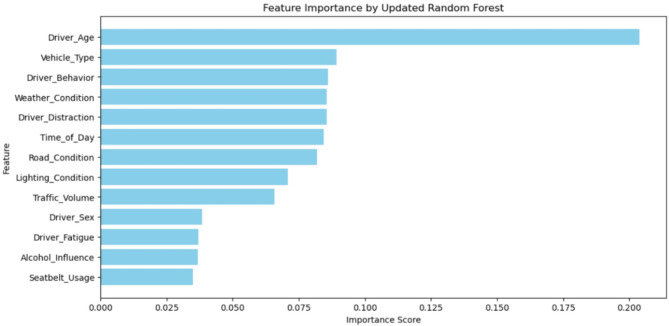
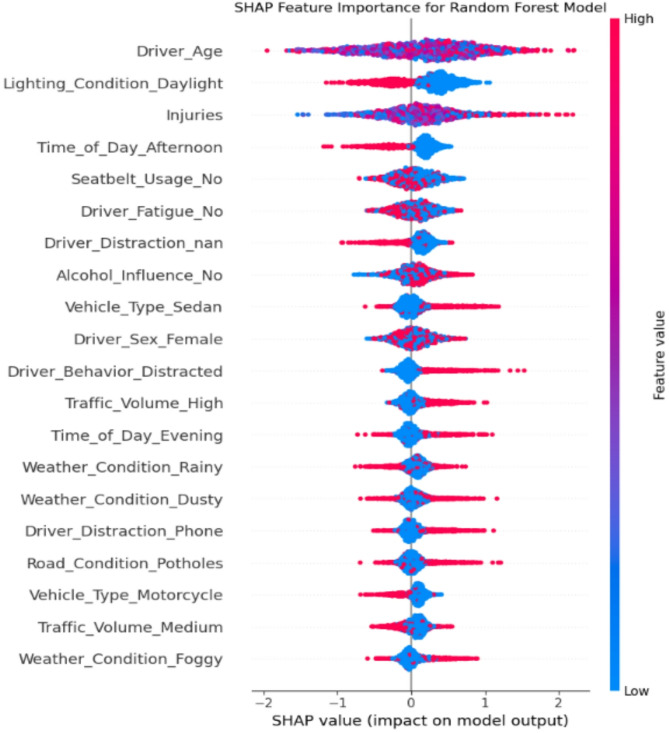
Road traffic accidents (RTAs) in Northwest Ethiopia, a region with a fatality rate of 32.2 per 100,000 residents, pose a critical public health challenge exacerbated by infrastructural deficits and environmental hazards. This study leverages machine learning (ML) to predict accident severity, addressing gaps in localized predictive frameworks for low- and middle-income countries (LMICs). Our study aims to predict the severity of car accidents in Northwest Ethiopia via machine-learning techniques. Using a dataset of 2,000 accidents (2018-2023) from police reports, we integrated driver demographics, behavioral factors (e.g., alcohol use, seatbelt compliance), and environmental conditions (e.g., unpaved roads, weather) in North West Ethiopia. Ten ML models, including Random Forest, XGBoost, and LightGBM, were evaluated after addressing class imbalance via the Synthetic Minority Oversampling Technique (SMOTE). Hyperparameter tuning and Shapley Additive explanations (SHAP) provided model optimization and interpretability. Random Forest outperformed other models, achieving 82% accuracy (AUC-ROC: 0.87) post-tuning. Driver age (mean: 44 years) and environmental factors (e.g., nighttime on unlit roads, rainy conditions) were critical predictors, increasing fatal accident likelihood by 62%. SMOTE improved the accuracy of the outperforming random forest accuracy from 78.6 to 82%. Random Forest exhibited the highest recall (0.82) after optimization, while ensemble methods dominated performance metrics. The study underscores the efficacy of ML in contextualizing accident severity in LMICs, with Random Forest emerging as a robust tool for policymakers. Prioritizing road paving, sobriety checkpoints, and motorcycle safety could mitigate risks, aligning with Sustainable Development Goal 3.6. Future work should address data limitations (underreporting, geospatial gaps) and expand model interpretability.
Keywords: Car accident severity; Ethiopia; Machine learning; Road safety; SHAP; SMOTE.
© 2025. The Author(s).
Conflict of interest statement
Declarations. Competing interests: The authors declare no competing interests. Ethical approval: The study received ethical clearance from the IRB of Debre Markos University, CMHS (College of Medicine and Health Sciences), IRERC (Institutional Review and Ethics Review Committee), aligning with the Declaration of Helsinki. The IRB waived the need for obtaining informed consent for this study. No personal identifiers were collected to safeguard privacy, and all data were anonymized before analysis. Data integrity was maintained through secure protection systems that were compliant with international standards for research. Since it is a piece of recorded information, informed consent from the participants is not feasible, and the consent is from the authorities where the data was collected.
Figures
Similar articles
-
Predicting errors in accident hotspots and investigating satiotemporal, weather, and behavioral factors using interpretable machine learning: An analysis of telematics big data.PLoS One. 2025 Jul 8;20(7):e0326483. doi: 10.1371/journal.pone.0326483. eCollection 2025. PLoS One. 2025. PMID: 40627630 Free PMC article.
-
Supervised Machine Learning Models for Predicting Sepsis-Associated Liver Injury in Patients With Sepsis: Development and Validation Study Based on a Multicenter Cohort Study.J Med Internet Res. 2025 May 26;27:e66733. doi: 10.2196/66733. J Med Internet Res. 2025. PMID: 40418571 Free PMC article.
-
Understanding the determinants of treated bed net use in Ethiopia: A machine learning classification approach using PMA Ethiopia 2023 survey data.PLoS One. 2025 Jul 7;20(7):e0327800. doi: 10.1371/journal.pone.0327800. eCollection 2025. PLoS One. 2025. PMID: 40622970 Free PMC article.
-
Predictive Performance of Machine Learning for Suicide in Adolescents: Systematic Review and Meta-Analysis.J Med Internet Res. 2025 Jun 16;27:e73052. doi: 10.2196/73052. J Med Internet Res. 2025. PMID: 40522723 Free PMC article. Review.
-
Effects of benzodiazepines, antidepressants and opioids on driving: a systematic review and meta-analysis of epidemiological and experimental evidence.Drug Saf. 2011 Feb 1;34(2):125-56. doi: 10.2165/11539050-000000000-00000. Drug Saf. 2011. PMID: 21247221
References
-
- Bachani, A. M. et al. Road traffic injuries. In Injury Prevention and Environmental Health. 3rd edition (Mock, C. N. et al., ed). The International Bank for Reconstruction and Development/The World Bank. 10.1596/978-1-4648-0522-6_ch3 (2017). - PubMed
MeSH terms
LinkOut - more resources
Full Text Sources
