. 2025 Jul 1;5(1):249.
doi: 10.1038/s43856-025-00975-8.

AI-enabled drug prediction and gene network analysis reveal therapeutic use of vorinostat for Rett Syndrome in preclinical models

Affiliations

AI-enabled drug prediction and gene network analysis reveal therapeutic use of vorinostat for Rett Syndrome in preclinical models

Richard Novak et al. Commun Med (Lond). .

Abstract

Background: Many neurodevelopmental genetic disorders, such as Rett syndrome, are caused by a single gene mutation but trigger changes in expression of numerous genes. This impairs functions of multiple organs beyond the central nervous system (CNS), making it difficult to develop broadly effective treatments based on a single drug target. This is further complicated by the lack of sufficiently broad and biologically relevant drug screens, and the inherent complexity in identifying clinically relevant targets responsible for diverse phenotypes that involve multiple organs.

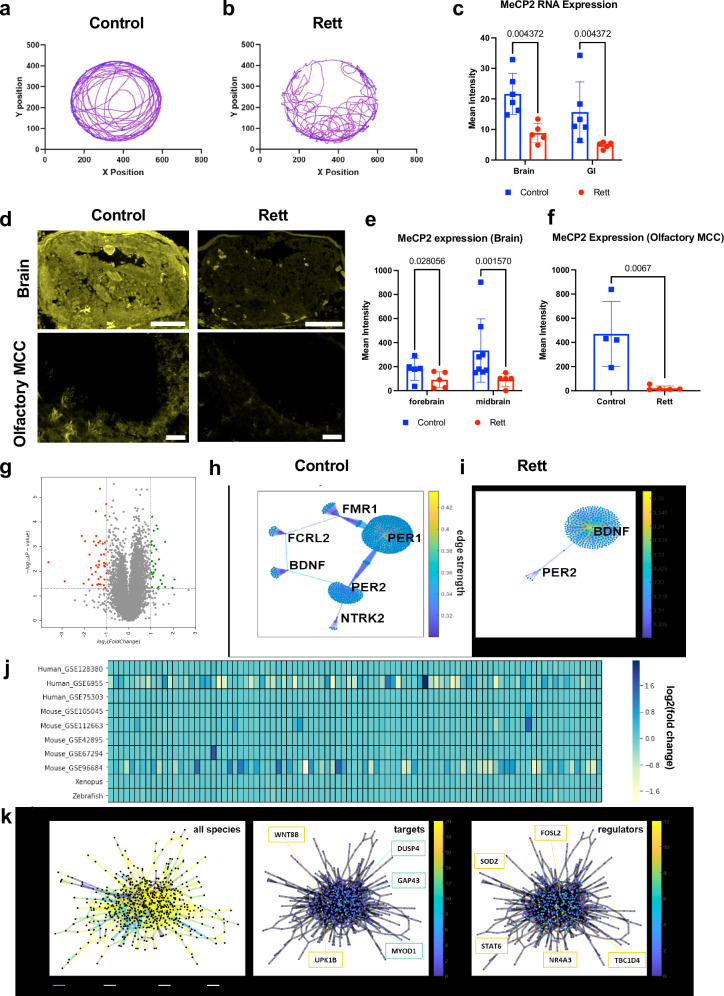
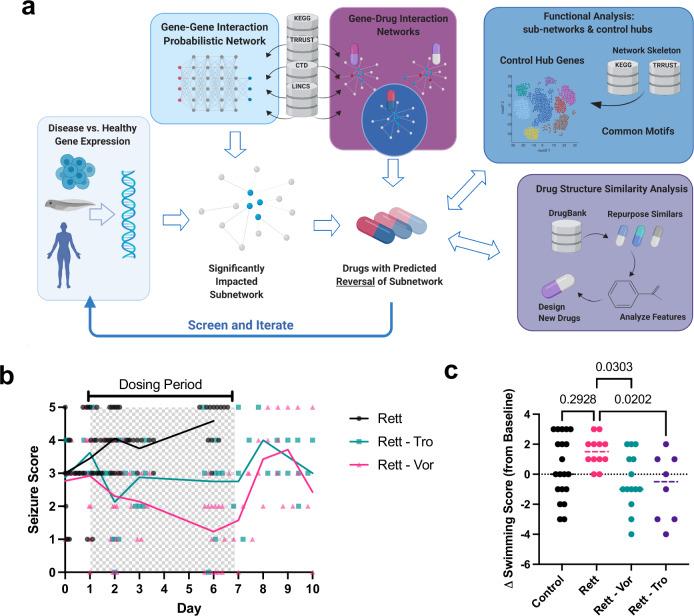
Methods: Here, we use computational drug prediction that combines artificial intelligence, human gene regulatory network analysis, and in vivo screening in a CRISPR-edited, Xenopus laevis tadpole model of Rett syndrome to carry out target-agnostic drug discovery. Four-week-old MeCP2-null male mice expressing the Rett phenotype are used to validate the therapeutic efficacy.

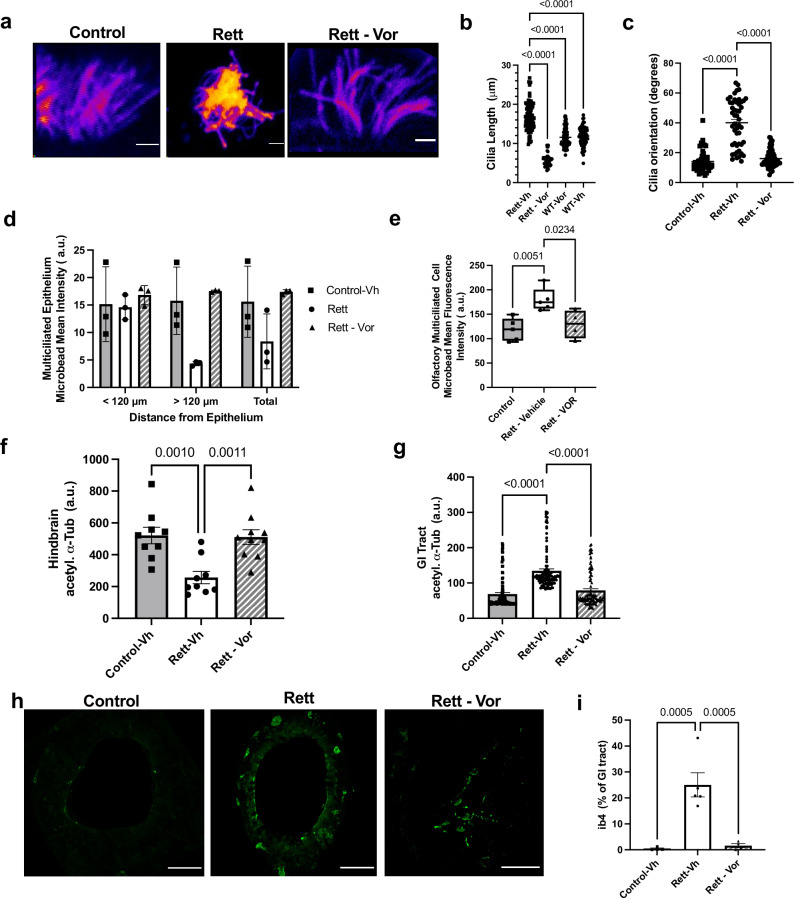
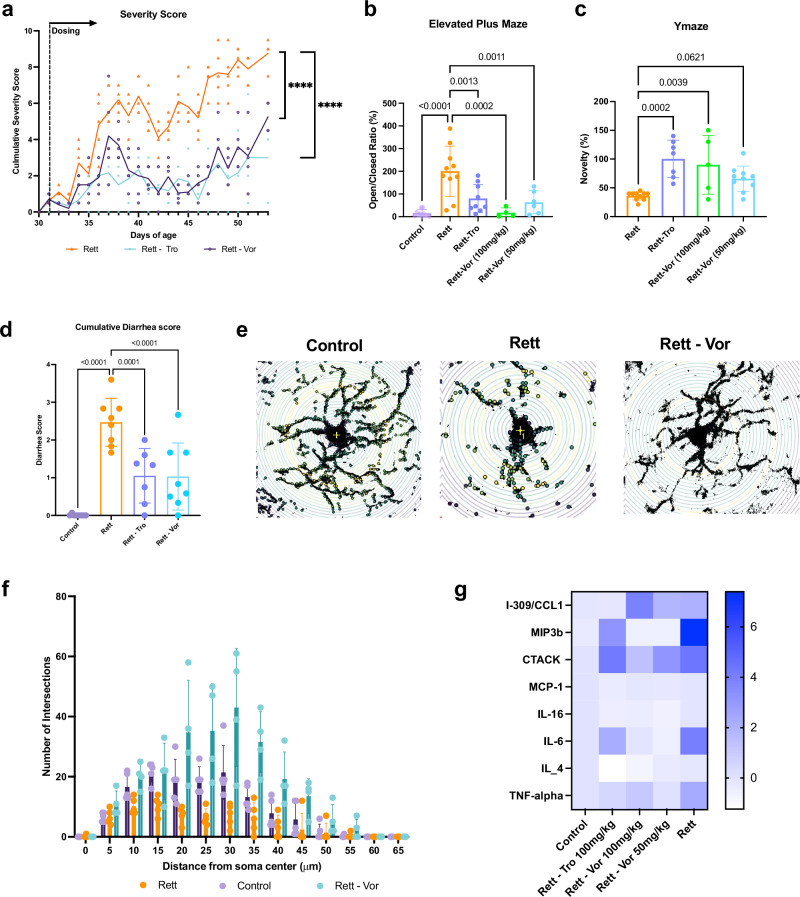
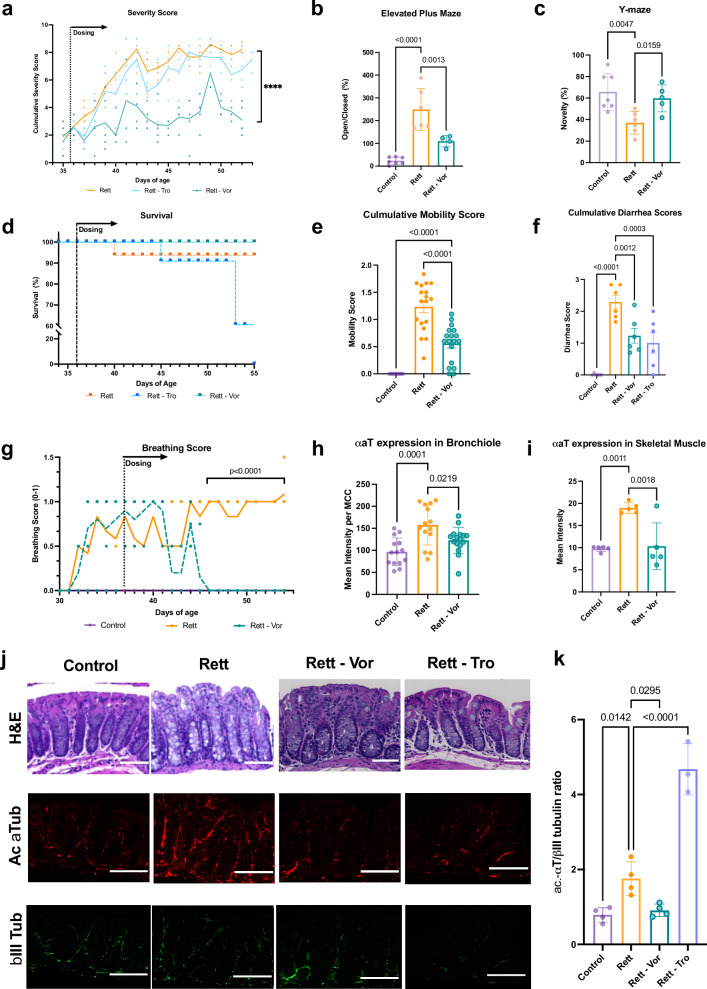
Results: This approach identifies the FDA-approved drug, vorinostat, which broadly improves both CNS and non-CNS (e.g., gastrointestinal, respiratory, inflammatory) abnormalities in X. laevis and MeCP2-null mice. To our knowledge, this is the first Rett syndrome treatment to demonstrate pre-clinical efficacy across multiple organ systems when dosed after the onset of symptoms. Gene network analysis also reveals a putative therapeutic mechanism for the cross-organ normalizing effects of vorinostat based on its impact on acetylation metabolism and post-translational modifications of microtubules.

Conclusions: Although vorinostat is an inhibitor of histone deacetylases (HDAC), it unexpectedly reverses the Rett phenotype by restoring protein acetylation across hypo- and hyperacetylated tissues, suggesting its activity is based on a previously unknown therapeutic mechanism.

Plain language summary

Traditional drug discovery platforms focus on singular targets and take several years to validate treatment efficacy before entering clinical trials. Here, we describe a discovery platform that leverages artificial intelligence (AI) and gene expression profiles in combination with a genetically engineered tadpole and mouse models of a form of autism, known as Rett syndrome, to identify an existing FDA approved anticancer drug (vorinostat) that may be repurposed as a treatment for this condition. We show that vorinostat improves both the neurological and non-neurological symptoms of Rett syndrome in both models. Analysis of vorinostat’s therapeutic action reveals that internal structural elements in cells, known as microtubules, represent a suitable target for treatment of this disease. This AI-based computational discovery platform demonstrates the possibility of rapidly identifying alternative uses for existing FDA approved drugs for treatments of patients with complex genetic disorders.


Conflict of interest statement

Competing interests: R.N., F.V., E.G., S.U., R.Ni., M.L. and D.E.I. hold equity in Unravel Biosciences, Inc.; R.N., F.V., and D.E.I. are members of its board of directors; M.L. and D.E.I. are members of its scientific advisory board; and R.N., F.V., E.G., S.U. and R.Ni. are current or past employees of the company.

Figures

Fig. 1
Fig. 1. MeCP2 knockdown using CRISPR in Xenopus laevis tadpoles models Rett syndrome.
a, b Tadpole models of Rett syndrome exhibit distinct swimming behavior in 60 mm diameter dishes following MeCP2 knockdown (Rett) compared to buffer-injected controls (Control). MeCP2 RNA expression in brain and gastrointestinal (GI) tract using RNAscope (tadpoles per condition: N = 5 Rett, N = 6 Controls) c and MeCP2 protein in brain (tadpoles per condition in the forebrain: N = 5 Rett, N = 5 Controls; in midbrain: N = 5 Rett, N = 8 Controls) d, e and multi-ciliated olfactory cells (tadpoles per condition: N = 5 Rett, N = 4 Controls) f using immunohistochemistry (rabbit anti-MeCP2 and goat anti-rabbit Alexa Fluor 647), are significantly reduced in Rett syndrome tadpole models while maintaining a large degree of heterogeneity spatially d and across tissues, e, f; scale bars, 100 µm in brain, 20 µm in olfactory multi-ciliated cells. All error bars indicate standard deviation g Volcano plot of differentially expressed genes showing that only 70 genes are significantly up- or down-regulated following MeCP2 knockdown (p < 0.05, fold change > 2, t-test with Bonferroni correction, N = 3). Gene regulatory networks for control, h, and Rett i, tadpoles reveal large network rearrangements with an increase in BDNF centrality. j Comparison against other Rett syndrome models and clinical samples indicates minimal differential gene expression across the 96-gene signature developed to classify Rett syndrome. k Network-level comparison across species and tissues (left) and identified shared target (middle) and regulator (right) genes.
Fig. 2
Fig. 2. Network-based computational prediction of effective drugs to treat Rett syndrome in tadpole models.
a Network model for causality-aware discovery (nemoCAD) combines a directed gene-gene and drug-gene interaction network extracted from CTD, TRRUST, and KEGG databases with interaction probabilities inferred from single gene and drug perturbations in LINCS. Transcriptome data from any disease model or patient and corresponding control are used to identify the relevant subnetwork and disease-specific node weights that account for probabilities of up-/down-regulation of a gene. A drug-gene interaction probability matrix, inferred from LINCS, is computationally screened against the disease-specific subnetwork to identify compounds that significantly interact with the subnetwork and are ranked by their predicted ability to restore the disease transcriptome back to a healthy state based on single gene and gene network signatures. Downstream analyses can be performed on the resulting gene-gene interaction subnetwork by interrogating the underlying subnetwork structure to find control nodes and other network metrics. Additionally, the chemical structures of the predicted drugs can be clustered by structural similarity based on SMILES notation and annotated protein targets and pathways from DrugBank data. Created in BioRender. Lin, T. (2025) https://BioRender.com/40iq3jv. b Graph showing relative effects on seizure score over 10 days of treatment in MeCP2 KD and buffer-injected tadpoles of vehicle and 25 µM vorinostat (Rett-Vor) versus 70 mg/mL trofinetide (Rett-Tro), a clinical-stage drug with demonstrated efficacy (tadpoles per condition: N = 13 Rett-Vor, N = 20 Rett-Vehicle, N = 8 Rett-Tro). Vehicle-treated MeCP2 KD tadpoles did not survive past day 3 of the treatment period in one study and past day 6 in a second study. Wild-type Xenopus buffer-injected Controls treated with vehicle and vorinostat did not exhibit seizures. c Changes in swimming score at day 6 of treatment vs. baseline (day 0) is significantly improved by both drugs in Rett tadpoles. Error bars indicate standard deviation.
Fig. 3
Fig. 3. Vorinostat treatment of Rett tadpoles restores ciliary function, normalizes hypo- and hyperacetylated tubulin across tissues, and reduces GI tract inflammation.
a Olfactory cilia abnormalities due to MeCP2 knockdown were restored by treatment with vorinostat (magenta-yellow colormap of fluorescence intensity relative to z-position, cilia stained for tubulin using mouse anti-α acetylated tubulin and goat anti-mouse Alexa Fluor 594, scale bar = 10 µm), significantly restoring their b length (total number of cilium per condition: N = 43 Rett-Vor and N = 92 Rett-Vehicle, N = 89 Control-Vor, N = 69 Control-Vehicle). and c orientation (total number of multiciliated cells counted per condition: N = 60 Rett-Vor and N = 49 Rett-Vehicle, N = 50 Control-Vehicle). Functional rescue of cilia was also observed in both epithelial, d (N = 3 tadpoles per condition), and olfactory multiciliated cells, e in a microbead clearance assay (total number of tadpoles per condition: N = 4 Rett-Vor and N = 5 Rett-Vehicle, N = 5 Control-Vehicle). Despite the canonical HDACi activity of vorinostat, both hypoacetylated tubulin in the hindbrain (N = 10 Rett-Vor and N = 9 Rett-Vehicle, N = 9 Control-Vehicle tadpoles), f as well as hyperacetylated tubulin in the GI tract (distances from the adventitia epithelium: 26 in 1 µm increments), g was normalized. h Representative immunofluorescent cross-sectional views of the Xenopus gastrointestinal tract stained for ib4 and acetyl-α-tubulin with Isolectin B4 FITC Conjugate and mouse anti-alpha acetylated tubulin and goat anti-mouse Alexa Fluor 594, respectively (scale bar = 20 µm; white lines delineate the lumen), and i plot showing that the % of ib4+ cells in the GI tract of tadpoles is increased in Rett tadpoles (N = 4 Rett-Vor and N = 5 Rett-Vehicle, N = 4 Control-Vehicle). Note that the Rett tadpole model has a higher % of ib4+ cells, which is indicative of inflammation and heightened pain response, and that this can be rescued by vorinostat treatment. Error bars indicate standard deviation.
Fig. 4
Fig. 4. Vorinostat rescues multiple Rett syndrome-related CNS and somatic symptoms.
a Bird severity scores measured in MeCP2-/Y mice treated with vehicle (Rett), trofinetide at 100 mg/kg (Rett-Tro), vorinostat at 50 mg/kg (Rett-Vor (50 mg/kg)) along with wild-type littermate controls treated with vorinostat at 50 mg/kg (Control-Vor) (50 mg/kg) from day 31 to 51 of age (N = 5 mice). Although not indicated in the graph, wild-type littermate controls were treated with vorinostat (N = 3) and trofinetide (N = 3) and did not exhibit signs of severity. b elevated-plus maze (ANOVA and Holm-Šídák test; N = 6 Rett -Vor (50 mg/kg), N = 4 Rett -Vor (100 mg/kg), N = 10 Rett-Vehicle, and N = 9 Rett-Tro, N = 12 Control-Vehicle) and, c Y-novelty maze cognitive tests of MeCP2-/Y mice (ANOVA and Holm-Šídák test; N = 10 Rett-Vor (50 mg/kg), N = 5 Rett-Vor (100 mg/kg), N = 10 Rett-Vehicle, and N = 7 Rett-Tro) comparing vorinostat treatment efficacy to vehicle and trofinetide, d cumulative diarrhea score during 12 day experimental period using a 0–3 scale (ANOVA and Holm-Šídák test). Representative images of Sholl analysis of microglial arborization in the mouse olfactory bulb, e and the Sholl analysis graph showing representative the branching profiles of microglia analyzed, f in control versus Rett mice treated with or without vorinostat (ANOVA and Holm-Šídák test; N = 5 microglia; Control vs. Rett, P = 0.0004; Control vs. Vor, P < 0.0001). g Levels of indicated cytokines measured in plasma of control mice versus Rett mice with or without treatment with trofinetide (Rett-Tro, 100 mg/kg), vorinostat (Rett-Vor, 50 mg/kg), or vehicle (Rett) for 3 weeks (mean values shown, N = 4 Rett-Vor (50 mg/kg), N = 4 Rett-Vor (100 mg/kg), N = 10 Rett-Vehicle, and N = 9 Rett-Tro, N = 12 Control-Vehicle, scale at right indicates z-score normalized to wild-type vehicle-treated littermates). The observed baseline inflammatory state in Rett mice agreed with published effects of MeCP2 knockdown mice. Error bars indicate standard deviation.
Fig. 5
Fig. 5. Oral administration of vorinostat in MeCP2-/y mice after the onset of Rett symptoms rescues CNS and somatic symptoms.
a Bird severity scores measured in MeCP2-/Y mice treated with vehicle (Rett) N = 7, trofinetide at 100 mg/kg i.p. (Rett-Tro) N = 5, oral vorinostat at 50 mg/kg (Rett-Vor) N = 6 from day 36 after onset of symptoms, showing significant suppression of symptoms by vorinostat treatment while trofinetide’s effects were indistinguishable from the vehicle control (ANOVA, ****, P < 0.0001). We also tested wild-type littermate controls treated with oral vorinostat at 50 mg/kg (Control-Vor), N = 5, and similar to previous studies, vorinostat and vehicle treated controls did not exhibit any signs of toxicity or disease severity. b elevated-plus maze and, c Y-novelty maze cognitive tests of MeCP2-/Y mice comparing vorinostat treatment efficacy to vehicle and trofinetide (ANOVA and Dunnett’s multiple comparison test; N = 7 Control-Veh, N = 6 Rett-Vehicle, N = 5 Rett- Vor). d survival curve of animals in this study. e Cumulative mobility score using a 0–2 scale during the 14-day period and f cumulative diarrhea scored using a 0–3 scale (ANOVA and Holm-Šídák test, N = 7 Control, N = 6 Rett-Vehicle, N = 5 Rett- Vor during a 12-day period). g breathing difficulty evaluated using a 0–1 score (ANOVA and Dunnett’s multiple comparison test; N = 7 Control, N = 6 Rett-Vehicle, N = 5 Rett-Vor). Graphs showing levels of hyperacetylated a-tubulin in multi-ciliated cells in the bronchiolar epithelium of the lung (ANOVA, and Holm-Šídák test, total number of multi-ciliated cells analyzed; N = 14 Rett and Control, N = 16 Rett-Vor) h and in skeletal muscle, i in mice (N = 5 per condition) treated as described in a. j Hematoxylin and eosin (H&E) stained histological sections of colon from the control and drug-treated mice (top row) and immunofluorescent staining for acetylated α-tubulin with rabbit alpha-acetylated tubulin and goat anti-rabbit Alexa Fluor 633 (middle) and βIII-tubulin with chicken anti-βIII- tubulin with goat anti-chicken Alexa Fluor 488 (bottom) in these sections, scale bar = 100 µm. k Graph showing changes in the βIII-tubulin ratio in drug-treated versus control colon tissues (ANOVA and Holm-Šídák test, N = 4 Control, N = 4 Rett-Vehicle, N = 4 Rett- Vor; N = 3 Rett-Tro). Error bars indicate standard deviation.

Similar articles

References

    1. Chahrour, M. & Zoghbi, H. Y. The story of Rett syndrome: from clinic to neurobiology. Neuron. 56, 422–437 (2007). - PubMed
    1. Renthal, W. et al. Characterization of human mosaic Rett syndrome brain tissue by single-nucleus RNA sequencing. Nat. Neurosci.21, 1670–1679 (2018). - PMC - PubMed
    1. Gabel, H. W. et al. Disruption of DNA-methylation-dependent long gene repression in Rett syndrome. Nature522, 89–93 (2015). - PMC - PubMed
    1. Colvin, L. et al. Describing the phenotype in Rett syndrome using a population database. Arch. Dis. Child.88, 38–43 (2003). - PMC - PubMed
    1. Kerr, A. M. et al. Guidelines for reporting clinical features in cases with MECP2 mutations. Brain Dev.23, 208–211 (2001). - PubMed

LinkOut - more resources