. 2025 Jul 1;15(1):22143.
doi: 10.1038/s41598-025-08501-5.

OCTA changes of retinal microvessels and thickness in moyamoya disease

Affiliations

OCTA changes of retinal microvessels and thickness in moyamoya disease

Xian-Zhe Qian et al. Sci Rep. .

Abstract

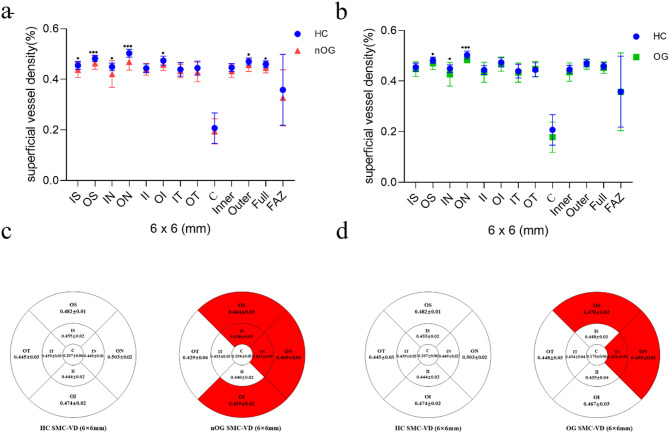
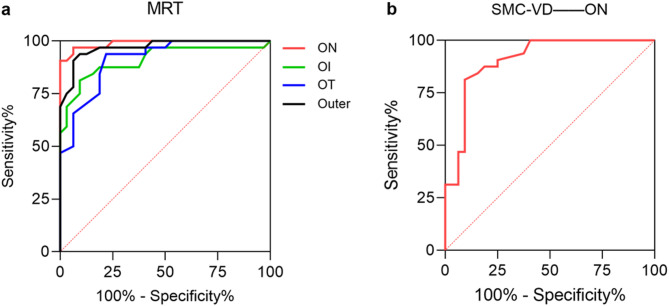
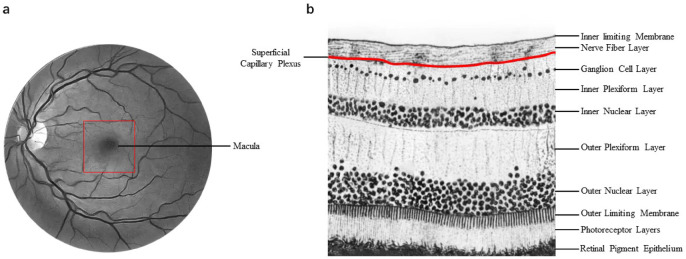
Moyamoya disease (MMD) is a structural abnormality of the cerebral vasculature characterized by cerebral ischemia, and is rare but its incidence is increasing. Digital subtraction angiography (DSA) of the brain is the primary means of diagnosing and evaluating this disease. But its high price and invasiveness limit its use as a monitoring tool for disease progression. As a non-invasive test for ophthalmic disorders, the optical coherence tomography angiography (OCTA) is widely used. In addition to ophthalmic diseases, OCTA has also been used in some neurological diseases. The aim of this study was to assess fundus changes in patients with MMD by OCTA and to investigate whether these changes could be a diagnostic and assessment marker for MMD. This study evaluated cerebral vessels, superficial macular capillary vessel density (SMC-VD) and macular retinal thickness (MRT) in subjects in the non-operated group (nGO), operated group (OG) and healthy controls (HC) using DSA, OCTA and other techniques. Analyses of variance (ANOVA) and Bonferroni post hoc analysis were used to calculate statistical differences between the three groups. Correlations between SMC-VD and MRT were assessed using Pearson correlation analysis. In addition, the ability of the SMC-VD and the MRT to distinguish MMD from HC was analyzed using receiver operating characteristic (ROC) curves. We found that the SMC-VD and MRT in the nOG group were significantly lower than those in the HC group and had not returned to normal levels at one month postoperatively. In the nOG, the SMC-VD and MRT were positively correlated in the Full region (6*6 mm) and in the Inner region (3*3 mm), and in many subregions they showed high ability to distinguish MMD from HC. The above findings indicate significant reduction in the SMC-VD and the MRT in patients with MMD even in the absence of ocular clinical manifestation. Most importantly, SMC-VD and MRT have a strong ability to distinguish between MMD patients and HC, suggesting that OCTA, a relatively inexpensive and non-invasive method, is useful in assessing cerebrovascular changes in MMD patients.

Keywords: Diagnostic markers; Moyamoya disease; OCTA; Retinal thickness; Vessel density.


Conflict of interest statement

Declarations. Competing interests: The authors declare no competing interests. Ethical statement: Every aspect of the work is under the responsibility of the author, including the investigation and resolution of any questions of accuracy or integrity. A Medical Ethics Committee of Nanchang University First Affiliated Hospital (cdyfy2021039) approved the study based on the Declaration of Helsinki (revised 2013). All subjects voluntarily undertook to sign an informed consent form after understanding the potential risks, objectives and methods.

Figures

Fig. 1
Fig. 1
Typical DSA, SMC-VD and MRT images of MMD patients and HC. a and b Anteroposterior view and lateral view of normal ICA angiraphy of HC. c and d internal carotid angiography in a patient with MMD shows abnormal smoke-like vessels. Suzuki is staged in III phases. e and f OCTA showed SMC-VD of 6*6 mm and 3*3 mm size in HC. f and h OCTA showing SMC-VD of 6*6 mm and 3*3 mm size in nOG. i MRT of HC. g MRT of nOG. Compared to HC, patients with MMD showed a significant reduction in SMC-VD and MRT. DSA digital subtraction angiography, SMC-VD superficial macular capillary vessel density, MRT macular retinal thickness, MMD moyamoya disease, nOG non-operated group, HC healthy controls, OCTA optical coherence tomography angiography.
Fig. 2
Fig. 2
SMC-VD analysis of 6*6 mm size in HC group, nOG and OG. a Statistical analysis of SMC-VD changes in the HC and nOG. IS (p = 0.020), OS (p = 0.001), IN(p = 0.016), ON (p < 0.001), OI (p = 0.028), Outer (p = 0.022) and Full (p = 0.042) subregions showed a significant reduction in SMC-VD compared to HC. b Statistical analysis of SMC-VD changes in the HC and OG. The SMC-VD in the OS (p = 0.036), IN (p = 0.040) and ON (p < 0.001) subregions were significantly lower than that in the HC group. c Mean values of SMC-VD (6*6 mm) in each subregion of HC group and nOG. The red area indicates a significant decrease in SMC-VD in this region compared to HC. d Mean values of SMC-VD (6*6 mm) in each subregion of HC group and OG. The red area indicates a significant decrease in SMC-VD in this region compared to HC. *p < 0.05; **p < 0.01; ***p < 0.001. SMC-VD superficial macular capillary vessel density, HC healthy controls, nOG non-operated group, OG operated group, IS inner superior, OS outer superior, IN inner nasal, ON outer nasal, OI outer inferior, FAZ fluorescein angiography zone.
Fig. 3
Fig. 3
SMC-VD analysis of 3*3 mm size in HC group, nOG and OG. a Statistical analysis of SMC-VD changes in the HC and nOG. S (p = 0.001), N (p < 0.001), I (p = 0.042), T (p = 0.001) and Inner (p = 0.002) subregions showed a significant reduction in SMC-VD compared to HC. b Statistical analysis of SMC-VD changes in the HC and OG. SMC-VD was significantly lower in the S (p = 0.026), N (p = 0.002), I (p = 0.039), C (p = 0.018) and Inner (p = 0.020) subregions than in the HC group. c Mean values of SMC-VD (3*3 mm) in each subregion of HC group and nOG. The red area indicates a significant decrease in SMC-VD in this region compared to HC. d Mean values of SMC-VD (3*3 mm) in each subregion of HC group and OG. The red area indicates a significant decrease in SMC-VD in this region compared to HC. *p < 0.05; **p < 0.01; ***p < 0.001. SMC-VD superficial macular capillary vessel density, HC healthy controls, nOG non-operated group, OG operated group, S superior, N nasal, I inferior, T temporal, C center, FAZ fluorescein angiography zone.
Fig. 4
Fig. 4
MRT analysis of HC group, nOG and OG. a Statistical analysis of MRT changes in the HC and nOG. All subregions except subregion C displayed a marked reduction in MRT compared to HC (IT, p = 0.011; p < 0.001 for all remaining regions). b Statistical analysis of MRT changes in the HC and OG. The MRT was markedly thinner in the IS (p = 0.012), IN (p < 0.001), ON (p < 0.001), OT (p < 0.001), outer (p = 0.008) and full (p = 0.023) regions in comparison to the HC group. c Mean values of MRT in each subregion of HC group and nOG. The red area indicates a significant decrease in MRT in this region compared to HC. d Mean values of MRT in each subregion of HC group and OG. The red area indicates a significant decrease in MRT in this region compared to HC *p < 0.05; **p < 0.01; ***p < 0.001. MRT macular retinal thickness, HC healthy controls, nOG non-operated group, OG operated group, IS inner superior, OS outer superior, IN inner nasal, ON outer nasal, II inner inferior, OI outer inferior, IT inner temporal, OT outer temporal, C center, FAZ fluorescein angiography zone.
Fig. 5
Fig. 5
The correlation between MRT and SMC-VD. a Full SMC-VD of 6*6 mm sizes in MMD patients (nOG) was positively correlated with the corresponding MRT (Person r = 0.590, p < 0.001). b In patients with MMD (nOG), a correlation was found between the full SMC-VD of 3 × 3 mm and the corresponding MRT values (Person r = 0.434, p = 0.013). MRT macular retinal thickness, SMC-VD superficial macular capillary vessel density, MMD moyamoya disease, HC healthy controls, nOG non-operated group.
Fig. 6
Fig. 6
ROC curves of MRT and SMC-VD. a The AUC suggests the accuracy of MRT for the diagnosis of MMD. The AUC in the ON (AUC = 0.989), OI (AUC = 0.909), OT (AUC = 0.912) and Outer (AUC = 0.969) subregions was greater than 0.9. b The AUC suggests accuracy of SMC-VD for MMD diagnosis. The AUC in the ON (AUC = 0.907) subregion was greater than 0.9. ROC receiver operating characteristic, MRT macular retinal thickness, SMC-VD superficial macular capillary vessel density, AUC area under ROC curve, MMD moyamoya disease, ON outer nasal, OI outer inferior, OT outer temporal.
Fig. 7
Fig. 7
Anatomical localization of retinal vessels and anatomical stratification of the retina. a The area circled by the red square is the approximate location of the macula as described in the study. b The SMC-VD we focused on in the study was mainly from superficial capillary plexus. SMC-VD superficial macular capillary vessel density.

References

    1. Suzuki, J. & Takaku, A. Cerebrovascular Moyamoya disease. Disease showing abnormal net-like vessels in base of brain. Arch. Neurol.20, 288–299 (1969). - PubMed
    1. Scott, R. M. & Smith, E. R. Moyamoya disease and Moyamoya syndrome. N Engl. J. Med.360, 1226–1237 (2009). - PubMed
    1. Shang, S. et al. Progress in Moyamoya disease. Neurosurg. Rev.43, 371–382 (2020). - PubMed
    1. Kiyoshi, T. S., Sato, M. & Disease Cerebrovascular diseases in children 227–243 (Springer, 1992).
    1. Goto, Y. & Yonekawa, Y. Worldwide distribution of Moyamoya disease. Neurol. Med. Chir. (Tokyo). 32, 883–886 (1992). - PubMed

LinkOut - more resources