. 2025 Jul 1;8(1):978.
doi: 10.1038/s42003-025-08342-y.

Nascent actin dynamics and the disruption of calcium dynamics by actin arrest in developing neural cell networks

Affiliations

Nascent actin dynamics and the disruption of calcium dynamics by actin arrest in developing neural cell networks

Sylvester J Gates 3rd et al. Commun Biol. .

Abstract

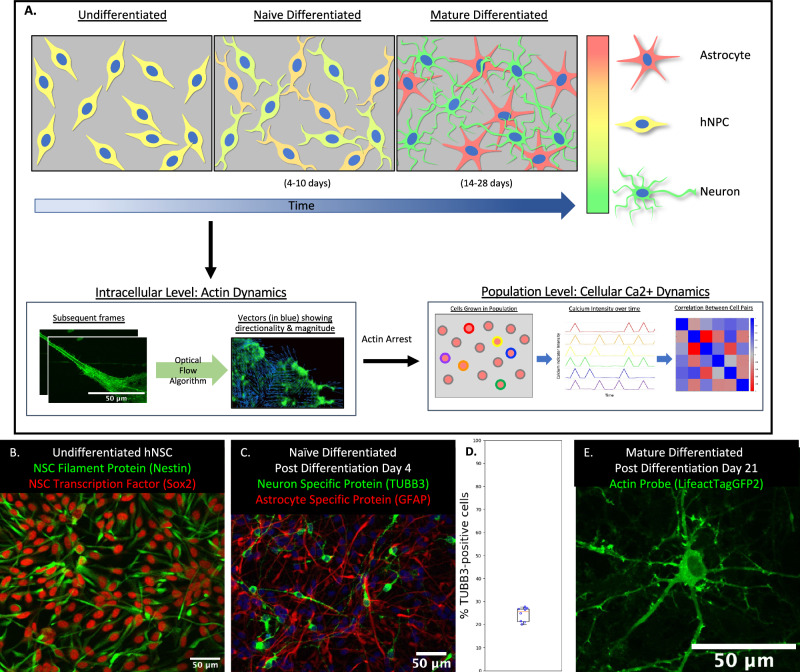
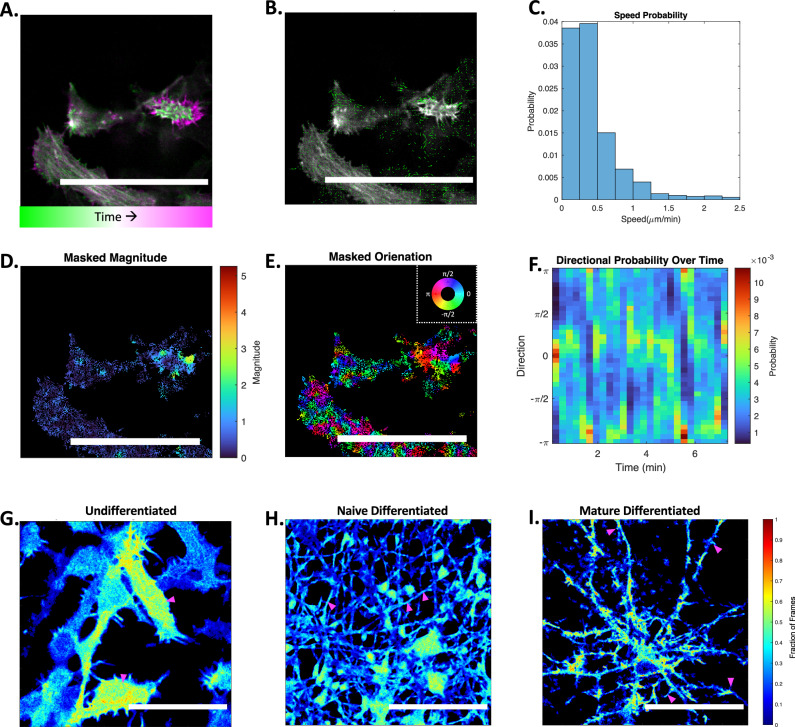
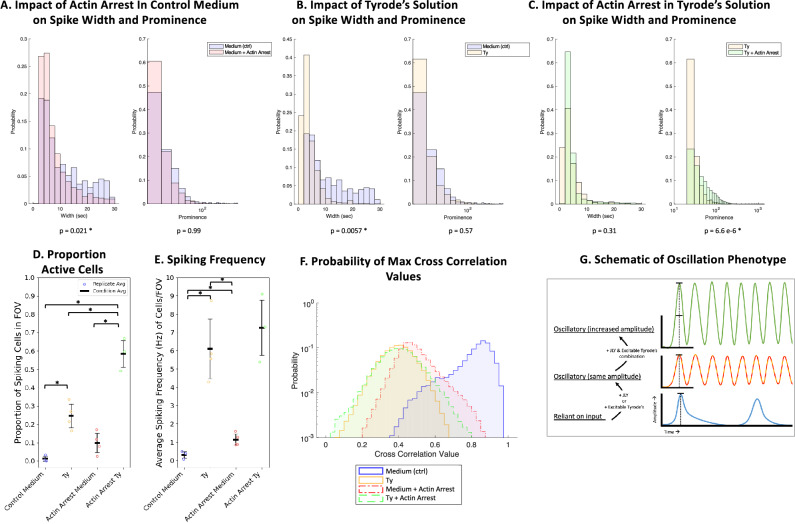
Waves and oscillations are key to information flow and processing in the brain. Recent work shows that, in addition to electrical activity, biomechanical signaling can also be excitable and support self-sustaining oscillations and waves. Here, we measured the biomechanical dynamics of actin polymerization in neural precursor cells (NPC) during their differentiation into populations of neurons and astrocytes. Using fluorescence-based live-cell imaging, we analyzed the dynamics of actin and calcium signals. The size and localization of actin dynamics adjusts to match functional needs throughout differentiation, enabling the initiation and elongation of processes and, ultimately, the formation of synaptic and perisynaptic structures. Throughout differentiation, actin remains dynamic in the soma, with many cells showing notable rhythmic character. Arrest of actin dynamics increases the slower time scale (likely astrocytic) calcium dynamics by 1) decreasing the duration and increasing the frequency of calcium spikes and 2) decreasing the time-delay cross-correlations in the networks. These results are consistent with the transition from an overdamped system to a spontaneously oscillating system and suggest that dynamic actin may dampen calcium signals. We conclude that mechanochemical interventions can impact calcium signaling and, thus, information flow in the brain.


Conflict of interest statement

Competing interests: The authors declare no competing interests.

Figures

Fig. 1
Fig. 1. Model hNPC line workflow and differentiation capability.
Workflow for the proposed work (A), starting with time course of hNPC differentiating towards matured neurons and astrocytes, followed by analysis of calcium and actin dynamics. Cells are considered “naïve differentiated” at 4–10 days post-differentiation initiation and “mature differentiated” at 14–28 days post-differentiation initiation. Representative immunofluorescence image of undifferentiated hNPC (B) with expression of Nestin (green) and Sox2 (red). Immunofluorescence on naïve differentiated (4 days post-differentiation initiation) hNPC (C) with expression of TUBB3 (green) or GFAP (red) with nuclear staining (blue). Box plot representing the percentage of TUBB3 positive cells after 4 days differentiation (n = 8 biologically independent experiments; error bars represent the standard deviation across experiments) (D). Representative confocal fluorescent image of lifeact-GFP stable transduction of a mature differentiated (21 days post-differentiation initiation) cell derived from hNPC (E).
Fig. 2
Fig. 2. hNPC actin dynamics change scale over differentiation: increasing during naïve differentiated states before decreasing in mature differentiated states.
Images represent temporal max projections from 5 min of actin imaging. hNPC in an undifferentiated state (A, zoom in on B). hNPC early differentiation, 5 days post-differentiation initiation (C, zoom in on D). hNPC in mature differentiated cells, 21 days post-differentiation initiation (E, zoom in on F).
Fig. 3
Fig. 3. Optical flow as a tool to study actin dynamics with top 15% optical flow vectors show distinct regions of activity throughout differentiation.
Actin dynamics within hNPC can be captured using optical flow algorithm (A–F). To visualize optical flow’s use, a single analysis time point of two subsequent frames from a 7-minute movie (with 0.06255 Hz acquisition) showing intracellular actin is labeled (A, B). Overlay of two subsequent frames analyzed with time gradient shown (A). Optical flow vectors (green) overlaid on the second of the two subsequent frames from (A, B). Probability distribution of optical flow vectors of detected actin speeds between subsequent frames (C). The magnitude calculated by optical flow algorithm is overlaid on the masked cell region (D). Orientation of optical flow vectors displayed on the overlaid cell region; color shown is indicative of directionality of optical flow vectors detected as displayed by circular map showing directionality in radians (E). Kymograph that captures the probability (as indicated by color) of directional actin flow (as indicated on the y-axis) over time (along the x-axis) (F). Max projection of actin image time-series showing top 15% magnitude flow vectors over all frames from 5-min movies at specific differentiation time points (G–I). Colorscale indicates the proportion of frame pixels that were found to be in the top 15% magnitude throughout the entire film. Examples of undifferentiated cells (G), naive differentiated cells (H), and mature differentiated cells (I). All scale bars represent 50 microns.
Fig. 4
Fig. 4. Actin dynamics are generally oriented along the cell’s major axis and show a rhythmic character throughout differentiation.
Schematic with an arrow showing orientation along a cell’s major axis (A). Analysis from actin imaging captured at 0.25 or 0.125 Hz (n = 17). Representative cell samples under various stages of differentiation: Undifferentiated (B, G), naïve differentiated (C, H), and mature differentiated (D, I) showing either all vectors (top) or using vectors within the of top 15% magnitude (bottom). Rose plots (B–D) show probability of optical flow vector orientation over entire films. Dot plots of mean actin speed at various stages of differentiation using all vectors (E) and using vectors within the top 15% magnitude (F). Conditions marked with asterisk have significantly different means from the others (n = 17 time-lapse movies obtained across N = 3 biologically independent experiments; error bars represent the standard deviation across experiments). Kymographs (G–I) show directional probability over time of all vectors (top) or of the highest 15% magnitude vectors (bottom). Hotter colors indicate a higher probability.
Fig. 5
Fig. 5. hNPC calcium dynamics can readily be quantified at the population level.
Microscope field of view of naïve differentiated (10 days post-differentiation initiation) hNPCs; scale bar representing 50 microns (A). Zoom in from (A), highlighting individual cell #151 in magenta; scale bar representing 50 microns (B). Trace of calcium fluorescent data over time from cell #151 (C). Kymograph representation of trace from C for cell #151; time on the x-axis, fluorescent intensity indicated as color (D). Automated cell centers are displayed as dots and numbered from the entire microscope field of view from (A); scale bar representing 50 microns (E). Kymograph representing all cell fluorescent intensities over time (F).
Fig. 6
Fig. 6. Pharmacological actin arrest in naive differentiated hNPC increases calcium dynamics.
Temporally color-coded max projections from naïve differentiated (4–5 days post-differentiation initiation) hNPCs of LifeactTagGFP2 over 4 min films captured at 0.5 Hz during control or actin arrest; scale bars represent 50 microns (A, B, respectively). Temporally color-coded max projections from Calbryte590 over 1 min films captured at 3 Hz during control or actin arrest; scale bars represent 50 microns (C, D, respectively). Kymographs showing calcium dynamics over 9 min captured at 3 Hz with fluorescent intensity indicated by the color bar on the right-hand side, and individual cells indexed along the y-axis during control or actin-arrested conditions (E, F, respectively [same scale used]).
Fig. 7
Fig. 7. Comparing the effects of excitable Tyrode’s solution and actin arrest on calcium dynamics.
Probability histograms of spike width and prominence of calcium spikes [~15,000 individual spikes, compiled from n = 14 time-lapse movies across N = 3–4 biologically independent experiments] in various conditions (AC). Spike width and prominence of cells in medium with or without actin arrest (JLY) (A). Spike width and prominence of cells in either medium (Ctrl) or Tyrode’s solution (B). Spike width and prominence of cells in Tyrode’s solution with or without actin arrest (C). Conditions marked with asterisk are significantly different from one another (AC). Dot plots showing the proportion of active cells (D) or spiking frequency (E) under tested conditions—control condition in medium, control condition in excitable Tyrode’s solution, actin arrest in medium, and actin arrest in excitable Tyrode’s solution (n = 1 4 time-lapse movies each with at least 50 cells per field of view, across N = 3–4 biologically independent experiments; error bars represent the standard deviation across experiments). Histograms showing the relative probability of max cross correlation values from all cells pairs under the same conditions as in (A and B) on a logarithmic y-axis (F). Schematic representation of calcium fluctuations in the context of conditions applied within this work (G). Conditions marked with asterisk are significantly different from one another.

Similar articles

References

    1. Sofroniew, M. V. & Vinters, H. V. Astrocytes: biology and pathology. Acta Neuropathol.119, 7–35 (2010). - PMC - PubMed
    1. Parpura, V. & Verkhratsky, A. The astrocyte excitability brief: from receptors to gliotransmission. Neurochem. Int.61, 610–621 (2012). - PubMed
    1. Wahis, J. & Holt, M. G. Astrocytes, noradrenaline, α1-adrenoreceptors, and neuromodulation: evidence and unanswered questions. Front. Cell. Neurosci.15, 645691 (2021). - PMC - PubMed
    1. Mederos, S., González-Arias, C. & Perea, G. Astrocyte–Neuron networks: a multilane highway of signaling for homeostatic brain function. Front. Synaptic Neurosci.10, 45 (2018). - PMC - PubMed
    1. Gage, F. H. & Temple, S. Neural stem cells: generating and regenerating the brain. Neuron80, 588–601 (2013). - PubMed

LinkOut - more resources