. 2025 Jul;7(7):1392-1403.
doi: 10.1038/s42255-025-01321-x. Epub 2025 Jul 1.

Triglycerides are an important fuel reserve for synapse function in the brain

Affiliations

Triglycerides are an important fuel reserve for synapse function in the brain

Mukesh Kumar et al. Nat Metab. 2025 Jul.

Abstract

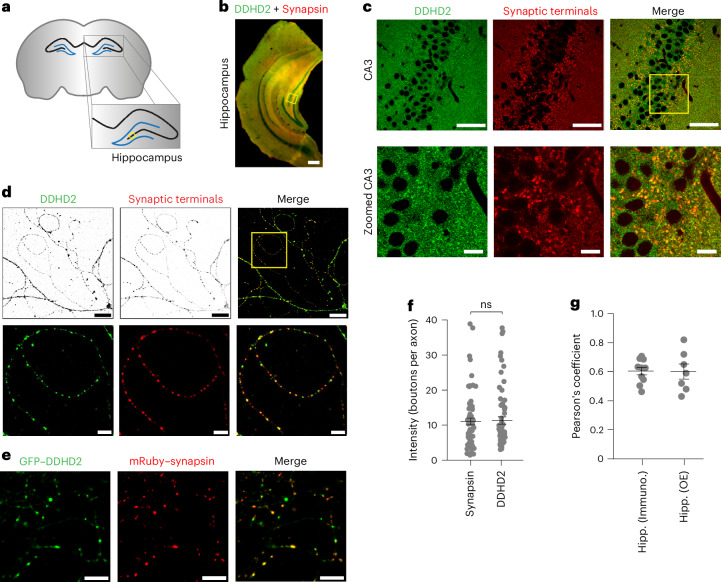
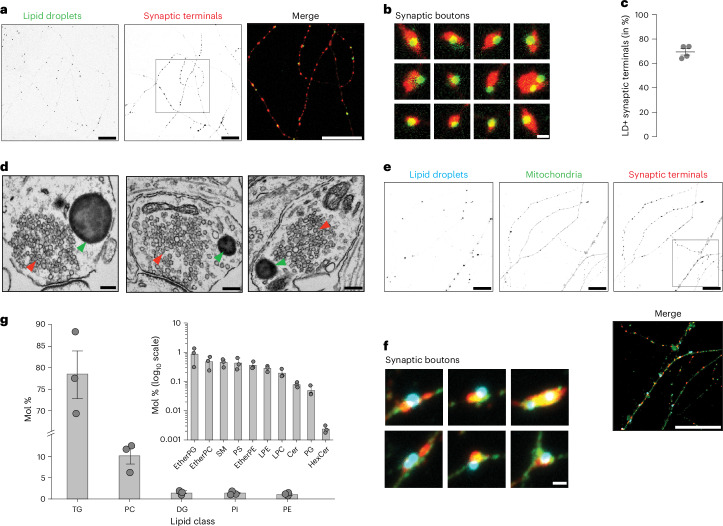
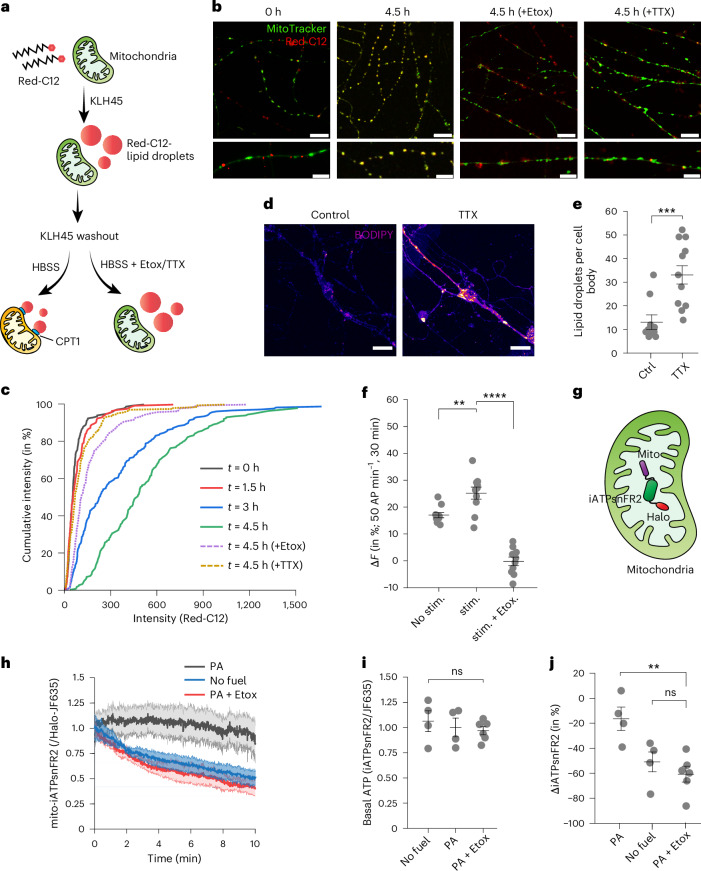
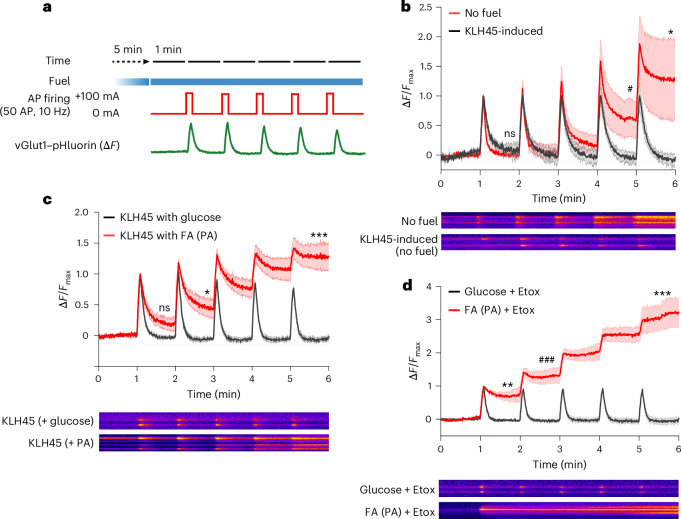
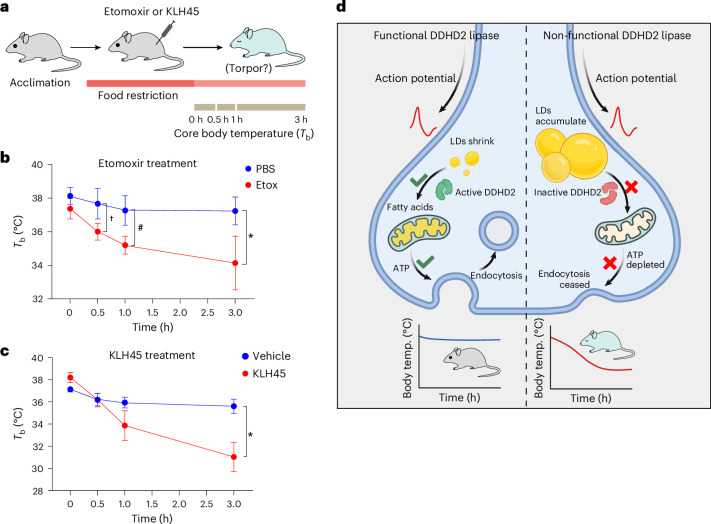
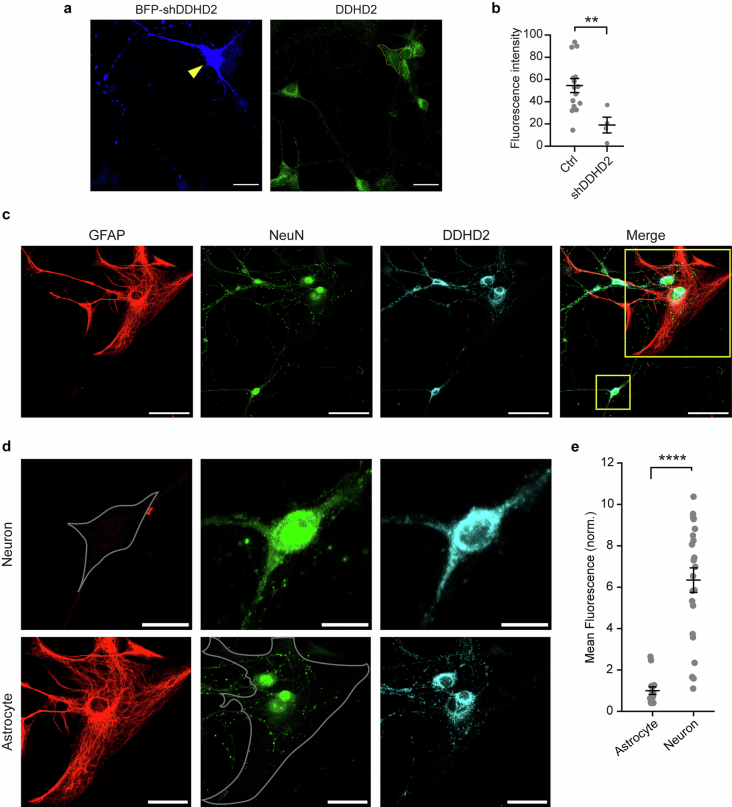
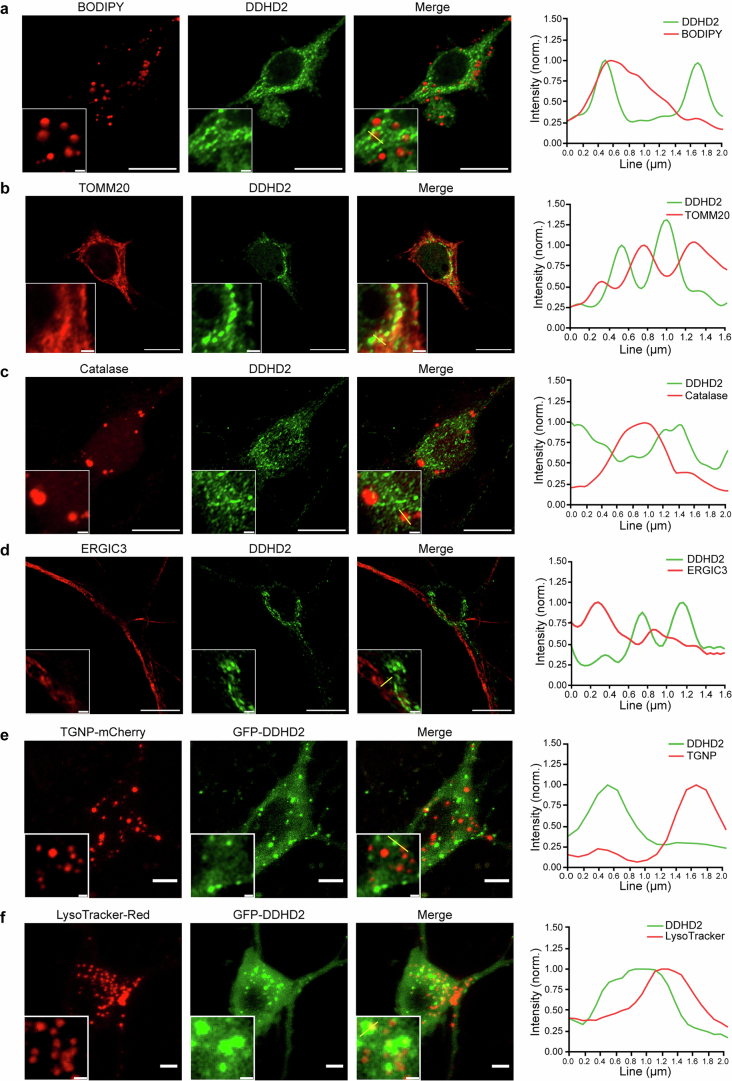
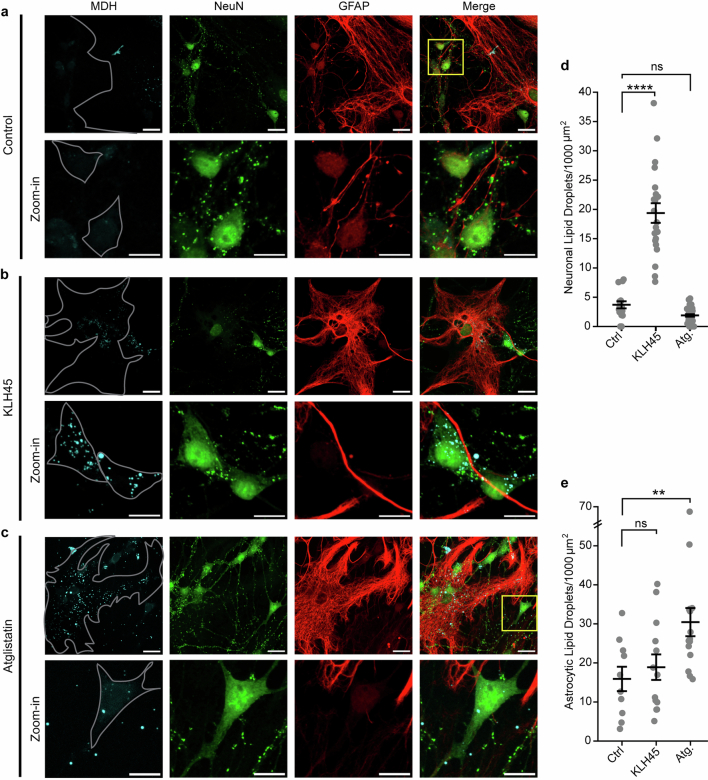
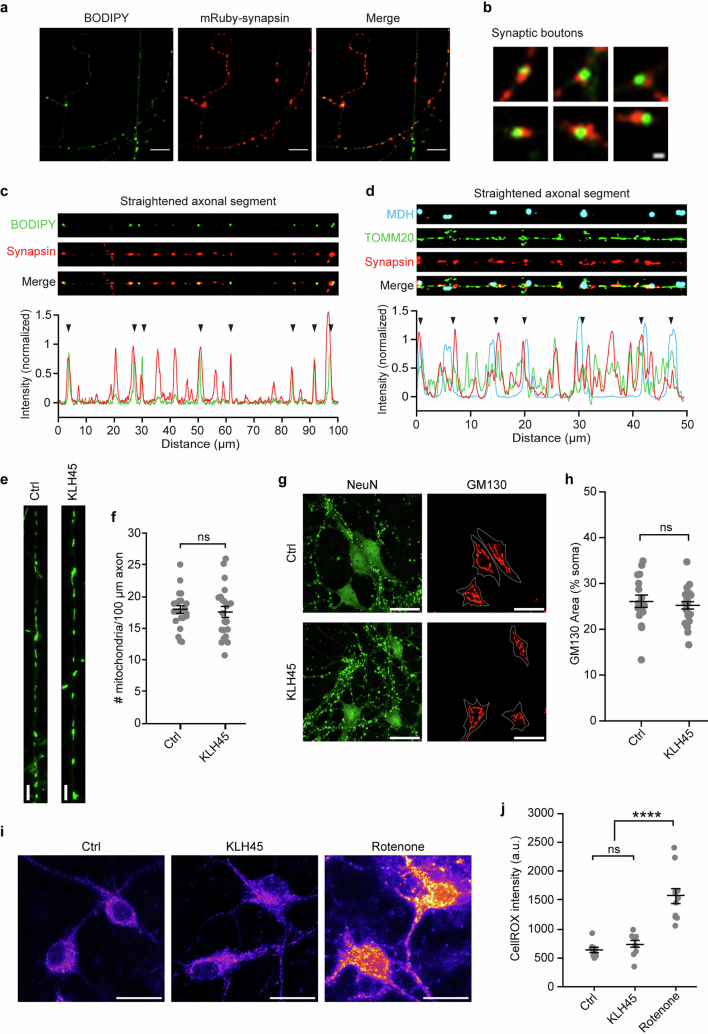
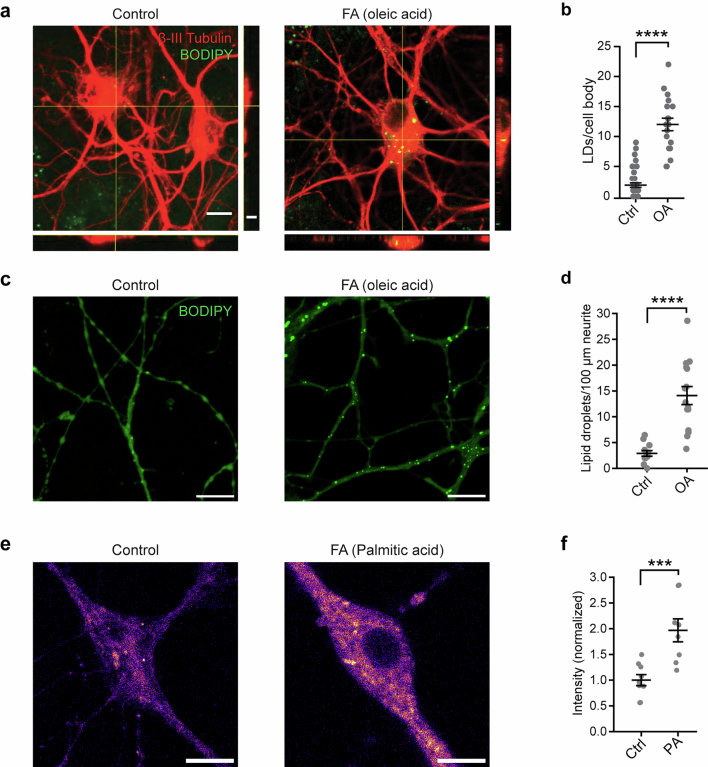
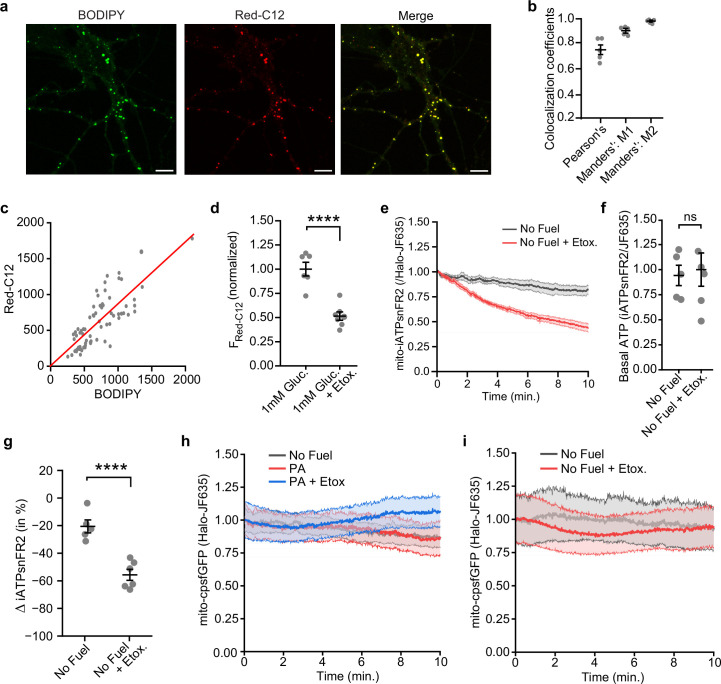
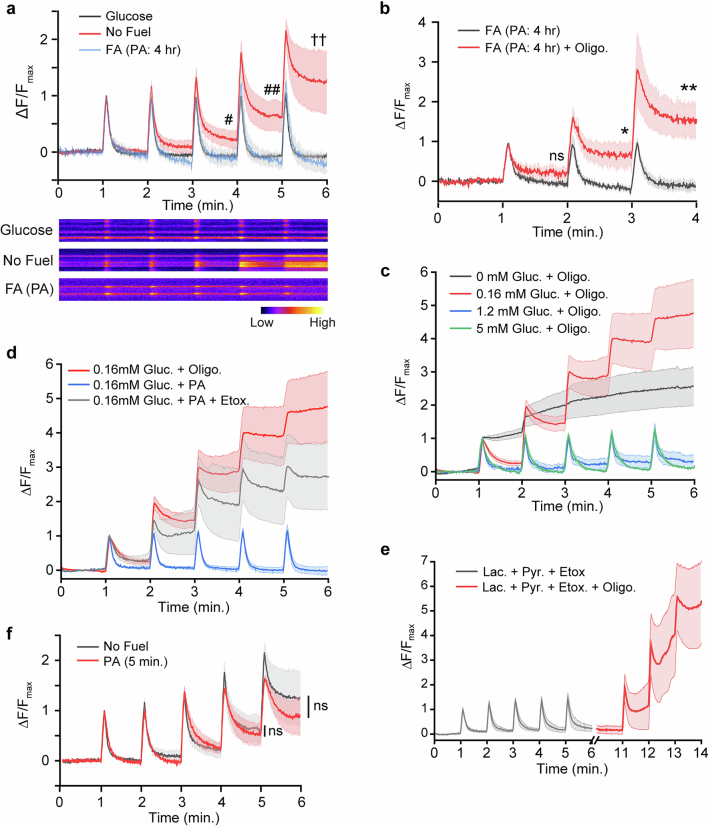
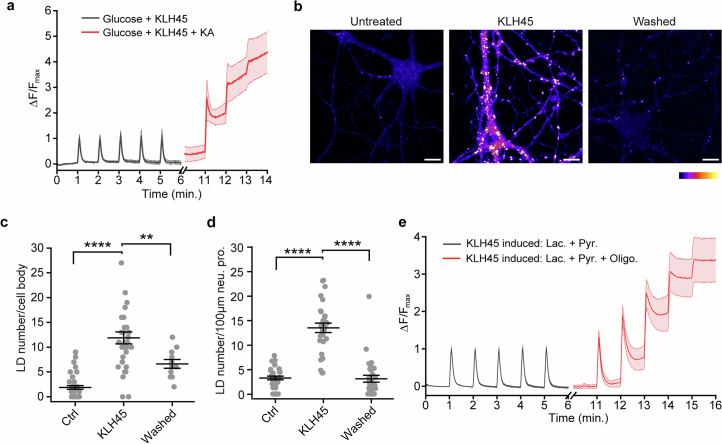
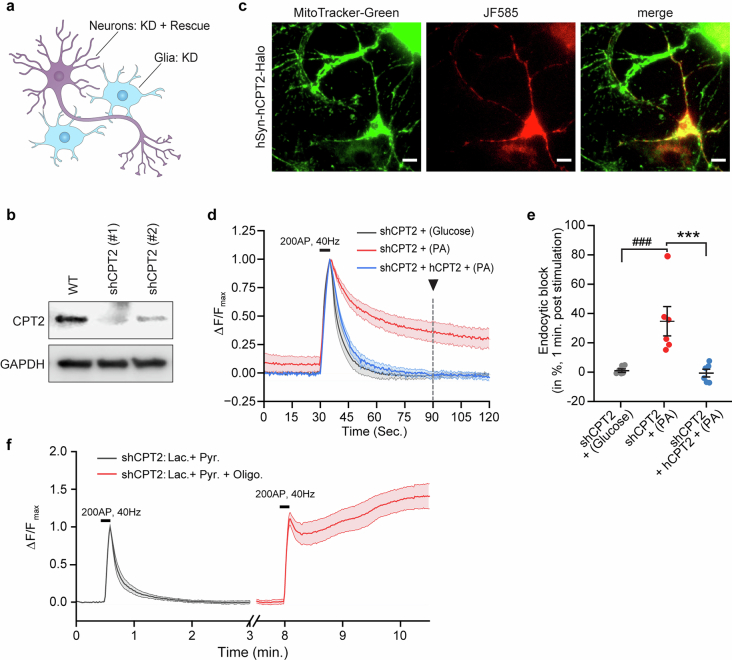
Proper fuelling of the brain is critical to sustain cognitive function, but the role of fatty acid (FA) combustion in this process has been elusive. Here we show that acute block of a neuron-specific triglyceride lipase, DDHD2 (a genetic driver of complex hereditary spastic paraplegia), or of the mitochondrial lipid transporter CPT1 leads to rapid onset of torpor in adult male mice. These data indicate that in vivo neurons are probably constantly fluxing FAs derived from lipid droplets (LDs) through β-oxidation to support neuronal bioenergetics. We show that in dissociated neurons, electrical silencing or blocking of DDHD2 leads to accumulation of neuronal LDs, including at nerve terminals, and that FAs derived from axonal LDs enter mitochondria in an activity-dependent fashion to drive local mitochondrial ATP production. These data demonstrate that nerve terminals can make use of LDs during electrical activity to provide metabolic support and probably have a critical role in supporting neuron function in vivo.


Conflict of interest statement

Competing interests: The authors declare no competing interests.

Figures

Fig. 1
Fig. 1. DDHD2 lipase localizes to synaptic terminals in the hippocampus.
a, Schematic of a coronal section of rodent brain highlighting the hippocampus. The CA3 region is marked with a yellow box in the hippocampus. b, Laser scanned confocal micrograph of a brain hemisphere section near the mid-brain region, spanning the hippocampus, derived from a 28-day-old juvenile mouse brain, immunolabelled with DDHD2 and synapsin (synaptic terminal) antibodies. Scale bar, 400 µm. c, Confocal micrograph of the CA3 region (yellow box in b) of the hippocampus derived from a 28-day-old juvenile mouse brain, immunolabelled with synapsin (synaptic terminal) and DDHD2 antibodies. Scale bar, 50 µm. The lower panel shows the zoomed-in region (yellow box in upper right panel) of CA3. Scale bar, 10 µm. d, Confocal micrographs of dissociated hippocampal neurons immunolabelled with DDHD2 and synapsin antibodies. Scale bar, 20 µm. The lower panel shows the zoomed-in region (yellow box in upper right panel). Scale bar, 5 µm. e, Confocal micrographs of dissociated hippocampal neurons expressing GFP–DDHD2 and mRuby–synapsin. Scale bar, 10 μm. f, Quantification of relative DDHD2 and synapsin enrichment at synaptic terminals compared to adjacent axonal processes of hippocampal neurons in d. Data are presented as means; error bars, s.e.m. P value (ns, P = 0.501) was determined using an unpaired sample two-tailed t-test with n = 69 for DDHD2 and n = 64 for synapsin. g, Colocalization analysis of immunolabelled DDHD2 and synapsin (65 µm × 65 µm, n = 10), and GFP–DDHD2 and mRuby–synapsin (135 µm × 135 µm, n = 7) in hippocampal neurons, represented by Pearson’s correlation coefficient. Data are presented as means; error bars, s.e.m. Hipp., hippocampus; Immuno., immunostaining (of DDHD2 and synapsin); OE, overexpression (of GFP–DDHD2 and mRuby–synapsin). Source data
Fig. 2
Fig. 2. Inhibition of DDHD2 leads to LD accumulation at synaptic terminals.
a, Confocal micrographs of KLH45-treated hippocampal neurons immunolabelled with synapsin (red, synaptic terminal) antibody and stained with BODIPY (green, LD marker). The boxed region is shown as a zoomed-in merged image. Scale bar, 20 µm. b, Zoomed-in images of 12 individual synaptic boutons from a showing LD localization. Scale bar, 1 µm. c, Quantification of synaptic terminals positive for BODIPY-stained LDs. Data are presented as means for regions of interest quantified from n = 4 independent experiments; error bars, s.e.m. d, Electron micrographs of KLH45-treated hippocampal neurons (18 days in vitro). LDs and SVs are indicated by green and red arrowheads, respectively. Scale bar, 200 nm. e, Confocal micrographs of KLH45-treated hippocampal neurons immunolabelled with TOMM20 (green, mitochondria) and synapsin (red, synaptic terminals) antibodies, and stained with monodansylpentane (MDH, AUTODOT) (cyan, LD marker). The boxed region is shown as a zoomed-in merged image in the lower panel. Scale bar, 20 µm. f, Zoomed-in images of six synaptic boutons from e showing localization of LDs and mitochondria at synaptic terminals. Scale bar, 1 µm. g, Lipid composition of purified LDs from cortical neurons, quantified (in mole %) using liquid chromatography–mass spectrometry. Minor lipids are displayed on a logarithmic scale in the inset. Standard lipid abbreviations are used. Data from three independent experiments are presented as means; error bars, s.e.m. PI, phosphatidylinositol; PE, phosphatidylethanolamine; PG, phosphatidylglycerol; SM, sphingomyelin; PS, phosphatidylserine; LPE, lysophosphatidylethanolamine; LPC, lysophosphatidylcholine; Cer, ceramide; HexCer, hexosylceramide. Source data
Fig. 3
Fig. 3. Synaptic activity and CPT1 facilitate FA transfer to the mitochondrial matrix to sustain ATP levels in neurons.
a, Schematic representation depicting the accumulation of Red-C12 (BODIPY 558/568 C12 FA) in LDs following KLH45 treatment, and subsequent washout with or without etomoxir (Etox). CPT1 and CPT2 (CPT2 not shown) on mitochondrial membranes facilitate the transfer of Red-C12 to the mitochondrial matrix in HBSS media. b, Confocal micrographs showing transfer of Red-C12 to mitochondria within 4.5 h in the absence of external glucose. The presence of etomoxir or TTX in HBSS media inhibits Red-C12 transfer to mitochondria. Scale bars, 10 µm (upper panels) and 5 µm (lower panels). c, Cumulative per cent transfer of Red-C12 to mitochondria at 0 h, 1.5 h, 3 h and 4.5 h after HBSS media change. Dotted lines indicate reduced Red-C12 transfer when etomoxir or TTX was present in HBSS. d, Confocal micrographs of control and TTX-treated (72 h) hippocampal neurons stained with BODIPY. Scale bar, 20 µm. e, Quantification of LD number in the soma of control and TTX-treated neurons. Data are presented as means; error bars, s.e.m. P value (***P = 0.001) was determined using an unpaired samples two-tailed t-test with n = 10 for Ctrl and n = 12 for TTX. f, Quantification of Red-C12 colocalization with MitoTracker Green in neurons subjected to electrical stimulation (50 AP min−1 for 30 min) compared with unstimulated controls. AP, action potential; stim., stimulated; Etox., etomoxir. Etomoxir-treated neurons show reduced Red-C12 colocalization. Data are presented as means; error bars, s.e.m. P values (**P = 0.0053; ****P ≤ 0.0001) were determined using one-way ANOVA with Tukey’s multiple comparison test for n = 10 in each condition. g, Schematic representation of the mitochondrial ATP sensor (iATPsnFR2) with a C-terminal Halo tag, targeted to the mitochondrial matrix by four repeats of the amino-terminal leader sequence, mito/COX8. h, Relative ATP levels (normalized with JF635 for expression) in mito-iATPsnFR2-Halo-expressing hippocampal neurons under different metabolic conditions: no external fuel, palmitic acid (PA) supplementation or CPT1 inhibition (by etomoxir) to PA-induced neurons. i, Basal intensity of iATPsnFR2 under conditions described in h. j, Relative change (%) in ATP levels after 10 min of perfusion with the media described in h. Data in hj are presented as means; error bars, s.e.m. P values (ns, P > 0.05; **P = 0.006) in i and j were determined using one-way ANOVA with Tukey’s multiple comparison test. Sample sizes in hj were n = 4 for no fuel and PA conditions, and n = 6 for PA + Etox conditions. Source data
Fig. 4
Fig. 4. LD-induced neurons exhibit improved synaptic endurance.
a, Schematic representation of the experimental paradigm (adapted from a previous publication): dissociated hippocampal neurons expressing vGlut1–pHluorin were perfused with indicated media for 5 min (unless otherwise specified), followed by AP firing (+100 mA, 50 AP, 10 Hz) at 1 min intervals. The fluorescence intensity shift of pHluorin (∆F) at the synaptic boutons (regions of interest, 12–18 µm²), reflecting exocytosis and endocytosis of SVs, was recorded and normalized to the peak response of the first AP firing. b, Fluorescence intensity traces at synaptic boutons following periodic AP firing in the absence of any external fuel (labelled as ‘No fuel’) versus TG-loaded hippocampal neurons after KLH45 washout (labelled as ‘KLH45-induced’). Unlike the no-fuel condition, TG-loaded neurons sustain five rounds of SV recycling even in the absence of external fuel. Sample sizes were n = 4 for no fuel and n = 8 for KLH45-induced conditions. P values (ns, P = 0.974; #P = 0.012; *P = 0.014) were determined using an unpaired samples two-tailed t-test. c, Fluorescence intensity traces at synaptic boutons following periodic AP firing in glucose or PA-fed hippocampal neurons in the presence of KLH45. Sample sizes were n = 6 for KLH45 with glucose and n = 7 for KLH45 with FA (PA) conditions. P values (ns, P = 0.098; *P = 0.0127; ***P = 0.0002) were determined using an unpaired samples two-tailed t-test. d, Fluorescence intensity traces at synaptic boutons following periodic AP firing in glucose or PA-fed hippocampal neurons in the presence of etomoxir. Sample sizes were n = 5 for both glucose + Etox and FA (PA) + Etox conditions. P values (**P = 0.007; ###P = 0.0007; ***P = 0.0001) were determined using an unpaired samples two-tailed t-test. Data in bd are presented as means; error bars, s.e.m. Representative kymographs depicting vGlut1–pHluorin fluorescence intensity changes at the synaptic boutons are shown below their respective traces. Asterisk (*) and hash (#) symbols are used to distinguish between different groups of statistically significant comparison. Source data
Fig. 5
Fig. 5. Inhibition of lipolysis in the brain induces torpor.
a, Schematic representation of the experimental paradigm illustrating induction of torpor following intraperitoneal injection of etomoxir or KLH45. Environmentally acclimated (≥3 days) and individually housed mice were placed on food restriction for 3 h. The mice were injected with etomoxir or KLH45 and returned to their cages without food. Core body temperature (Tb) was measured at regular intervals up to 3 h. b, Tb at 0, 0.5, 1 and 3 h after etomoxir injection. Mice injected with vehicle for etomoxir (PBS) were used as controls. Data are presented as means; error bars, s.e.m. P values (P = 0.027; #P = 0.0129; *P = 0.0216) were determined using an unpaired samples two-tailed t-test for n = 3 in both control (PBS) and etomoxir conditions. c, Tb at 0, 0.5, 1 and 3 h after KLH45 injection. Mice injected with vehicle for KLH45 (18:1:1 saline/ethanol/polyethylene glycol monooleyl ether) were used as controls. Data are presented as means; error bars, s.e.m. P value (*P = 0.0187) was determined using an unpaired samples two-tailed t-test for n = 3 in both control (vehicle) and KLH45 conditions. Mice injected with etomoxir or KLH45 (red) exhibited a significant drop in their core body temperature compared to controls (blue). d, Schematic summary of the mechanism of DDHD2-dependent FA fuelling of synaptic function to prevent a torpor-like state. Asterisk (*), hash (#) and dagger (†) symbols are used to distinguish between different groups of statistically significant comparison. Created in BioRender.com. Source data
Extended Data Fig. 1
Extended Data Fig. 1. Validation of DDHD2 antibody specificity and localization in cell type.
a, Confocal micrographs of BFP-shDDHD2 expressing hippocampal neurons immunolabelled with DDHD2 antibody. The representative shRNA expressing neuron (yellow arrowhead) shows reduced intensity of DDHD2 compared to non-expressing neurons in the same field of view. Scale bar: 20 μm. b, Quantification of DDHD2 fluorescence intensity in the soma of control (shRNA non-expressing) and transfected (DDHD2-specific shRNA expressing) neurons. Data are presented as mean ± SE. p-value (**p = 0.0092) was determined using unpaired samples two-tailed t-test with n = 14 for Ctrl and n = 4 for shDDHD2. c, Confocal micrographs of astrocytes (red, GFAP) and hippocampal neurons (green, NeuN) immunolabeled with DDHD2 (cyan) antibody. Scale bar: 50 μm. d, Zoomed-in regions of neuron and astrocyte marked with yellow boxes in (c). Scale bars, neuron: 10 μm, astrocyte: 30 μm. e, Quantification of fluorescence intensities of DDHD2 in neurons compared to astrocytes. Data are presented as mean ± SE. p-value (****p < 0.0001) was determined using unpaired samples two-tailed t-test with n = 15 for astrocytes and n = 23 for neurons. Source data
Extended Data Fig. 2
Extended Data Fig. 2. Subcellular localization of DDHD2.
a, Confocal micrographs of hippocampal neurons treated with KLH45, immunostained for DDHD2, and stained with BODIPY to visualize lipid droplets. b-d, Confocal micrographs of hippocampal neurons co-immunostained for DDHD2 and organelle-specific markers: TOMM20 (mitochondria), catalase (peroxisomes), and ERGIC3 (ER-Glogi intermediate compartment). Scale bars: 10 μm; Zoomed-in panels: 1 μm. e, Confocal micrographs of hippocampal neurons expressing GFP-DDHD2 and TGNP-mCherry, showing their subcellular distribution. f, Confocal micrographs of hippocampal neurons expressing GFP-DDHD2 and stained with LysoTracker-Red to visualize lysosomes. Scale bars: 5 μm; Zoomed-in panels: 1 μm. Line-profile intensity graphs shown on the right correspond to the yellow lines drawn in the zoomed-in panels. Source data
Extended Data Fig. 3
Extended Data Fig. 3. Effect of DDHD2 and ATGL lipase inhibition on lipid accumulation in neurons and astrocytes.
a, Confocal micrographs of control neurons (green, NeuN) and astrocytes (red, GFAP) stained with MDH/AUTODOT (cyan, lipid droplets). Scale bar: 20 μm. b, Confocal micrographs of KLH45 (DDHD2 inhibitor)-treated neurons (NeuN) and astrocytes (GFAP) stained with MDH (lipid droplets). Scale bar: 20 μm. c, Confocal micrographs of atglistatin (ATGL inhibitor)-treated neurons (NeuN) and astrocytes (GFAP) stained with MDH (lipid droplets). Scale bar: 20 μm. Lower panels (in a-c) show zoomed-in views of the upper panels (marked with yellow boxes). Scale bars: 10 μm. d, Quantification of LD numbers in hippocampal neurons following KLH45 and atglistatin treatment. Data are presented as mean ± SE. p-values (ns, p = 0.33; ****p < 0.0001) were determined using one-way ANOVA followed by Tukey’s multiple comparison test with n = 16 for Ctrl, n = 21 for KLH45 and n = 39 for atglistatin. e, Quantification of LD numbers in astrocytes following KLH45 and atglistatin treatment. Data are presented as mean ± SE. p-values (ns, p = 0.83; **p = 0.01) were determined using one-way ANOVA followed by Tukey’s multiple comparison test with n = 10 for Ctrl, n = 13 for KLH45, and n = 15 for atglistatin. Source data
Extended Data Fig. 4
Extended Data Fig. 4. KLH45-induced LDs co-localize with mitochondria in axons without affecting mitochondrial or Golgi abundance.
a, Confocal micrographs of KLH45-treated hippocampal neurons expressing mRuby-synapsin and stained with BODIPY to label LDs. Scale bar: 10 μm. b, Zoomed-in synaptic boutons from (a). Scale bar: 1 μm. c, Confocal micrographs of a straightened 100 µm long segment of hippocampal axon (from Fig. 2a) immunolabeled with anti-synapsin antibody and stained with BODIPY. Merged image and corresponding line intensity profile show repeated overlapping peaks (black arrowheads) of BODIPY (green, LDs) and synapsin (red, synaptic boutons). d, Confocal micrographs of a straightened 50 µm long segment of hippocampal axon (from Fig. 2e) stained with MDH (cyan, LDs) and immunolabeled with anti-TOMM20 (green, mitochondria) and anti-synapsin (red, synaptic boutons) antibodies. Merged image and corresponding line intensity profile show repeated MDH-positive puncta, adjacent to TOMM20 and synapsin peaks (black arrowheads). e, Confocal micrographs of straightened axonal segments from control and KLH45-treated neurons stained with MitoTracker Green. Scale Bar: 5 μm. f, Quantification of mitochondria per 100 μm axonal segment. Data are presented as mean ± SE. p-value (ns, p = 0.68) was determined using unpaired samples two-tailed t-test with n = 24 for Ctrl and n = 23 for KLH45 treated conditions. g, Confocal micrographs of untreated control and KLH45-treated hippocampal neurons immunostained with NeuN (green, neuron) and GM130 (red, cis-Golgi) antibodies. Scale bar: 20 µm. h, Quantification of cis-Golgi network area as a percentage of total neuronal area. Data are presented as mean ± SE. p-value (ns, p = 0.53) was determined using unpaired samples two-tailed t-test with n = 18 for Ctrl and n = 23 for KLH45 treated conditions. i, Confocal micrographs of untreated control, KLH45-treated, and Rotenone-treated hippocampal neurons stained with CellROX to assess ROS level. Rotenon, a mitochondrial complex-I inhibitor that induces ROS production, increases CellROX intensity. Scale bar: 20 μm. j, Quantification of CellROX fluorescence intensity in the soma. Data are presented as mean ± SE. p-values (ns, p = 0.73, ****p < 0.0001) were determined using one-way ANOVA followed by Tukey’s multiple comparison test with n = 10 for Ctrl and KLH45, and n = 11 for Rotenone treated conditions. Source data
Extended Data Fig. 5
Extended Data Fig. 5. Purification and lipid profiling of KLH45-induced neuronal LDs.
a, Schematic illustration of the experimental workflow used to induce LD formation in cortical neurons and isolate them via density-based floatation using sucrose step-gradient. Floating LDs were collected from the top layer of sucrose-free MEPS buffer [see detailed method in Kumar et. al. 2023]. Bottom layer contained relatively denser bi-layered membranous organelles with aqueous cores. b, Confocal micrographs of purified LDs (top layer) and membranous organelles (bottom layer) stained with BODIPY (green, neutral lipid dye) and CellMask (red, amphipathic membrane dye). Absence of CellMask-positive, and BODIPY-negative structures in top-fraction confirms the purity of isolated LDs. Additionally, lack of detectable BODIPY-positive structures in the bottom fraction confirms minimal loss of LDs during floatation process. Scale bar: 10 µm. c, Zoomed-in confocal micrographs and intensity profile (along yellow line) of BODIPY- and CellMask-stained LDs show a core of neutral lipids enclosed by a phospholipid layer. Scale bar: 1 µm. d, Quantification of LD diameters based on confocal micrographs of BODIPY-stained LDs. Data are presented as mean ± SD. LD diameter was estimated to be ~1.2 µm based on measurements from n = 761 droplets. e, Relative abundance (mole %) of lipid species in purified LDs compared to whole neuron lipid composition after KLH45-induction. Mean values for each lipid class were calculated from three independent experiments. f, Comparative abundance (in % of total TGs) of triglyceride species categorized by fatty acid chain length and degree of saturation. Data are presented as mean ± SE from three independent experiments. Source data
Extended Data Fig. 6
Extended Data Fig. 6. Albumin-complexed fatty acids induce lipid droplet formation in neurons.
a, Confocal micrographs of soma from control and oleic acid (OA, complexed with bovine serum albumin)-treated hippocampal neurons. Neurons were immunostained with anti-β-III tubulin antibody (red, neuron) and stained with BODIPY (green, LD). Scale bar: 10 µm. Orthogonal sections along the yellow lines are shown to indicate globular LDs in neuronal cytosol. Scale bar: 5 µm. b, Quantification of LDs in the soma of control and OA-fed hippocampal neurons. Data are presented as mean ± SE. p-value (****p < 0.0001) was determined using unpaired samples two-tailed t-test with n = 21 for Ctrl and n = 19 for OA treated conditions. c, Confocal micrographs of axonal processes of control and OA-treated hippocampal neurons, stained with BODIPY and imaged live to visualize lipid droplets. Scale bar: 10 µm. d, Quantification of LDs along axonal processes in control and OA-treated neurons. Data are presented as mean ± SE. p-value (****p < 0.0001) was determined using unpaired samples two-tailed t-test with n = 12 for Ctrl and n = 15 for OA treated conditions. e, Confocal micrographs of BODIPY-stained soma of control and palmitic acid (PA, complexed with bovine serum albumin)-treated hippocampal neurons. Scale bar: 10 µm. f, Quantification of fluorescent intensities in the soma of control and PA-treated neurons. Data are presented as mean ± SE. p-value (***p = 0.0006) was determined using unpaired samples two-tailed t-test with n = 9 for Ctrl and n = 8 for PA treated conditions. Source data
Extended Data Fig. 7
Extended Data Fig. 7. Lipid droplet-derived fatty acids sustain mitochondrial ATP levels in neurons.
a, Confocal micrographs showing colocalization of BODIPY493/503 labeled globular structures (LDs) with Red-C12, confirming the storage of exogenous fatty acids within LD core. Scale bar: 10 µm. b, Quantification of Pearson’s colocalization coefficient from confocal images in (a). Data are presented as mean ± SE for N = 5. M1: fraction of Red-C12 overlapping with BODIPY, M2: fraction of BODIPY overlapping with Red-C12. c, Correlation between fluorescence intensities of BODIPY 493/503 and Red-C12 measured across 70 LDs (Pearson’s r: 0.79, R2: 0.9). d, Comparison of Red-C12 colocalization with MitoTracker Green in neurons cultured in feeding media containing 1 mM glucose or 1 mM glucose with etomoxir. Data are presented as mean ± SE. p-value (****p < 0.0001) was determined using unpaired samples two-tailed t-test with N = 6 for Glucose and N = 7 for Glucose + Etomoxir conditions. e, ATP levels (normalized to JF635) in mito-iATPsnFR2-Halo expressing hippocampal neurons after induction with KLH45 followed by fuel-deprivation compared to CPT1 inhibited (by etomoxir) conditions. f, Basal intensity of iATPsnFR2 prior to media perfusion as indicated in (e). g, Relative change in ATP levels after 10 minutes of perfusion with the media described in (e). Data in (e-g) are presented as mean ± SE. p-values (ns, p = 0.76; ****p = 0.0001) were determined using unpaired samples two-tailed t-test with N = 5 for No Fuel and N = 6 for No Fuel + Etomoxir conditions. h-i, Fluorescence intensity of cpsfGFP (normalized to JF635) in mito-cpsfGFP-Halo expressing hippocampal neurons under conditions described in Fig. 3h and Extended Data Fig. 7e. Data are presented as mean ± SE. Samples sizes were N = 5 for No Fuel (h), N = 6 for PA, N = 6 for PA + Etomoxir, N = 4 for No Fuel (i), and N = 4 for No Fuel + Etomoxir treated conditions. Source data
Extended Data Fig. 8
Extended Data Fig. 8. Palmitic acid (PA) supports synaptic vesicle recycling in hypometabolic condition.
a, Fluorescence intensity traces (normalized to first peak) of vGlut1-pHluorin at synaptic boutons of dissociated hippocampal neurons following periodic action potential firing (as in Fig. 4a) under three conditions: absence of external fuel (N = 9), presence of 5 mM glucose (N = 5), or pre-fed and maintained with PA (N = 5). Lower panels show representative kymographs of synaptic boutons under these conditions. b, Fluorescence intensity traces of vGlut-pHluorin at synaptic boutons in PA pre-fed or following oligomycin treatment in PA-fed hippocampal neurons. Sample sizes were N = 5 for both PA and PA + Oligo. treated conditions. c, Fluorescence intensity traces of vGlut1-pHluorin at synaptic boutons of dissociated hippocampal neurons maintained with 0, 0.16, 1.2, and 5 mM glucose, in presence of 2 µM oligomycin. Sample sizes were N = 6 for 0 mM Glucose + Oligo, N = 5 for 0.16 mM Glucose + Oligo, N = 4 for 1.2 mM Glucose + Oligo and N = 5 for 5 mM Glucose + Oligo conditions. d, Fluorescence intensity traces of vGlut1-pHluorin at synaptic boutons of hippocampal neurons maintained with following media: subphysiological 0.16 mM glucose + oligomycin (N = 5), pre-fed and maintained with PA + 0.16 mM glucose (N = 6), or pre-fed and maintained with PA + 0.16 mM glucose + etomoxir (N = 6). e, Synaptic vGlut1-pHluorin traces in lactate and pyruvate in presence of etomoxir, or lactate and pyruvate with etomoxir and oligomycin. Sample size for each condition was N = 5. f, Fluorescence intensity traces of vGlut-pHluorin at synaptic boutons after periodic AP firing in acutely PA-fed neurons (5 min.) compared to no fuel conditions. Sample size for each condition was N = 5. Data (in a-f) are presented as mean ± SE. p-values (ns, #p = 0.063; ##p = 0.01; ††p = 0.01; ns, p = 0.25; *p = 0.04; **p = 0.01) were determined using unpaired samples two-tailed t-test. Source data
Extended Data Fig. 9
Extended Data Fig. 9. Restoration of DDHD2 activity reverses LD abundance and mitochondrial function.
a, Normalized fluorescence intensity traces of vGlut1-pHluorin at synaptic boutons (as in Fig. 4a) of KLH45-treated (24 hrs.) hippocampal neurons in presence of 5 mM glucose and KLH45, followed by glucose, KLH45 and 10 µM koningic acid (KA, GAPDH inhibitor). Data are presented as mean ± SE for N = 5. b, Representative fluorescence images of BODIPY-stained hippocampal neurons showing untreated control, KLH45-treated, and 48-hour post-washout neurons. Scale bar: 10 µm. c-d, Quantification of LDs in the soma (c) and processes (d) from conditions shown in (b). Data are presented as mean ± SE. p-values (**p = 0.006, ****p < 0.0001) were determined using one-way ANOVA with Tukey’s multiple comparison test. Sample sizes in (c) were n = 40 for Ctrl, n = 33 for KLH45 and n = 11 for washed conditions. In (d), sample sizes were n = 29 for both Ctrl and KLH45, and n = 31 for washed condition. e, Normalized fluorescence intensity traces of vGlut1-pHluorin at synaptic terminals of KLH45-treated neurons (24 hrs.), maintained with 1.25 mM each of lactate and pyruvate, or lactate and pyruvate with oligomycin. The data are presented as mean ± SE for N = 5. Source data
Extended Data Fig. 10
Extended Data Fig. 10. CPT2 facilitates fueling of synaptic vesicle recycling independent of astrocytic contributions.
a, Schematic illustration of lenti-virus mediated knockdown (KD) of CPT2 in both glial cells and hippocampal neurons, with neuron-specific rescue achieved via overexpression of shRNA-resistant CPT2 under the control of human synapsin promotor. b, Western blot validation of CPT2 knockdown using two potential shRNAs. shCPT2 (#2) is used in subsequent experiments. Blot of GAPDH ensures equal loading of total proteins. c, Fluorescence micrographs showing colocalization of Halo-tagged human CPT2 (labeled with JF585, red) with MitoTracker (mitochondria, green) in hippocampal neurons, confirming mitochondrial targeting of CPT2-Halo. Scale bar: 20 µm. d, Normalized fluorescence intensity traces of vGlut1-pHluorin after 200AP firing to CPT2 depleted hippocampal neurons show reduced endocytosis in PA-fed compared to glucose-fed condition. Expression of shRNA resistant human CPT2 in neurons restored endocytosis. Data are presented as mean ± SE with N = 8 for shCPT2 + Glucose, N = 6 for shCPT2 + PA and N = 6 for shCPT2 + hCPT2 + PA. e, Quantification of endocytic block (in %) measured 60 seconds after AP firing, indicated by black arrowhead in (d). Data are presented as mean ± SE. p-values (###p = 0.0006, ***p = 0.0007) were determined using one-way ANOVA with Tukey’s multiple comparison test for the sample sizes as in (d). f, Normalized fluorescence intensity of vGlut1-pHluorin measured in CPT2-depleted hippocampal neurons electrically stimulated (as in d) in presence of 1.25 mM each lactate and pyruvate. CPT2 depletion did not impair lactate and pyruvate fueled endocytosis, whereas ATP synthase inhibition by oligomycin blocked post-stimulation endocytosis. Data are presented as mean ± SE with N = 7 for both conditions. Source data

Similar articles

References

    1. Novarino, G. et al. Exome sequencing links corticospinal motor neuron disease to common neurodegenerative disorders. Science343, 506–511 (2014). - PMC - PubMed
    1. Schüle, R. et al. Hereditary spastic paraplegia: clinicogenetic lessons from 608 patients. Ann. Neurol.79, 646–658 (2016). - PubMed
    1. Tesson, C., Koht, J. & Stevanin, G. Delving into the complexity of hereditary spastic paraplegias: how unexpected phenotypes and inheritance modes are revolutionizing their nosology. Hum. Genet.134, 511–538 (2015). - PMC - PubMed
    1. Hensiek, A., Kirker, S. & Reid, E. Diagnosis, investigation and management of hereditary spastic paraplegias in the era of next-generation sequencing. J. Neurol.262, 1601–1612 (2015). - PMC - PubMed
    1. Harding, A. E. Classification of the hereditary ataxias and paraplegias. Lancet1, 1151–1155 (1983). - PubMed

LinkOut - more resources