. 2025 Jul 1;16(1):5858.
doi: 10.1038/s41467-025-58389-y.

Autophagy controls differentiation of Drosophila blood cells by regulating Notch levels in response to nutrient availability

Affiliations

Autophagy controls differentiation of Drosophila blood cells by regulating Notch levels in response to nutrient availability

Maximiliano J Katz et al. Nat Commun. .

Abstract

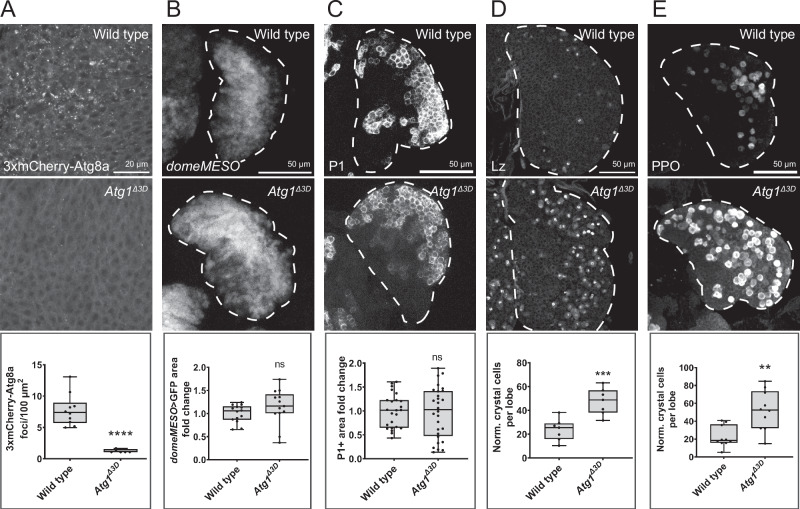
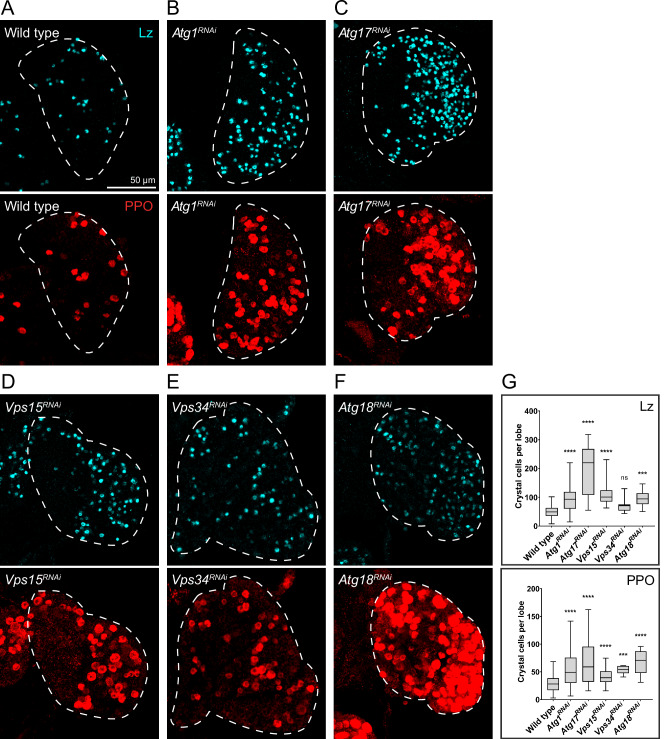
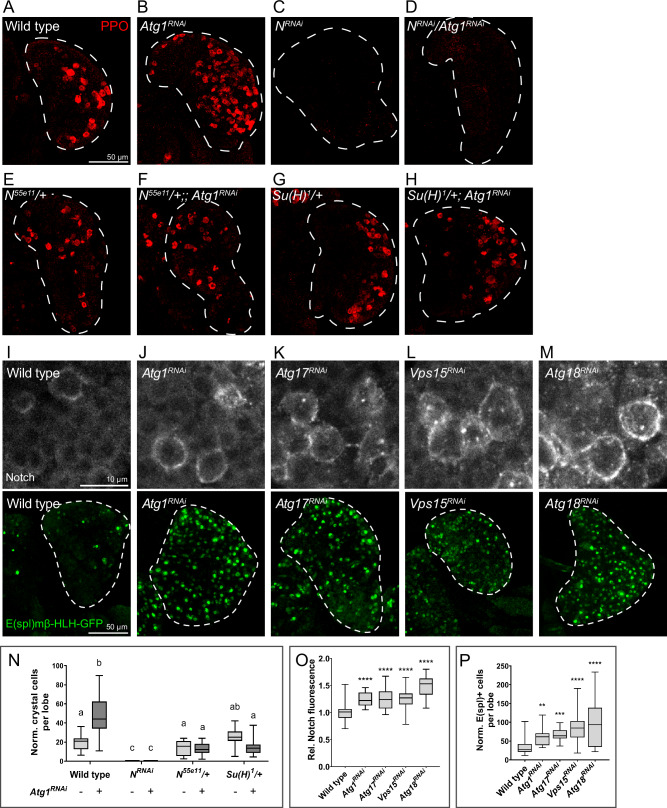
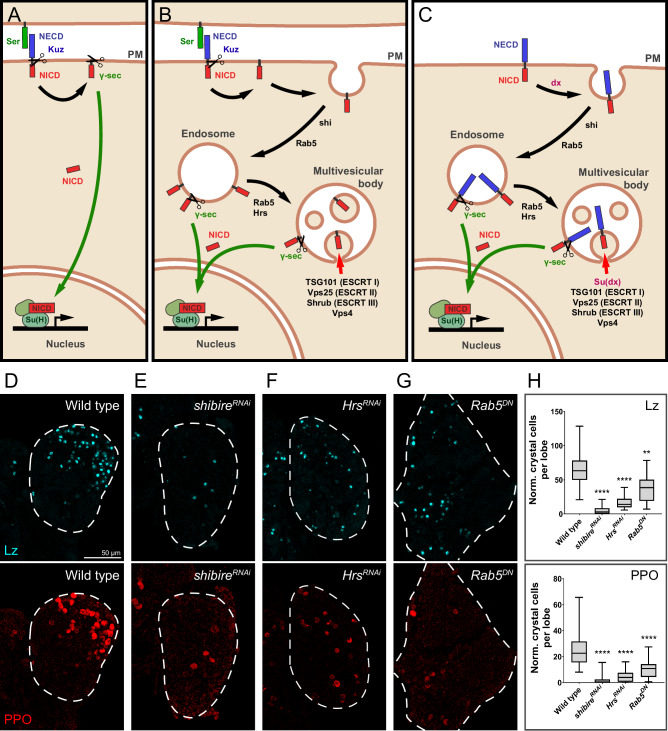
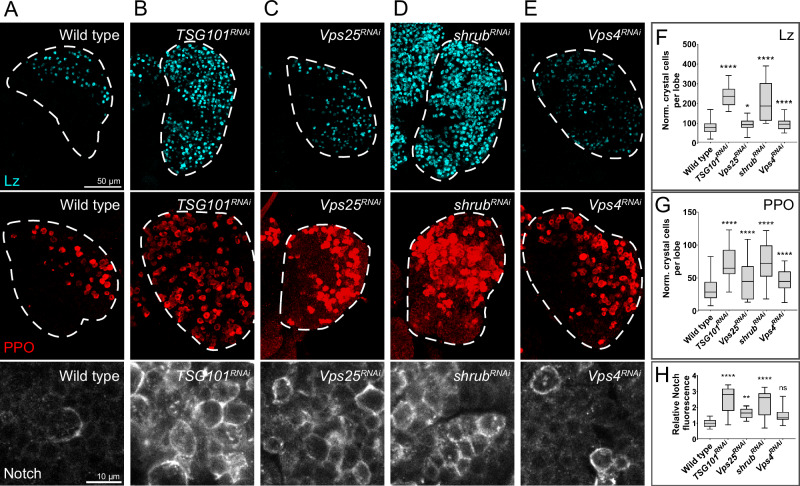
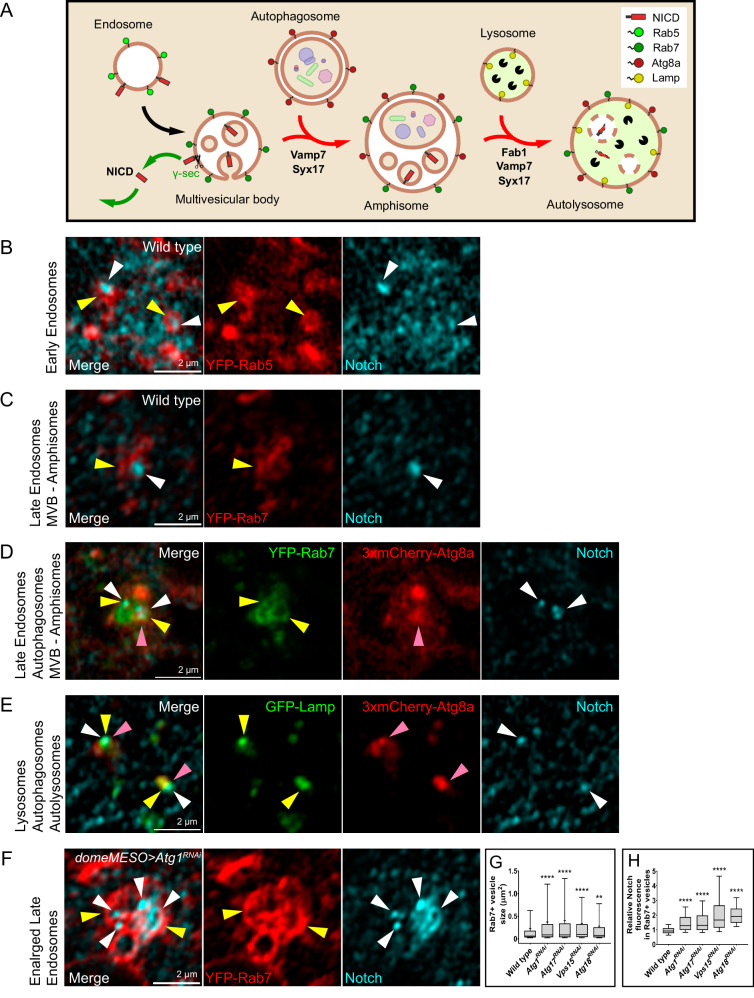
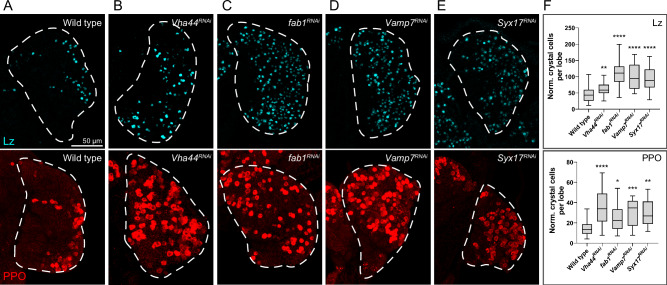
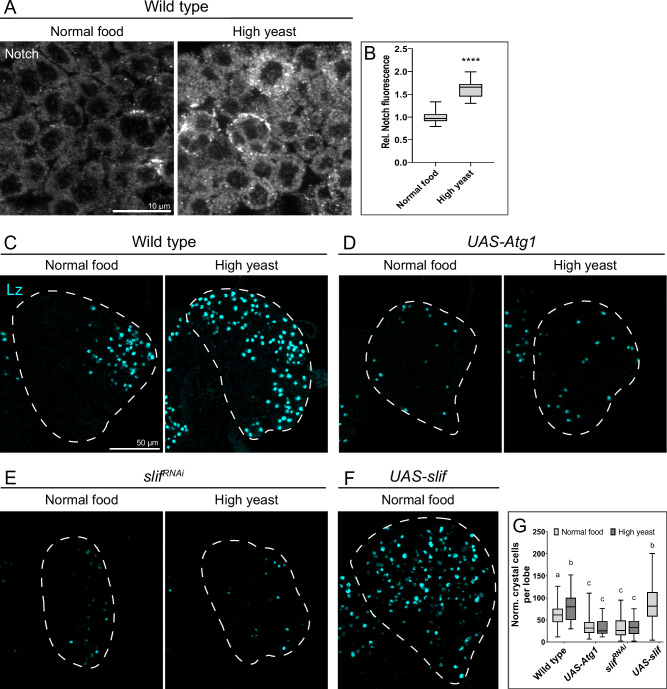
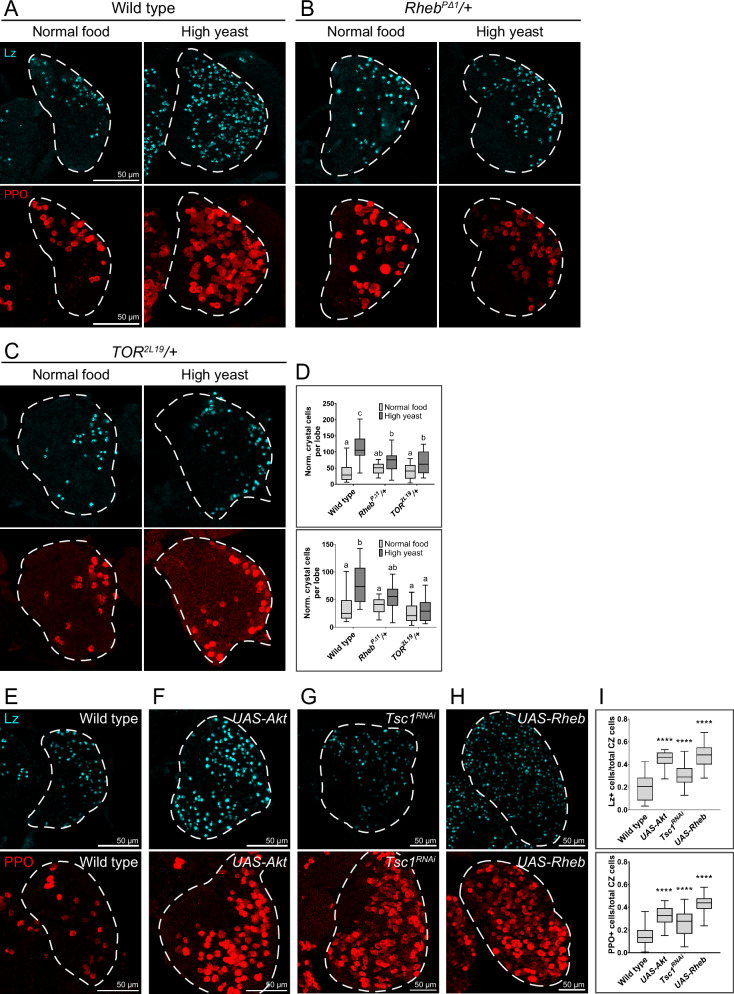
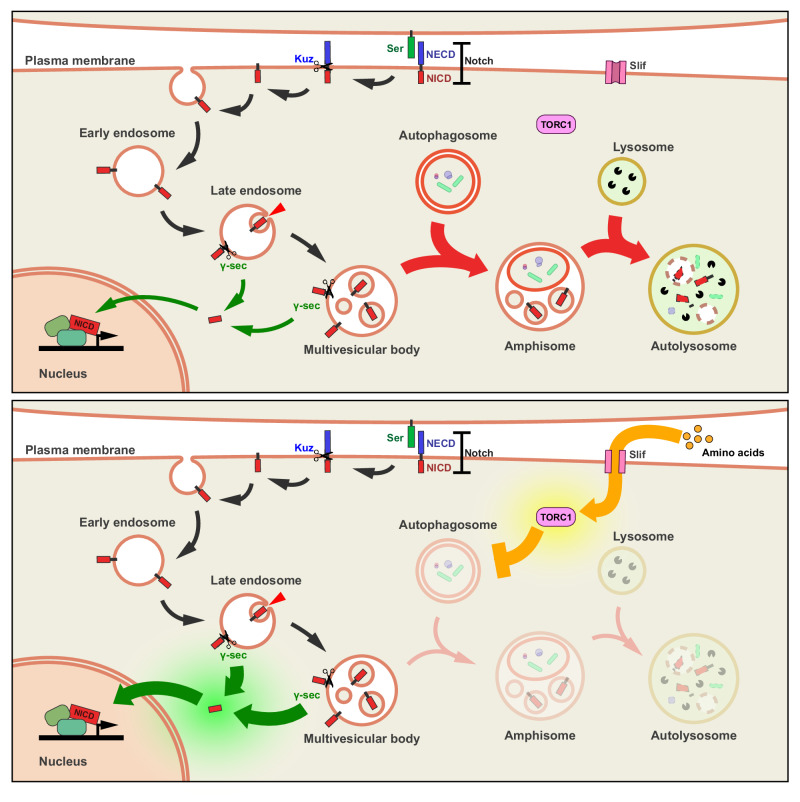
Drosophila larval hematopoiesis takes place at the lymph gland, where blood cell progenitors differentiate into two possible cell types: Plasmatocytes, analogous to mammalian macrophages, or crystal cells that share features with mammalian megakaryocytes; a third cell type, the lamellocytes, develop only upon specific immune challenges. Here we show that autophagy inhibition in blood cell progenitors results in augmented crystal cell differentiation due to Notch accumulation. Notch activation during hematopoiesis depends on the endocytic pathway, which crosstalks with autophagy: While Notch activation depends on endocytosis and endosomal maturation, Notch lysosomal degradation requires autophagy. TOR signaling inhibits autophagosome biogenesis that in turn prevents the formation of Notch-containing amphisomes, which are necessary for Notch lysosomal destruction. Reduction of Notch lysosomal degradation shifts the balance towards Notch activation at endosomal membranes, thereby enhancing differentiation of crystal cells. Our work therefore defines a mechanism of regulation of immune cell differentiation in response to the nutritional status of the organism.


Conflict of interest statement

Competing interests: The authors declare no competing interests.

Figures

Fig. 1
Fig. 1. Crystal cell differentiation increased in Atg1Δ3D mutants.
Confocal images of individual lobes of larval lymph glands; primary lobes indicated in white dashed lines. In Atg1Δ3D homozygous mutants, autophagy activation was reduced, as indicated by 3xmCherry-Atg8a nucleation (A n = 10 primary lobes for wild type, n = 8 for Atg1Δ3D; p < 0.0001). Progenitor (domeMESO > GFP; B n = 13 for wild type, n = 14 for Atg1Δ3D) or plasmatocyte (P1; C n = 24 for wild type, n = 28 for Atg1Δ3D) populations were unaffected in Atg1 mutants (p = 0.2210; p = 0.8221, respectively). Crystal cells increased in Atg1Δ3D mutant larvae as assessed by either anti-Lozenge (Lz; D n = 7 for each genotype; p = 0.0009) or anti-prophenoloxidase (PPO; E n = 10 for each genotype; p = 0.0016). Box plots were used to visualize data distribution, where the box represents the interquartile range (25th and 75th percentiles), the central line indicates the median, and whiskers indicate the minimum and maximum values in the dataset. Individual data points are shown. Statistical analysis was performed using an unpaired two-tailed Student’s t-test. **p < 0.01; ***p < 0.001; ****p < 0.0001; ns, not significant (p > 0.05). Source data for plots are provided as a Source Data file.
Fig. 2
Fig. 2. Knock-down of autophagy pathway genes in blood cell progenitors provoked increased crystal cell differentiation.
Crystal cells were visualized by anti-Lozenge (Lz) or anti-prophenoloxidase (PPO) immunofluorescence in Z-stack projections of lymph gland lobes (white dashed lines) where the indicated double-stranded RNAs, affecting different autophagy genes, have been expressed under control of a domeMESO-Gal4 driver (AF). Crystal cell differentiation increased in comparison to wild type controls (UAS-LacZ). Quantification of the normalized number of crystal cells per lobe is depicted on panel (G) where box plots show the data distribution, with the box representing the interquartile range, the central line indicating the median, and whiskers extending to the minimum and maximum values. For Lz+ cells, statistical analysis was performed using two-sided likelihood ratio test (Chi-squared) followed by Dunnett’s test for treatment versus control comparisons (p < 0.0001; p < 0.0001; p = 0.0862; p < 0.0001; p = 0.0010, respectively). For PPO+ cells, ANOVA followed by Dunnett’s test for treatment versus control comparisons was used (p < 0.0001; p < 0.0001; p = 0.0002; p < 0.0001; p < 0.0001, respectively). For wild type, n = 65 primary lobes; for Atg1RNAi, n = 24; for Atg17RNAi, n = 25; for Vps15RNAi, n = 19; for Vps34RNAi, n = 13; for Atg18RNAi, n = 21 for Lz, n = 20 for PPO. Source data for plots are provided as a Source Data file. ***p < 0.001; ****p < 0.0001; ns, not significant (p > 0.05).
Fig. 3
Fig. 3. Autophagy sets a limit to Notch accumulation and Notch-dependent crystal cell differentiation.
Crystal cells were visualized in Z-stack projections of lymph gland single lobes (dashed lines) by anti-PPO immunofluorescence (AH); RNAi expression was driven with domeMESO-Gal4. IM upper row: Anti-Notch immunofluorescence in wild type larvae and lymph gland lobes with reduced autophagy. N Quantification of the normalized number of crystal cells per lymph gland lobe. Kruskal-Wallis test followed by Dunn’s test for multiple comparisons. Mean values of genotypes marked with different letters are significantly different (p < 0.05). For wild type, n = 33 primary lobes; for Atg1RNAi, n = 43; for NRNAi, n = 18; for NRNAi/Atg1RNAi, n = 23; for N55e11/+, n = 14; for N55e11/+; Atg1RNAi, n = 28, for Su(H)1/+, n = 18; for Su(H)1/+; Atg1RNAi, n = 18. IM lower row: Notch transcriptional activity was evaluated with an E(spl)mβ-HLH-GFP transcriptional reporter in each genotype. O Mean fluorescence intensity of anti-Notch staining was quantified in single slices, and relative change of immunofluorescence respect to the control was calculated and plotted. Statistical analysis in was performed using one-way ANOVA followed by Dunnett’s test for comparisons of treatments versus control (p < 0.0001 for each genotype). For wild type, n = 37 primary lobes; for Atg1RNAi, n = 25; for Atg17RNAi, n = 16; for Vps15RNAi, n = 16; for Atg18RNAi, n = 25. P Quantification of the normalized number of GFP-positive cells per lobe. For wild type, n = 42 primary lobes; for Atg1RNAi, n = 21; for Atg17RNAi, n = 20; for Vps15RNAi, n = 55; for Atg18RNAi, n = 13. Statistical analysis in was performed using Kruskal-Wallis test followed by Dunn’s test for comparisons of treatments versus control (p = 0.0036; p = 0.0004; p < 0.0001; p < 0.0001, respectively). NP Box plots show the data distribution, with the box representing the interquartile range (25th and 75th percentiles), the central line indicating the median, and whiskers extending to the minimum and maximum values. Source data for plots are provided as a Source Data file. *p < 0.05; **p < 0.01; ***p < 0.001; ****p < 0.0001.
Fig. 4
Fig. 4. The endocytic pathway controls crystal cell differentiation.
A, B, C Schematic representation of the Notch pathway. A After Ser binding, Kuzbanian (Kuz) and the γ-secretase complex (γ-sec) cleave Notch, and the Notch Intracellular Domain (NICD) enters the nucleus to regulate gene expression together with Suppressor of Hairless (Su(H)). B After cleavage by Kuz, Notch can undergo endocytosis that depends on the dynamin shibire (shi), and remains inserted in the membrane of early endosomes that mature by the action of Hrs and Rab5 to late endosomes. Formation of intraluminal vesicles of the multivesicular body is mediated by ESCRT complexes 0-III, which include the subunits TSG101, Vps25 and Shrub; Vps4 is the effector ATPase. Notch can be cleaved at the limiting membrane of late endosomes or multivesicular bodies, and enters the nucleus to regulate transcription. Notch present in intraluminal vesicles of the multivesicular body is degraded at the lysosome (not shown in the scheme). C Ligand-independent activation of Notch: Notch can undergo endocytosis without previous ligand binding; in this case, the entire (uncleaved) receptor ends up in the membrane of endosomes. The subsequent steps of the pathway are identical to those described in B. The E3 ubiquitin ligase deltex (dx) stimulates Notch endocytosis; Suppressor of deltex (Su(dx)) stimulates the formation of Notch-containing intraluminal vesicles. DG Crystal cells visualized by anti-Lozenge (Lz) or anti-prophenoloxidase (PPO) immunofluorescence after knock-down of shi (E), Hrs (F) or Rab5 (G), with a domeMESO-Gal4 driver. White dashed lines mark lymph gland lobes. H Quantification of the results shown in panels (DG) boxes represent the interquartile range, the central line indicates the median, and whiskers extend to the minimum and maximum values. For wild type, n = 62 primary lobes; for shibireRNAi, n = 24; for HrsRNAi, n = 20; for Rab5DN, n = 22. The statistical analysis was performed in both cases using Kruskal-Wallis test, followed by Dunn’s test for treatment versus control comparisons (p = 0.0017 for Rab5DN Lz+ cells; p < 0.0001 for every other comparison). Source data for plots are provided as a Source Data file. **p < 0.01; ****p < 0.0001.
Fig. 5
Fig. 5. Knock-down of elements of ESCRT complexes resulted in increased Notch abundance and enhanced crystal cell differentiation.
Anti-Lozenge (Lz) and anti-prophenoloxidase (PPO) stainings to visualize crystal cells in Z-stack projections of lymph gland primary lobes (white dashed lines), and assess the effect of domeMESO-Gal4-driven knock-down of genes of different ESCRT complexes (BD) or the gene Vps4 (E) that encodes the effector ATPase of ESCRT complexes, in comparison with wild type individuals (A). F, G Quantification of normalized crystal cells per lobe as assessed by anti-Lz or anti-PPO staining respectively. F One-way ANOVA followed by Dunnett’s test for treatment versus control comparisons (p < 0.0001; p = 0.0125; p < 0.0001; p < 0.0001, respectively). G Two-sided likelihood ratio test (Chi-squared) followed by Dunnett’s test for treatment versus control comparisons (p < 0.0001 for each genotype). For wild type, n = 86 primary lobes; for TSG101RNAi, n = 24 for Lz and n = 22 for PPO; for Vps25RNAi, n = 24; for shrubRNAi, n = 19; for Vps4RNAi, n = 33. Notch immunofluorescence performed with an antibody targeting the Notch extracellular domain shows that Notch protein levels in each genotype (AE) parallels the increase in differentiation of crystal cells. H Quantification of Notch immunofluorescence expressed as relative change in fluorescence intensity respect of the wild type genotype. For wild type, n = 20; for TSG101RNAi, n = 16; for Vps25RNAi, n = 19; for shrubRNAi, n = 15; for Vps4RNAi, n = 14. One-way ANOVA followed by Dunnett’s test for treatment versus control comparisons (p < 0.0001; p = 0.0038; p < 0.0001; p = 0.0732, respectively). FH Box plots show the data distribution, with the box representing the interquartile range, the central line indicating the median, and whiskers extending to the minimum and maximum values. Source data for plots are provided as a Source Data file. *p < 0.05; **p < 0.01; ****p < 0.0001; ns, not significant (p > 0.05).
Fig. 6
Fig. 6. Notch localized at endosomal, autophagosomal and lysosomal compartments.
A Schematic representation of endosomal maturation and fusion with autophagosomes. Endosomes mature into multivesicular bodies, in which limiting membrane the Notch Intracellular Domain (NICD) can be cleaved and enter the nucleus (nucleus not shown). Alternatively, the NICD can be sorted to intraluminal vesicles of the multivesicular body that fuses with autophagosomes to give rise to amphisomes, which fuse with lysosomes, resulting in autolysosomes where the NICD is degraded. BF High-resolution (AiryScan) confocal images of Notch associated to endosomal or autophagic vesicles in the lymph gland. Part of Notch protein (cyan, white arrowheads) localized in Rab5-positive early endosomes (red, yellow arrowheads) (B) Rab7-positive late endosomes/multivesicular bodies (red, yellow arrowheads) (C), amphisomes positive for Rab-7 (green, yellow arrowheads) and Atg8a (red, pink arrowheads) (D) or autolysosomes decorated with Lamp (green, yellow arrowheads) and Atg8a (red, pink arrowheads) (E). F After autophagy inhibition through the expression of Atg1RNAi, Rab7-positive vesicles significantly enlarged (red, yellow arrowheads) and contained increased amounts of Notch protein (cyan, white arrowheads). G Quantification of the size of Rab7-positive vesicles in the experiments of panels (C, F) and after silencing the indicated autophagy genes. Wild type, n = 1431 vesicles; Atg1RNAi, n = 753; Atg17RNAi, n = 628; Vps15RNAi, n = 713; Atg18RNAi, n = 1085. H Quantification of Notch in Rab7 vesicles in the experiments of panels (C, F) and after silencing of the indicated autophagy pathway genes. Wild type, n = 966 vesicles; Atg1RNAi, n = 1989; Atg17RNAi, n = 1564; Vps15RNAi, n = 1857; Atg18RNAi, n = 1048. Boxes represent the interquartile range, the central line indicates the median, and whiskers extend to 10th and 90th percentiles. Mean values are shown in G as a dash. The statistical analysis performed in both cases was Kruskal-Wallis test followed by Dunn’s test for treatment versus control comparisons (p = 0.0067 for Atg18 RNAi in G; p < 0.0001 for every other comparison). Source data for plots are provided as a Source Data file. **p < 0.01; ****p < 0.0001.
Fig. 7
Fig. 7. Blockage of lysosomal maturation or impairment of fusion events that give rise to amphisomes or autolysosomes increased crystal cell differentiation.
Anti-Lozenge (Lz) and anti-prophenoloxidase (PPO) staining were used to visualize crystal cells in Z-stack projections of the lymph gland (white dashed line). After knock-down of the V-ATPase subunit Vha44 or the lipid kinase Fab1 with a domeMESO-Gal4 driver, an increase of crystal cell differentiation occurred in comparison with wild type control larvae (AC). Knock-down of the SNAREs Vamp7 or Syntaxin-17 also led to augmented crystal cell differentiation (D, E). F Quantification of normalized crystal cells per lobe, as assessed with anti-Lz and anti-PPO antibodies respectively. Box plots show the data distribution, with the box representing the interquartile range, the central line indicating the median, and whiskers extending to the minimum and maximum values. Wild type, n = 22; Vha44RNAi, n = 24; fab1RNAi, n = 21; Vamp7RNAi, n = 20; Syx17RNAi, n = 19. Brown-Forsythe and Welch ANOVA followed by Dunnett’s T3 test for treatments against control comparisons (for Lz, p = 0.0037, p < 0.0001, p < 0.0001, p < 0.0001, respectively; for PPO, p < 0.0001, p = 0.0209, p = 0.0002, p = 0.0013, respectively). Source data for plots are provided as a Source Data file. *p < 0.05; **p < 0.01; ***p < 0.001; ****p < 0.0001.
Fig. 8
Fig. 8. Amino acid availability controlled Notch protein abundance and crystal cell differentiation.
Anti-Notch immunofluorescence (A) indicated that Notch protein levels were higher in lymph glands of larvae grown in culture medium containing high yeast (4% w/v) in comparison to larvae grown in normal medium (2% yeast w/v). B Notch immunofluorescence intensity (arb. units) relative to the one of larvae reared in normal food. Unpaired two-tailed Student’s t-test (****, p < 0.0001). Normal food, n = 13 primary lobes; high yeast, n = 14. Crystal cell differentiation increased in larvae grown in the yeast-rich medium, in comparison to normal fly food (C), as assessed by anti-Lozenge (Lz) immunofluorescence in Z-stack projections of lymph gland lobes (dashed line). The increase of crystal cell differentiation observed in (C) was suppressed after overexpression of Atg1 (D) with domeMESO-Gal4 driver. RNAi-mediated knock-down of the amino acid transporter Slimfast (Slif) prevented the increase of crystal cell differentiation provoked by the addition of extra-yeast in the fly food (E). Overexpression of Slif led to increased crystal cell differentiation in larvae reared in normal food, compared with wild type animals (C, F). G Quantification of the results of panels (CF). One-way ANOVA followed by Tukey’s test for multiple comparisons. Different letters represent statistically significant differences (p < 0.05). For the wild type genotype, n = 144 primary lobes in normal food and n = 51 in high yeast; for UAS-Atg1, n = 24 in normal food and n = 24 in high yeast; for slifRNAi, n = 75 in normal food and n = 44 in high yeast; for UAS-slif, n = 77. B, G Box plots show the data distribution, with the box representing the interquartile range, the central line indicating the median, and whiskers extending to the minimum and maximum values. Source data for plots are provided as a Source Data file.
Fig. 9
Fig. 9. The TOR pathway conveyed the effect of a high yeast diet on crystal cell differentiation.
The number of crystal cells in the lymph gland (white dashed line) was assessed using anti-Lozenge (Lz) and anti-prophenoloxidase (PPO) staining in Z-stack projections. The increase of crystal cell differentiation induced by a high-yeast diet (A) was mitigated in RhebPΔ1 (B) or TOR2L19 (C) heterozygous larvae. D Quantification of the above results. Two-way ANOVA followed by Tukey’s test for multiple comparisons. When boxes are marked with the same letter, the difference between the mean values is not statistically significant (p > 0.05). If two boxes are marked with different letters, the mean values are significantly different (p < 0.05). For the wild type genotype, n = 48 primary lobes in normal food and n = 46 in high yeast; for RhebPΔ1/+, n = 13 in normal food and n = 14 in high yeast; for TOR2L19/+, n = 23 in normal food and n = 23 in high yeast. EH Overexpression of Akt, silencing of Tsc1 or overexpression of Rheb driven by domeMESO-Gal4 led to increased crystal cell differentiation. I Quantification of these results, represented as the ratio between crystal cells and total cortical zone (CZ) hemocytes, which were calculated as the sum of P1+ cells (mature plasmatocytes) and Lz + /PPO+ cells (crystal cells). One-way ANOVA followed by Dunnett’s test for treatments versus control comparisons (p < 0.0001 for each comparison). For wild type, n = 27 for Lz and n = 71 for PPO; for UAS-Akt, n = 18 for Lz and n = 16 for PPO; for Tsc1RNAi, n = 35 for Lz and n = 36 for PPO; for UAS-Rheb, n = 22 for Lz and n = 26 for PPO. D, I Box plots show the data distribution, with the box representing the interquartile range, the central line indicating the median, and whiskers extending to the minimum and maximum values. Source data for plots are provided as a Source Data file. ****p < 0.0001.
Fig. 10
Fig. 10. Proposed model for regulation of Notch signaling by nutrients in blood cell progenitors.
Amino acids enter the cell through the transporter Slimfast (Slif), thereby stimulating the kinase TOR, which results in inhibition of autophagosome formation (yellow lines). Notch is endocytosed after ligand (Ser) binding, and Kuzbanian (Kuz)-dependent cleavage. The Notch Intracellular Domain (NICD) remains inserted in the membrane of early endosomes, which then mature into late endosomes and further into multivesicular bodies (black arrows). The NICD can be processed by the γ-secretase (γ-sec) at the limiting membrane of late endosomes or multivesicular bodes, and released to enter the nucleus, where it regulates transcription (green arrows). Alternatively, the NICD present at the limiting membrane of multivesicular bodies, can be internalized to end up in intraluminal vesicles. Fusion of multivesicular bodies with autophagosomes results in Notch-containing amphisomes, which fuse with lysosomes to form autolysosomes (red arrows), where Notch is finally degraded. Thus, nutrient availability regulates the abundance of autophagosomes (yellow arrows), which ultimately determines the extent of Notch lysosomal degradation (red arrows). If Notch is not degraded, it can be activated to control gene expression (green arrows).

Similar articles

References

    1. Cho, B. et al. Single-cell transcriptome maps of myeloid blood cell lineages in Drosophila. Nat. Commun.11, 4483 (2020). - PMC - PubMed
    1. Girard, J. R. et al. Paths and pathways that generate cell-type heterogeneity and developmental progression in hematopoiesis. eLife10, e67516 (2021). - PMC - PubMed
    1. Banerjee, U., Girard, J. R., Goins, L. M. & Spratford, C. M. Drosophila as a genetic model for hematopoiesis. Genetics211, 367–417 (2019). - PMC - PubMed
    1. Binggeli, O., Neyen, C., Poidevin, M. & Lemaitre, B. Prophenoloxidase activation is required for survival to microbial infections in drosophila. PLOS Pathog.10, e1004067 (2014). - PMC - PubMed
    1. Shin, M. et al. Drosophila immune cells transport oxygen through PPO2 protein phase transition. Nature10.1038/s41586-024-07583-x (2024). - PMC - PubMed

LinkOut - more resources