. 2025 Jul 1;16(1):5477.
doi: 10.1038/s41467-025-60446-5.

High-resolution detection of copy number alterations in single cells with HiScanner

Affiliations

High-resolution detection of copy number alterations in single cells with HiScanner

Yifan Zhao et al. Nat Commun. .

Abstract

Improvements in single-cell whole-genome sequencing (scWGS) assays have enabled detailed characterization of somatic copy number alterations (CNAs) at the single-cell level. Yet, current computational methods are mostly designed for detecting chromosome-scale changes in cancer samples with low sequencing coverage. Here, we introduce HiScanner (High-resolution Single-Cell Allelic copy Number callER), which combines read depth, B-allele frequency, and haplotype phasing to identify CNAs with high resolution. In simulated data, HiScanner consistently outperforms state-of-the-art methods across various CNA types and sizes. When applied to high-coverage scWGS data from 65 cells across 11 neurotypical human brains, HiScanner shows a superior ability to detect smaller CNAs, uncovering distinct CNA patterns between neurons and oligodendrocytes. We also generated low-coverage scWGS data from 179 cells sampled from the same meningioma patient at two time points. For this serial dataset, integration of CNAs with point mutations revealed evolutionary trajectories of tumor cells. These findings show that HiScanner enables accurate characterization of frequency, clonality, and distribution of CNAs at the single-cell level in both non-neoplastic and neoplastic cells.


Conflict of interest statement

Competing interests: P.J.P. is a member of the scientific advisory board (SAB) for Bioskryb Genomics, Inc. C.A.W. is a member of the SAB of Bioskryb Genomics, Inc. (cash, equity), Mosaica Therapeutics (cash, equity), and an advisor to Maze Therapeutics (equity). The remaining authors declare no competing interests.

Figures

Fig. 1
Fig. 1. HiScanner algorithm overview.
HiScanner starts with scWGS data as input. In the preprocessing step, gHETs are called from bulk and phased using population-level reference panels. Normalization is performed at the nucleotide level to remove GC bias from read depth signals. Subsequently, a two-state hidden Markov model is employed to estimate ADO event lengths, which are then used to find the optimal bin size by setting a cutoff at the top 5th percentile of the length distribution. For each cell, HiScanner aggregates allele- and haplotype-specific read counts per bin to compute BAF and performs semi-parametric regression to compute RDR. In the segmentation step, HiScanner jointly partitions the genomes across all cells using BIC to identify breakpoints. An LOH test is then used to further refine the BAF estimates within each segment (see Supplementary Note for details). In the variant calling and interpretation step, for each cell, HiScanner simultaneously infers the cell-specific scale factor and allelic copy number for each segment by modeling the RDR and BAF as Gaussian distributions. A web-based visualization tool, ViScanner, is also provided, which enables interactive visualization of HiScanner CNA calls at any resolution. Other downstream analyses of HiScanner output include tasks such as phylogenetic inference and correlation of CNAs with SNVs and indels. HiScanner’s key contributions are highlighted in light red boxes. Created in BioRender. Chun, E. (2025) https://BioRender.com/bpgwigx.
Fig. 2
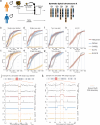
Fig. 2. Method comparisons on simulated data.
a Construction of synthetic diploid X chromosomes. First, two single cells are obtained from different male donors. Next, reads are extracted from chromosome X, excluding reads from pseudoautosomal regions, and germline or somatic CNAs identified in the original cells are removed. This serves as a template for creating various non-clonal CNA conditions, including single copy loss (1|0), single copy gain (2|1), two copy gain (3|1), and cnLOH (2|0), after which the reads are merged to create a BAM file for each mutated synthetic diploid chromosome X. bi Evaluations of precision and sensitivity for five callers for simulated single copy losses, single copy gains, two copy gains, and cnLOHs. Shaded regions indicate 95% confidence interval bands calculated from bootstrap sampling. Examples illustrating caller discrepancies in detecting a simulated single copy loss ( j) and a simulated single copy gain (k). Ground truth CNA boundaries are shown as red dashed lines.
Fig. 3
Fig. 3. Method comparison in a single, aneuploid PTA neuron.
a BAF track of single neuron 5823PFC-B using 100 kb mappable bins, and corresponding RDR tracks overlaid with total copy number calls reported by different methods: HiScanner, Ginkgo, CHISEL, and CHISEL after parameter optimization on 5 Mb bins, SCYN, SCOPE. b RDR distribution for bins inside centromeric regions. CHISEL*: CHISEL on 5 Mb bins. c Breakpoint density of each method’s call set. d Length distribution of BAF-concordant or BAF-discordant loss events called by HiScanner and Ginkgo. All HiScanner calls were BAF-concordant (i.e., y value = 0 for the red bars). e An example of a diploid region showing uneven read coverage. f An example showing a 1 Mb loss on chromosome 13. The shaded region indicates the location of a CNA candidate.
Fig. 4
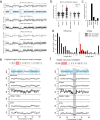
Fig. 4. Application to somatic mosaicism in human brain cells.
a Experimental workflow. Nuclei from neurons and oligodendrocytes were isolated from 11 human brains, followed by whole-genome amplification, sequencing, and somatic CNA detection using Ginkgo and HiScanner. Created in BioRender. Chun, E. (2025) https://BioRender.com/hk8kcyi. Length distribution of HiScanner CNA calls, categorized by type and clonality, in 31 neurons (b) and 32 oligodendrocytes (c). d, e Length distribution of Ginkgo CNA calls. f Example of a diploid region with uneven coverage where a spurious loss is called by Ginkgo. g Example of two adjacent single copy losses, one of which is missed by Ginkgo. h Example of a 2 Mb single copy loss. Shaded regions indicate positions where Ginkgo calls are discrepant with HiScanner and BAF. i, j Number of Ginkgo calls that are concordant or discordant with BAF, categorized by length and cell types.
Fig. 5
Fig. 5. Application to low-coverage scWGS of a recurrent meningioma tumor pair.
a 179 single cells from a paired initial and recurrent meningioma tumor sample were amplified by PTA and sequenced. Total copy number (b), RDR (c), and BAF (d) matrices output by HiScanner. Cell ordering is determined by hierarchical clustering applied to the copy number matrix. Each row represents one cell and each column corresponds to one genomic bin (500 kb mappable). Total copy number and BAF profiles of four representative cells from the major clone of tumor grade II (e), major clone of tumor grade III (f) grade III, BOS-EE06 (g), and tetraploid clone from tumor grade III (h). Scatter plots of the second and third eigenvectors of the Laplacian similarity matrix output by SECEDO, colored by SECEDO-inferred SNV clusters (i) and HiScanner-based CNA hierarchical clusters ( j).

Update of

References

    1. Svensson, V., Vento-Tormo, R. & Teichmann, S. A. Exponential scaling of single-cell RNA-seq in the past decade. Nat. Protoc. 13, 599–604 (2018). - PubMed
    1. Saliba, A.-E., Westermann, A. J., Gorski, S. A. & Vogel, J. Single-cell RNA-seq: advances and future challenges. Nucleic Acids Res.42, 8845–8860 (2014). - PMC - PubMed
    1. Buenrostro, J. D. et al. Single-cell chromatin accessibility reveals principles of regulatory variation. Nature523, 486–490 (2015). - PMC - PubMed
    1. Ramani, V. et al. Massively multiplex single-cell Hi-C. Nat. Methods14, 263–266 (2017). - PMC - PubMed
    1. Nagano, T. et al. Single-cell Hi-C reveals cell-to-cell variability in chromosome structure. Nature502, 59–64 (2013). - PMC - PubMed

LinkOut - more resources