. 2025 Jul 1;16(1):5470.
doi: 10.1038/s41467-025-60557-z.

Single-cell transcriptomics reveals BMP4-BMPR2 signaling promotes radiation resistance in hematopoietic stem cells following injury

Affiliations

Single-cell transcriptomics reveals BMP4-BMPR2 signaling promotes radiation resistance in hematopoietic stem cells following injury

Yanhua Li et al. Nat Commun. .

Abstract

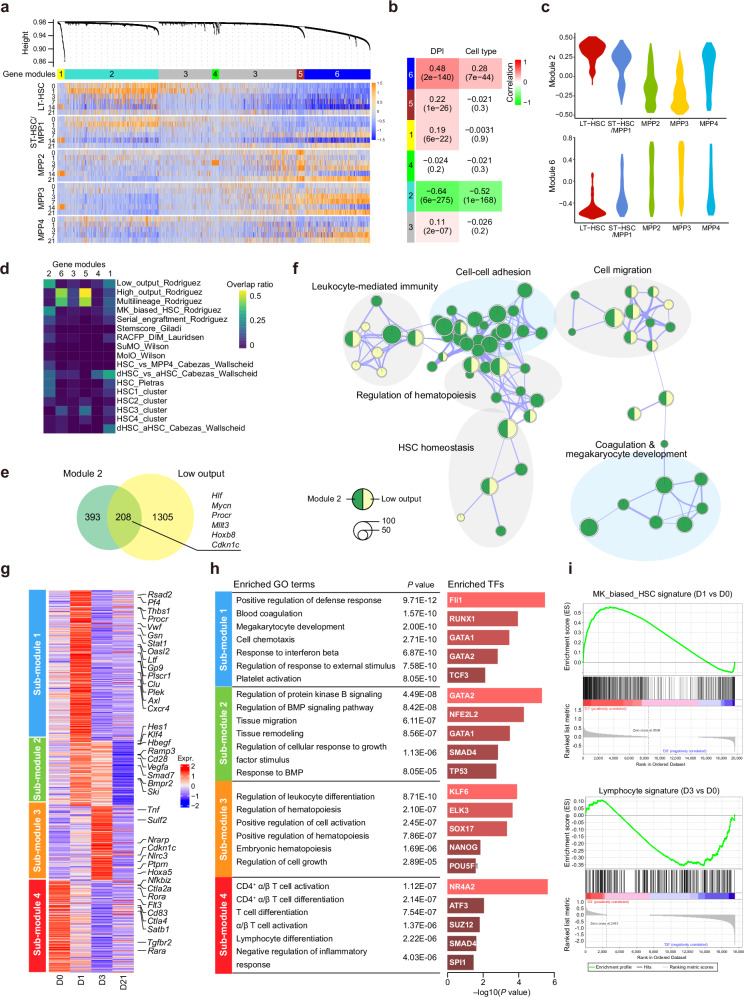
High doses of ionizing radiation (IR) cause severe damage to the hematopoietic system. However, the heterogeneity of hematopoietic stem and progenitor cells (HSPCs) in response to IR stress remains largely uncharacterized. Here, we present a dynamic single cell transcriptomic landscape and elucidate the complex crosstalk between HSPCs and the bone marrow (BM) microenvironment during IR-induced regeneration process. We reveal that BMP4 signaling in HSPCs confers IR resistance, and a single administration of BMP4 or SB4 can rescue mice from the IR-induced mortality. Furthermore, we identify BMPR2+ HSCs as a radiation resistant subset, displaying distinct epigenetic landscapes from BMPR2- HSCs under radiation stress. BMPR2+ HSCs sustain a strong self-renewal capacity primarily by reducing the H3K27me3 modification on the Nrf2 gene in response to radiation stress. In Nrf2 knockout mice, we demonstrate that Nrf2 is a critical downstream functional gene for BMP4-BMPR2 signaling on HSCs to resist IR-induced damage. Collectively, we provide insights into the molecular intricacies underlying HSPC heterogeneity and BM niche after radiation exposure, and we uncover that BMP4-BMPR2 signaling may serve as a promising target for developing innovative and effective intervention strategies to mitigate IR-induced hematopoietic injury.


Conflict of interest statement

Competing interests: The authors declare no competing interests.

Figures

Fig. 1
Fig. 1. Single-cell transcriptomes of BM cells and trajectory analysis of HSPCs upon IR.
a Experimental design for studying the dynamic transcriptome changes of BM cells following IR-induced BM injury. The cartoon illustrations of a mouse and a bone were obtained from Figdraw. b UMAP visualization of different BM cell types identified by scRNA-seq. c UMAP visualization and differentiation trajectories among re-clustered HSPCs in BM. d UMAP visualization of pseudotime scores and expression profiles of signature genes along different pseudotime trajectories. e MELD plots (top) quantifying the distribution and stacked bar plots (bottom). f Differential signature scores of three differentiation trajectories and proliferation, comparing HSPC subpopulations after IR exposure at different time points with those at D0. The P values are calculated using a permutation-based approach in GSEA. g Expression profiles of representative genes of the GMP trajectory (Cebpe and Mt1) and proliferation (Mki67 and Ccnb2) along the pseudotime trajectories. Fitting curves of gene expression in two groups was shown with 95% confidence intervals. h Differentially activated transcription factors between MPP3 at D3 and those at D0. The differential expression analysis was performed by fitting an empirical Bayes linear model. Source data are provided as a Source Data file.
Fig. 2
Fig. 2. Gene co-expression network analysis revealed dynamic transcriptional programs in HSPCs related to IR stress.
a Hierarchical clustering and heatmap showing the distinct expression patterns of six gene modules in HSPCs identified by weighted gene co-expression network analysis (WGCNA). b Associations between the six gene modules and the temporal course and cell types of HSPCs. DPI, days post-irradiation. c Distribution of scores for Module 2 and Module 6 among HSPC subpopulations calculated by GSVA. d Heatmap showing the overlap ratios between different signature scores across the six gene modules. e Venn plot showing the shared and specific genes of Module 2 and the low-output signature. f Functional enrichment network showing the shared and specific GO terms related to Module 2 and the low-output signature. g Heatmap showing the dynamic expression profiles of the four sub-modules within Module 2. h Enriched GO terms and activated TFs in the four sub-modules. Significances of enrichment analyses were calculated using the Chi-square test. i GSEA analysis showing the high MK-biased HSC score at D1 and the low lymphocyte score at D3 in LT-HSCs compared to those at D0. Source data are provided as a Source Data file.
Fig. 3
Fig. 3. Dynamic cell-cell communication patterns mediated by ligand-receptor interactions upon IR.
a UMAP visualization of cytokine scores for each cell type in BM cells. b Violin plots showing the distribution of cytokine scores across different cell types in BM cells. c Dotplot showing the expression profiles of cytokines across different cell types. Dot color indicates the average expression levels, and dot size indicates the fraction of expressing cells. d Violin plots showing representative cytokine expression changes in basophils and T/NKs at D0 and at D3 after 6.5 Gy of IR. e Fold change in OSM and IL6 expression levels in basophils, and fold change in CCL5 expression levels in T cells, at D0 and at D3 after 6.5 Gy of IR. n  =  3 or 4 biological replicates per group. Data shown are mean ± SEM. f Dotplot showing the enriched LR pairs between HSPC subpopulations and niche cells. Dot color indicates the fold change (FC) of enrichment, and dot size indicates the P value of enrichment. g Two clusters of LR interactions with distinct temporal intensity patterns (left) were observed between different HSPC subpopulations and niche cells (right). h Heatmap showing the intensities of specific LR pairs across different time points after IR. “Cell to” indicates the cell type highly expressing the receptor in the corresponding ligand-receptor. “Cell from” indicates the cell type highly expressing the ligand in the corresponding LR. i Fold change in BMP4 expression levels in CD45VE-CAD⁺ endothelial cells and CD45LEPR⁺ stromal cells at D0 and D1 after 6.5 Gy of IR. j Fold change in pSMAD1/5 expression levels in HSCs at D0 and D1 after 6.5 Gy irradiation. n = 4 biological repeats per group. Data shown are mean ± SEM. Statistical analyses were conducted using unpaired two-sided Student’s t tests (e, i, j). Source data are provided as a Source Data file.
Fig. 4
Fig. 4. BMP4 can protect HSCs from radiation-induced damage and promotes hematopoietic regeneration.
a Comet assay of LSK cells. n = 100 cells per group. b Representative images of γH2AX foci and γH2AX foci counts per HSC across treatment conditions. n = 100 cells per group. c Histograms of ROS levels measured by CellROX in HSCs and the relative CellROX MFI normalized to the non-IR group. n = 4 biological repeats per group. d Number of hematopoietic colonies formed by LSK cells in each group. n = 3 biological repeats per group. e Percent survival of mice after receiving 8.0 Gy of IR and different dosages of BMP4. n = 8 mice per group. f WBC, PLT, and RBC counts in the PB. n = 5 mice per group. BM morphology and the cellularity of BM (g, n = 8 mice per group) on D10 after exposure to 6.5 Gy of IR. Frequencies of LSKs and HSCs (i), the total number of HSCs (j) and the number of CFU (k) in mice treated with vehicle or BMP4 on D10 following 6.5 Gy of IR. n = 8 mice per group (i, j). n = 6 biological repeats per group (k). l Competitive transplantation strategy. The cartoon illustrations of mice and bones were obtained from Figdraw. The percentages (m, p) and the lineage distribution (n) of donor-derived cells in the PB of recipient mice. The engraftment of donor HSCs was assessed in recipient mice at 16 weeks (o, q). n = 6 mice per group. r Percentage survival of mice after receiving 8.0 Gy of IR and different dosages of SB4. n = 6 mice for Veh group, n = 5 mice for each SB4-treated group. s WBC, PLT, and RBC counts in the PB. n = 5 mice per group. Data shown are mean ± SEM. Statistical analyses were conducted using two-way ANOVA with multiple comparisons by Tukey’s test (ad), two-sided log-rank test (e, r), and unpaired two-sided Student’s t test (f, hq, s). Source data are provided as a Source Data file.
Fig. 5
Fig. 5. BMPR2+ HSCs represent a population of stem cells that exhibit resistance to radiation.
a UMAP visualization of Bmpr2+ and Bmpr2 LT-HSC. b Barplot showing the enriched GO terms in upregulated genes in Bmpr2⁺ HSCs compared to Bmpr2⁻ HSCs. Significances of enrichment analyses were calculated using Chi-square test. c Cell counts of Bmpr2⁺ and Bmpr2⁻ LT-HSCs at homeostasis (D0) and D1 after 6.5 Gy of IR. d UMAP visualization of Bmpr2⁺ and Bmpr2⁻ LT-HSCs at D0 and D1 after 6.5 Gy of IR. e, f Percentage and quantification of BMPR2⁺ HSCs at D0 and D1 after 6.5 Gy of IR. n = 8 mice per group. g The number of γH2AX foci in BMPR2⁺ and BMPR2⁻ HSCs at 2 hours post-irradiation. Representative plots of γH2AX foci and the number of γH2AX foci per HSC. n = 200 cells per group. h Hallmark pathways significantly upregulated in Bmpr2⁺ and Bmpr2⁻ LT-HSCs, respectively. Significances of enrichment analyses were calculated using Chi-square test. i Analysis of the ROS pathways in Bmpr2⁺ and Bmpr2⁻ LT-HSCs using Gene Set Enrichment Analysis (GSEA). j Representative analyses of CellROX levels in BMPR2⁺ and BMPR2⁻ HSCs at D0 and D1 after 6.5 Gy of IR, along with the fold change. n = 4 biological repeats per group. k The relative activity of Caspase 3/7 normalized to the non-IR BMPR2⁻ HSCs group. n = 4 biological repeats per group. Data shown are mean ± SEM. Statistical analyses were conducted using two-way ANOVA with multiple comparisons by Tukey’s test (eg, j, k). Source data are provided as a Source Data file.
Fig. 6
Fig. 6. BMPR2+ HSCs promote hematopoietic regeneration in vivo.
a Number of CFUs formed by BMPR2⁺ and BMPR2⁻ HSCs at homeostasis (D0) and D1 after 6.5 Gy of IR. n = 3 biological repeats per group. b MFI of TMRM and MitoTracker in BMPR2⁺ and BMPR2⁻ HSCs at D0 and D1 after 6.5 Gy of IR. n = 4 biological repeats per group. cm Competitive transplantation. The cartoon illustrations of mice and bones were obtained from FigDraw. Donor-derived chimerism in the PB of recipients at 16 weeks using 100 BMPR2⁺ HSCs or BMPR2⁻ HSCs (d, g) and using 2000 BMPR2⁺ HSCs or BMPR2⁻ HSCs from 6.5 Gy-irradiated donor mice (i, l) after primary and secondary transplantation. The lineage distribution of donor-derived cells in the PB of recipient mice (e, j) and the engraftment of donor HSCs were assessed in recipient mice (f, h, k, m). n = 8 mice per group. n WGCNA Module 2 (stemness maintenance) and low-output signatures in Bmpr2⁺ and Bmpr2⁻ LT-HSCs using GSEA. o Violin plot showing the upregulation of stemness maintenance-related genes in Bmpr2⁺ LT-HSCs (n = 88) compared to Bmpr2 LT-HSCs (n = 86). Boxplot within the violin showing the 0.25, 0.5 and 0.75 quartiles of gene expression. Statistical analyses were conducted using the Wilcox rank test. Data shown are mean ± SEM. Source data are provided as a Source Data file.
Fig. 7
Fig. 7. Different chromatin accessibility landscapes of Nrf2 and its downstream genes in BMPR2+ and BMPR2 HSCs by ATAC-seq.
a Centered ATAC-seq peaks in BMPR2⁺ and BMPR2⁻ HSCs at D0 and D1 after 6.5 Gy of IR (top), and their distributions across different genomic regions. b Functional enrichment of genes with open chromatin specifically in BMPR2⁺ HSCs. c Top enriched TFBS motifs across the open chromatin regions specifically in BMPR2⁺ HSCs. d Top enriched TFs in BMPR2⁺ HSCs inferred from scRNA-seq data. e Chromatin accessibility landscapes across Nrf2, Hmox1, Runx1, and Etv2. f TF-gene networks showing the top enriched TFs and their target genes in BMPR2⁺ HSCs identified by ATAC-seq. Significances of enrichment analysis in bd were calculated using the Chi-square test. Source data are provided as a Source Data file.
Fig. 8
Fig. 8. Bivalent histone modifications switch the transcriptional status of Nrf2 in response to IR.
a Centered CUT&Tag peaks of H3K4me3 (±2 Kb of TSS) and H3K27me3 (gene body) in BMPR2⁺ and BMPR2 HSCs at homeostasis (D0) and D1 after 6.5 Gy of IR. b Circos plot showing the switching events across different histone modification (HM) statuses between BMPR2⁺ and BMPR2 HSCs. c Significantly enriched GO terms of genes with switched HM status from bivalent to H3K4me3-only. d CUT&Tag signals of H3K4me3 and H3K27me3 across Nrf2, showing its switched HM status from bivalent to H3K4me3-only. e Fold changes in gene expression levels in BMPR2⁺ and BMPR2⁻ HSCs at D0 and D1 after 6.5 Gy of IR. n = 4 biological repeats per group. f Fold change in CellROX levels in BMPR2⁺ and BMPR2⁻ HSCs derived from Nrf2⁺/⁺ and Nrf2−/− mice at D1 after 6.5 Gy of IR. n = 4 biological repeats per group. g, h Percentage and number of BMPR2⁺ and BMPR2⁻ HSCs from Nrf2−/− mice at D0 and D1 after 6.5 Gy of IR. n = 8 mice per group. i Number of CFUs formed by BMPR2⁺ and BMPR2 HSCs from Nrf2−/− mice at D0 and D1 after 6.5 Gy of IR. n = 3 biological repeats per group. j Schematic diagram of the molecular mechanisms by which the BMP4-BMPR2-NRF2 pathway regulates the radiation resistance of BM HSCs. Data shown are mean ± SEM. Statistical analyses were conducted using two-way ANOVA with multiple comparisons by Tukey’s test (e, gi) and unpaired two-sided Student’s t test (f). Source data are provided as a Source Data file.

References

    1. Till, J. E. & McCULLOCH, E. A. A direct measurement of the radiation sensitivity of normal mouse bone marrow cells. Radiat. Res.14, 213–222 (1961). - PubMed
    1. Laurenti, E. & Göttgens, B. From haematopoietic stem cells to complex differentiation landscapes. Nature553, 418–426 (2018). - PMC - PubMed
    1. Kondo, M. et al. Biology of hematopoietic stem cells and progenitors: implications for clinical application. Annu. Rev. Immunol.21, 759–806 (2003). - PubMed
    1. Singh, S., Jakubison, B. & Keller, J. R. Protection of hematopoietic stem cells from stress-induced exhaustion and aging. Curr. Opin. Hematol.27, 225–231 (2020). - PubMed
    1. Shao, L., Luo, Y. & Zhou, D. Hematopoietic stem cell injury induced by ionizing radiation. Antioxid. Redox Signal.20, 1447–1462 (2014). - PMC - PubMed

MeSH terms

Substances