. 2025 Jul 1;16(1):5840.
doi: 10.1038/s41467-025-60308-0.

Reduction of neuronal activity mediated by blood-vessel regression in the adult brain

Affiliations

Reduction of neuronal activity mediated by blood-vessel regression in the adult brain

Xiaofei Gao et al. Nat Commun. .

Abstract

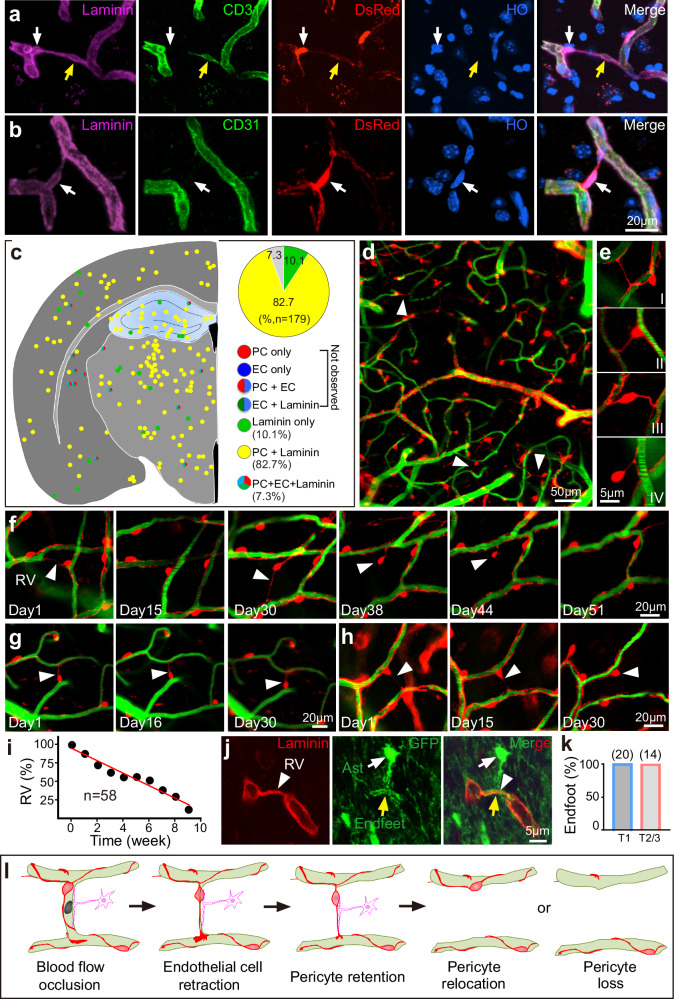
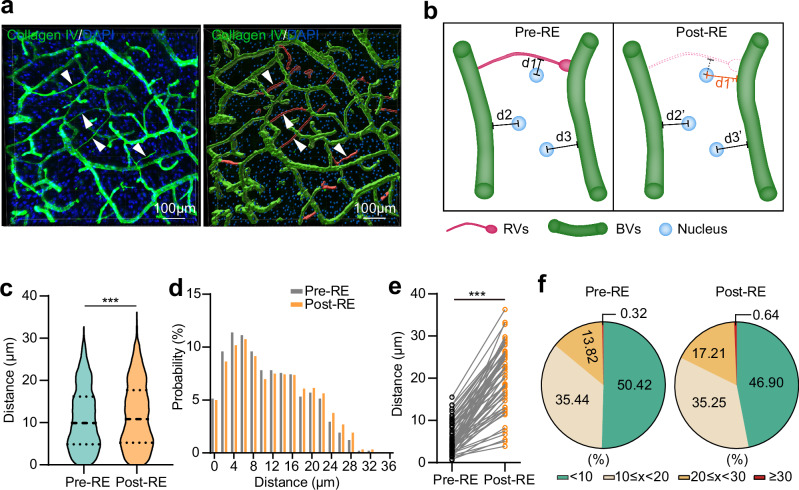
The brain vasculature supplies neurons with glucose and oxygen, but little is known about how vascular plasticity contributes to brain function. Using longitudinal in vivo imaging, we report that a substantial proportion of blood vessels in the adult mouse brain sporadically occlude and regress. Their regression proceeds through sequential stages of blood-flow occlusion, endothelial cell collapse, relocation or loss of pericytes, and retraction of glial endfeet. Regressing vessels are found to be widespread in mouse, monkey and human brains. We further reveal that blood vessel regression cause a reduction of neuronal activity due to a dysfunction in mitochondrial metabolism and glutamate production. Our results elucidate the mechanism of vessel regression and its role in neuronal function in the adult brain.


Conflict of interest statement

Competing interests: The authors declare no competing interests.

Figures

Fig. 1
Fig. 1. Alteration of the microcirculation in the adult mouse brain.
a Schematic showing injection of dextran-FITC into the bloodstream via the tail vein and live imaging of functional brain microcirculation through a cranial window. b Time-lapse imaging of the microcirculation of a cortical region in a mouse from its postnatal day (P)80 to P244. The same region was imaged once every week for 6 months. Two different vessels (white arrows and red arrowheads) became occluded, and blood flow was not restored after 102 and 137 days (i.e., which were 142 and 107 days after occlusion, respectively). Blood flow in one occluded blood vessel was restored (yellow arrows). From day 144, each image has a larger field than prior images. c One example of images of all occluded vessels in the field imaged. The lengths of these occluded vessels (white dashed lines, 1 to 4) were used to normalize all vessels in the field. The percentages of occluded blood vessels, which were normalized to all blood vessels in terms of length, are shown in the pie chart in the right panel. 5 wks, time-lapse imaging of the region shown in c over 5 weeks. d Blood-flow occlusion precedes vessel regression. DsRed, pericytes in the brain of NG2DsRedBAC transgenic mice; green, FITC-dextran signal in blood vessels. Arrows indicate a regressing blood vessel. e Summary of results for blood vessels with or without blood-flow restoration (i.e., reperfusion) within a week after detecting occlusion. n = 21: number of occluded blood vessels imaged.
Fig. 2
Fig. 2. Distribution and properties of regressing vessels in the adult brain of different mammals.
a Three typical types of regressive vessel structures in the adult mouse brain (T1, T2, T3). Blue, nuclei stained with Hoechst 33342; green, anti-laminin; arrowheads, regressing vessels. b Regressing vessels detected in the cortical section of a 3-year-old monkey. c Three types of representative regressing vessels from human brain tissues. d–f Distribution of all regressing vessels in whole-brain/hemisphere sections of mice at P100, P340, and P820. Each dot represents one regressive vessel. All vessels were labeled with anti-laminin or anti-collagen IV. Distribution of regressive vessels detected in three different brain regions of a 45-year-old human male: cerebral cortex (g), hippocampus (h), cerebellum (i). The location of the imaged section from the cerebellum is shown in the top right corner in i outlined in red. All vessels were labeled with anti-laminin. Slice thickness, 70 µm. j Schematic diagrams and percentages of three different types of regressive structures found in human and mouse brains (regressive vessels, n = 1019 from 7 mice; n = 652 from 1 male subject). Green, blood vessels; blue, soma. k Density of regressive vessels in the brain of a young adult (~P100, n = 4 mice) and old mouse (~P800, n = 4 mice). l Length distribution of regressing vessels from human and mouse brains. The x axis represents the length of regressing vessels. m Average length of regressing vessels in human (n = 132 regressive vessels from 1 male) and mouse brains (n = 365 regressive vessels from 7 mice). n Comparison of the density of regressing vessels from different mouse brain regions (n = 7 areas). HPC hippocampus, CTX cerebral cortex, TH thalamus, HY hypothalamus. *p < 0.05; **p < 0.01, ***p < 0.001, two-tailed unpaired t-test. All error bars indicate SEM.
Fig. 3
Fig. 3. Mechanism of blood-vessel regression in the brain.
a, b Cellular components of regressing vessels in the brain. Magenta, laminin layer stained with anti-laminin; green, endothelial cells labeled with anti-CD31; red, DsRed, pericytes in a NG2DsRedBAC mouse; blue, nuclei,Hoechst 33342 (HO). c Percentages of regressing blood vessels with different cell components: PC pericytes, EC endothelial cells, laminin, laminin layer. Inset, seven possible combinations of cell components (n = 179 regressive vessels). d, e In vivo imaging of regressing vessels in the brain of an adult NG2DsRedBAC mouse. Four types of regressing vessels were observed: I, the soma of the pericyte was located in a neighboring vessel; II, the soma of the pericyte was located at one end of the regressive vessel; III, the soma was located in the middle of the regressive vessels; IV, one end of the regressive vessel had detached from the neighboring blood vessel. dh Time-lapse imaging of the entire process of vessel regression and pericyte fate in regressing vessels. Three different fates of pericytes (arrowheads): cell death (f), retention at the same location (g), and relocation to a neighboring vessel (h). Blood flow was labeled with dextran-FITC-500K. Pericytes (red, DsRed) were labeled in NG2DsRedBAC mice. The examples in (f) and Fig. 1b were from the same field of a mouse. i Summary of lifespan for 58 regressing blood vessels that were imaged (n = 6 mice). j Astrocytic endfeet around regressing vessels. Green, GFP in astrocytes from hGFAP-GFP transgenic mice. Endfeet (yellow arrows) of astrocytes (Ast, white arrows) enwrapped the entire surface of regressing vessels (RV, white arrowheads), which were stained with anti-laminin (red). k Percentages of regressing vessels fully enwrapped by astrocytic endfeet. T1–3 indicate three distinct types of regressing vessels (T1, n = 20 blood vessels; T2/3, n = 14 blood vessels). l Our model of vessel regression in the adult brain. Vessel regression starts with blood-flow occlusion (dark region inside the vessel) in a certain percentage of blood vessels. Endothelial cells (light green) retract rapidly in response to occlusion. Pericytes (red) remain for a long period and form a typical regressive structure with a laminin layer. Pericytes in regressing blood vessels either relocate to neighboring blood vessels or die.
Fig. 4
Fig. 4. Morphology of pericytes in regressing vessels.
a An example image of a brain section of a Hprt-Cre::MADM mouse. Neurons and glial cells are labeled, and pericytes were sparsely labeled (arrows). b Morphology of a typical pericyte. c, d Gross morphology of an individual pericyte from a regressing vessel in the brain of a Hprt-Cre::MADM mouse. Arrows, regressing vessels. Asterisks indicate the somas of the pericyte in regressing vessels. The processes extending from pericytes on both blood vessels were very complex, indicating a stable structure. A neuron (white arrowhead) is close to the pericyte (with its nucleus, hollow arrowhead) in c. Purple, signal from anti-laminin; blue, nuclei labeled with DAPI; red, red fluorescence protein (RFP); green, GFP.
Fig. 5
Fig. 5. In vivo imaging of neuronal activity in Cdh5-CreER:Tak1fl/fl mice.
a Example images of blood vessels in brain sections from control (Ctrl) or Cdh5-CreER::Tak1fl/fl (Tak1 CKO) mice.White arrows, regressive blood vessels. b Statistical analysis of the density of regressive blood vessels in the brain of Tak1 CKO and control mice (Ctrl, n = 5 mice; CKO, n = 6 mice). ***p < 0.001, Student’s t-test,  error bars indicate SEM. c Strategy used to image neuronal activity in the brain of conscious mice. d GCaMP6 signal of neurons in layers II–IV of the cerebral cortex. AAV-CAMKII-GCaMP6m was injected ~1 month before imaging. I–IV, cortical layers. Example images of the GCaMP6 signal obtained from Tak1 CKO (e) and control mice (f) before and after administration of tamoxifen. Warm pseudocolor indicates a high calcium signal. Representative traces of calcium transients recorded from three neurons (arrows) of a Tak1 CKO mouse (g) and a control mouse (h) before and after a 1-week administration of tamoxifen. i Statistical analysis reveals the significance of differences of calcium transients in CKO mice as shown in (e) and (g). Each connected pair of black and red circles denotes data obtained with the same neuron before (black) and after (red) tamoxifen injection. Each of the two large circles denotes the mean ± SEM for the two groups. ***p < 0.001, paired Student’s t-test. j Frequency distribution of calcium transients from all neurons before (black) and after (red) tamoxifen was administered. Red Gaussian curve shows that the spike frequency was shifted to the left (i.e., lower value) after injection of tamoxifen into Tak1 CKO mice (n = 65 neurons from 5 mice). k No significant differences (n.s.) of calcium transients observed in control mice as shown in (f) and (h). Each connected pair of black and blue circles denotes data obtained with the same neuron before (black) and after (blue) tamoxifen injection. Each of the two large circles denotes the mean ± SEM for the two groups, two-tailed t-tests. l Frequency distribution of calcium transients from all neurons before (black) and after (blue) tamoxifen solution was administered. The Gaussian curve shows that the spike frequency was not shifted after injection of tamoxifen into control mice (Tak1fl/fl). n = 43 neurons from 5 mice.
Fig. 6
Fig. 6. Analysis of the distance between cells and their nearest blood vessels in the retinal vascular system.
a Simulated image (right) of cortex blood vessels (left). Blood vessels were stained with anti-Collagen IV, and cell nuclei were stained with DAPI. Reference images (left) were stacks of images from brain sections. b A schematic illustrating the strategy used to analyze the shortest distance between cells and blood vessels before (Pre-RE) and after (Post-RE) removing regressive vessels. c Distribution of the shortest distance from the nucleus to blood vessels (dn-v) before and after removing regressive vessels (Pre-RE and Post-RE, n = 1,563 cells from one mouse retina sample). d Probability distribution of dn-v before and after removing regressive vessels (Pre-RE and Post-RE). e Changes in dn-v distances before and after removing regressive vessels. The figure shows only the dn-v distribution with a ratio of dn-v (Post-RE)/dn-v (Pre-RE) greater than 1. f Percentage of cells grouped by dn-v distances (group 1: dn-v < 10 μm; group 2: 10 μm ≤dn-v < 20μm; group 3: 20≤dn-v < 30μm; group 4: dn-v ≥ 30μm) before and after removing regressive vessels. ***p <0.001, two-tailed paired t-test.
Fig. 7
Fig. 7. Analysis of the distance between cells and their nearest blood vessels in the brain with Tak1 deletion.
a Distribution of the shortest distance from cells to blood vessels (dn-v) in wild-type (WT, n = 2961 cells from one mouse brain slice) mice and two groups of Tak1 CKO mice: group 1 (Tak1AAV-BR1-CreAAV-BR1-Cre injected into Tak1fl/fl mouse, n = 1716 cells from one mouse brain slice) and group 2 (Tak1Slco1c1-CreER, Slco1c1-CreERKI::Tak1fl/fl, n = 1994 cells from one mouse brain slice). b Probability distribution of dn-v in the brain of WT and the two Tak1 CKO groups. Percentage of cells grouped by dn-v distances for WT (c), Tak1AAV-BR1-Cre (d), and Tak1Slco1c1-CreER (e). ***p<0.001, two-tailed unpaired t-test.
Fig. 8
Fig. 8. Abnormalities of neuronal metabolism in the brains of Tak1 CKO mice.
a The morphology of mitochondria in synapses from control and Tak1 CKO mice (Cdh5-CreER::Tak1fl/fl). SV, synaptic vesicles. MT, mitochondria. b Summarized results (mean ± SEM) of mitochondrial features in control and Tak1 CKO mice. Y-axis, the number of cristae was normalized to the surface of mitochondria. ***, p < 0.005, unpaired Student’s t-test. c Principal component analysis (PCA) of the metabolomes of control (Ctrl) and Tak1 CKO samples. d A heatmap representation of 20 metabolites (VIP score > 1, i.e., Variable Importance in Projection) in the cerebral cortex of five control (Ctrl) and five Tak1 CKO mouse brains. Color bar (bottom left) indicates the scale of standardized metabolite levels. Warm color indicates higher concentration. NAD+ Nicotinamide adenine dinucleotide; dAMP deoxyadenosine monophosphate; GSSG oxidized glutathione; GPC Glycerophosphocholine; R5P Ribose 5-phosphate (Ctrl group, n = 5 mice; CKO group, n = 5 mice). e, f Schematic illustrating all metabolites in the tricarboxylic acid cycle (TCA). Blue arrows indicate a decrease of these metabolites (highlighted in red) in Tak1 CKO mouse brains. Metabolites without arrows (black), no significant difference. Relative abundance (normalized by TIC of the control group) of the metabolites shown in e from control (light blue) and Tak1 CKO (magenta) samples. *, p < 0.05, **, p < 0.01, ***, p < 0.005; two-tailed unpaired Student’s t-test. FAD, flavin adenine dinucleotide. g Volcano plot representing significantly up- and down-regulated genes. Padj, adjusted p value. Ctrl (n = 4 mice) and Tak1 CKO (n = 4 mice). Up-regulated and down-regulated genes are highlighted in pink and light blue, respectively. Core genes in the “Glutamatergic Synapse” gene set are in bold; blue represents genes with significant differential expression, while brown represents genes with no significant difference, two-tailed t-tests. h Color scale heatmap showing the normalized expression of core genes of the Glutamatergic Synapse gene set, which is significantly down-regulated in the Tak1 CKO group vs Ctrl. i GSEA plots of Glutamatergic Synapse gene set, with black bars indicating gene sets represented among all genes pre-ranked by ranking metrics (Ctrl versus Tak1 CKO), with indicated normalized enrichment score (NES) and false discovery rate (FDR) q-value.

References

    1. Armulik, A., Genove, G. & Betsholtz, C. Pericytes: developmental, physiological, and pathological perspectives, problems, and promises. Dev. cell21, 193–215 (2011). - PubMed
    1. Zhang, Z. G. et al. Three-dimensional measurement of cerebral microvascular plasma perfusion, glial fibrillary acidic protein and microtubule associated protein-2 immunoreactivity after embolic stroke in rats: a double fluorescent labeled laser-scanning confocal microscopic study. Brain Res844, 55–66 (1999). - PubMed
    1. Bélanger, M., Allaman, I. & Magistretti, P. J. Brain energy metabolism: focus on astrocyte-neuron metabolic cooperation. Cell Metab 14, 724–738 (2011). - PubMed
    1. Barres, B. A. The mystery and magic of glia: a perspective on their roles in health and disease. Neuron60, 430–440 (2008). - PubMed
    1. Chen, B. R., Kozberg, M. G., Bouchard, M. B., Shaik, M. A. & Hillman, E. M. A critical role for the vascular endothelium in functional neurovascular coupling in the brain. J. Am. Heart Assoc.3, e000787 (2014). - PMC - PubMed

LinkOut - more resources