. 2025 Jul 1;16(1):5519.
doi: 10.1038/s41467-025-60556-0.

Cell-specific mechanisms drive connectivity across the time course of Huntington's disease

Affiliations

Cell-specific mechanisms drive connectivity across the time course of Huntington's disease

Carlos Estevez-Fraga et al. Nat Commun. .

Abstract

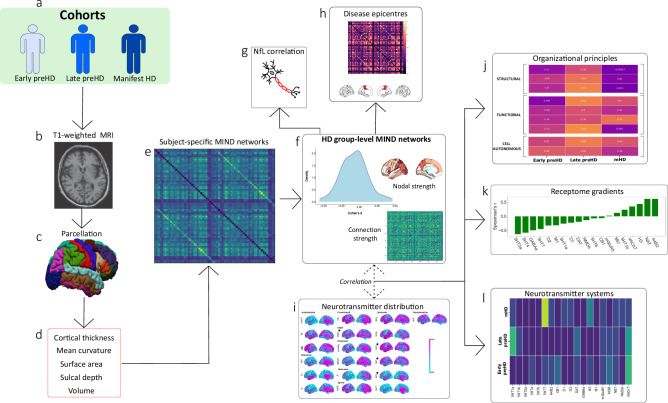
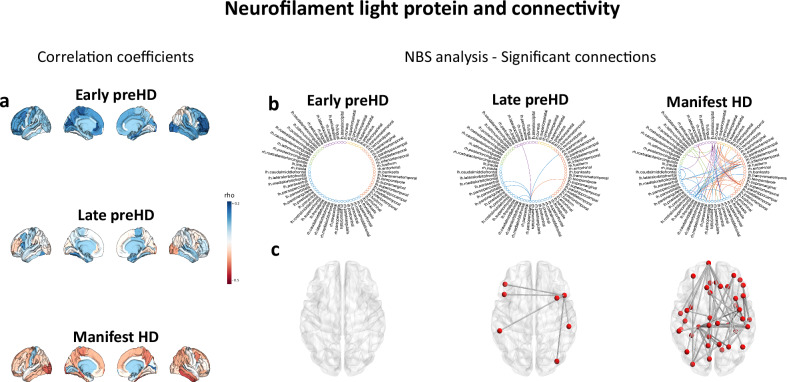
Hyperconnectivity in functional brain networks occurs decades before disease onset in Huntington's disease. However, the biological mechanisms remain unknown. We investigate connectivity in Huntington's disease using Morphometric INverse Divergence (MIND) in three Huntington's disease cohorts (N = 512) spanning from two decades before the onset of symptoms through to functional decline. Here, we identify stage-specific profiles, with hyperconnectivity 22 years from predicted motor onset, progressing to hypoconnectivity through the late premanifest and manifest stages, showing that hypoconnectivity is correlated with neurofilament light concentrations. To understand the biological mechanisms, we investigate associations with cortical organization principles including disease epicentres and cell-autonomous systems, in particular neurotransmitter distribution. The contribution from disease epicentres is limited to late premanifest while cell-autonomous associations are demonstrated across the Huntington's disease lifespan. Specific relationships to cholinergic and serotoninergic systems localized to granular and infragranular cortical layers are identified, consistent with serotoninergic layer 5a neuronal vulnerability previously identified in post-mortem brains.


Conflict of interest statement

Competing interests: The authors declare no competing interests.

Figures

Fig. 1
Fig. 1. Summary of analysis pipeline and main results.
Data from three cohorts (a) were used in this study: HD-YAS (57 early preHD, 60 controls), TrackOn-HD (85 late preHD, 89 controls) and Track-HD (110 manifest HD and 111 controls). Structural T1-weighted brain MRI scans (b) were parcellated using the 68 cortical region Desikan-Killiany atlas with FreeSurfer’s version 7 recon-all command (c). Cortical thickness, mean curvature, surface area, sulcal depth and gray matter volume were obtained (d) to compute subject-specific MIND networks. A linear mixed model was applied to each cohort obtaining z-scored effect sizes (Cohen’s d) in patient populations versus healthy controls for nodal strength and connection strengths across MIND cortical similarity matrices (e). There was hyperconnectivity in HD participants two decades before motor onset, progressing to hypoconnectivity during later stages (f), the latter being associated with neuroaxonal damage (g). Healthy structural and functional connectomes were spatially correlated with nodal strength to investigate the presence of disease epicentres (h). The distribution of neurotransmitter receptors and transporters was computed using PET data from more than 1200 healthy individuals using data from Hansen et al. (2022) (i). The relative contribution of additional structural, functional and cell-autonomous organizational principles was explored (j), finding that cell-autonomous gene expression and neurotransmitter distribution are major mechanisms contributing to nodal strength. Receptome analysis (k) showed that the first component of the distribution of neurotransmitter systems was associated with nodal strength. Finally, a neurotransmitter receptor analysis was performed disclosing a predominant association between the distribution of cholinergic and serotoninergic systems with nodal strength (l). The association with neurotransmitter systems was more prominent in granular and infragranular cortical layers. HD Huntington’s disease, MIND Morphometric Inverse Divergence, preHD premanifest HD.
Fig. 2
Fig. 2. MIND connectivity across the HD time course.
a Group-level cortical similarity matrices, each column and row represents a brain region of interest, termed a ‘node’ and each value in the matrix represents the ‘connection’ between two brain regions. The node strength represents the sum of all values for a given brain region, whereas the connection strength represents the magnitude of the connection between two brain regions. b Nodal strength for the differences between pwHD and controls across ROIs. In early preHD there are increases in connectivity predominantly occipital and frontal areas while in late preHD these differences attenuate. Finally, in mHD participants there are clear decreases in connectivity affecting also occipital and frontal areas. c Density plots representing the differences between pwHD and controls. Positive values in early preHD indicate increases in connectivity in pwHD compared with controls. These differences are predominantly negative in late preHD although most observations are around the null value. Finally, mHD participants have evident decreases in connectivity compared to controls. d Violin plots depicting ROIs showing significant differences at the uncorrected level in early preHD and late preHD. In mHD, for visualization purposes, only the top five ROIs with larger effect sizes were shown, all of them significant following non-parametric permutation two-tailed tests, FDR correction at a P < 0.05. e Circular graphs depicting significant networks (network-based statistics, non-parametric permutation two-tailed t-tests FDR correction at a P < 0.05) in early preHD (early preHD > controls), late preHD (no significant results) and mHD (mHD < controls), five connections in the occipital lobe were significantly higher in mHD compared to controls and are represented in Fig. S3. f Axial view showing significant connections, (network-based statistics, non-parametric permutation two-tailed t-tests FDR correction at a P < 0.05) spheres indicate brain regions; lines indicate connections significantly different from controls. Source data are provided as a Source Data file. FDR false discovery rate, HD Huntington’s disease, HDGEC Huntington’s disease gene expansion carrier, mHD manifest Huntington’s disease, MIND morphometric inverse divergence, NBS network-based statistic, pwHD people with Huntington’s disease, preHD premanifest Huntington’s disease, ROI region of interest.
Fig. 3
Fig. 3. MIND connectivity and plasma NfL correlations.
a There are positive correlations between plasma NfL and nodal strength in early preHD. During late preHD stages the direction of the correlation coefficients starts to change being again clearly negative in mHD stages. b Circular graphs showing significant associations (network-based statistics, non-parametric permutation two-tailed tests FDR correction at a P < 0.05)between connectivity and plasma NfL in early HD (no significant results), late preHD, and mHD. c Axial view showing significant connections (network-based statistics, non-parametric permutation two-tailed t-tests FDR correction at a P < 0.05), spheres indicate brain regions; lines indicate connections significantly correlated with plasma NfL. Source data are provided as a Source Data file. HD Huntington’s disease, mHD manifest Huntington’s disease, MIND morphometric inverse divergence, NfL neurofilament light protein, NBS network-based statistics, preHD premanifest Huntington’s disease, ROI region of interest.
Fig. 4
Fig. 4. Disease epicentre mapping.
Cortico-cortical functional (a) and structural (c) connectivity matrices in healthy controls. The colored areas in the brain surfaces depict regions (epicentres) whose connectivity profiles are significantly correlated with MIND nodal strength in each HD cohort. Only the paracentral and posterior cingulate gyri in late preHD were disease epicentres in the structural connectivity analysis (non-parametric spin permutation test, two-tailed, FDR correction at a P < 0.05, DF = 66). In (b, d) the matrices represent the subcortico-cortical functional (b) and structural (d) connectivity profiles, not being significantly associated with connectivity. Statistical significance was assessed through FDR-corrected spin permutation tests. Source data are provided as a Source Data file. DF degrees if freedom, HD Huntington’s disease, FDR false discovery rate, MIND morphometric inverse divergence, preHD premanifest Huntington’s disease.
Fig. 5
Fig. 5. Contributions of different organizational principles to MIND nodal strength.
Brain region by brain region matrices were constructed for each organizational principle using data from healthy controls. These were spatially correlated with nodal strength representing the differences in connectivity across the same regions between pwHD and controls (Cohen’s d) in each cohort. Values and colors (yellow: higher, violet: lower) in each cell represent Spearman correlation coefficients. Statistical significance was assessed through non-parametric FDR-corrected spin permutation tests, two-tailed, DF = 66. Light blue asterisks indicate statistically significant results (Pspin < 0.05). Source data are provided as a Source Data file. DF degrees of freedom, FDG-PET [F18]-fluorodeoxyglucose positron emission tomography, FDR false discovery rate, MEG magnetoencephalography, MIND Morphometric Inverse Divergence, pwHD people with Huntington’s disease, preHD premanifest Huntington’s disease, rsfMRI resting-state functional MRI.
Fig. 6
Fig. 6. Receptome gradients and MIND cortical similarity networks.
Neurotransmitter fingerprints were obtained using PET data from >1200 healthy controls to derive gradients of receptome organization. In (a) the proportion of variance explained by the different components following gradient decomposition is represented. Top panels in (bd)show the Spearman rank correlations of cortical receptome gradients with individual neurotransmitter densities in healthy controls. The spatial distribution of these gradients is represented across ROIs in the bottom (bd). The bar plots in the right side of (bd) depict the Spearman rank correlations of receptome gradients with HD-specific node strength each cohort. The first gradient showed a strong significant correlation with connectivity particularly in late preHD and early preHD. Statistical significance was assessed through FDR-corrected spin permutation tests, two-tailed, DF = 98. Asterisks indicate significant results (Pspin < 0.05). Source data are provided as a Source Data file. DF degrees of freedom, FDR false discovery rate, HD Huntington’s disease, mHD manifest Huntington’s disease, preHD premanifest Huntington’s disease.
Fig. 7
Fig. 7. Global and layer-specific neurotransmitter distribution and nodal strength for cortical connectivity networks in Huntington’s disease.
A multilinear model was used to determine the association between the distribution of the different neurotransmitter systems and node strength across the lifespan of HD. a illustrates how neurotransmitter system distributions map onto nodal strength across the different HD cohorts (total R2adj). Only significant results (*) assessed through FDR-corrected spin permutation tests, one-sided, N = 68 regions are represented in a, b (PET) and c, d (autoradiography). The dominance analysis in (b) distributes the fit of the model across each input variables showing the relative contribution of each variable. In (c), the total R2adj for layer-specific autoradiography results for nodal strength in early preHD are depicted, while (d), shows the relative contribution of each neurotransmitter system. Remaining autoradiography analyses were not statistically significant in any cohort. Source data are provided as a Source Data file. FDR false discovery rate, HD Huntington’s disease, mHD manifest Huntington’s disease, MIND morphometric inverse divergence, preHD premanifest Huntington’s disease. *Pspin < 0.05; PET positron emission tomography.

References

    1. McColgan, P. & Tabrizi, S. J. Huntington’s disease: a clinical review. Eur. J. Neurol.25, 24–34 (2018). - PubMed
    1. Vonsattel, J. P. et al. Neuropathological classification of Huntington’s disease. J. Neuropathol. Exp. Neurol.44, 559–577 (1985). - PubMed
    1. Johnson, E. B. et al. Dynamics of cortical degeneration over a decade in Huntington’s disease. Biol. Psychiatry89, 807–816 (2021). - PMC - PubMed
    1. Tabrizi, S. J. et al. Biological and clinical manifestations of Huntington’s disease in the longitudinal TRACK-HD study: cross-sectional analysis of baseline data. Lancet Neurol.8, 791–801 (2009). - PMC - PubMed
    1. Tereshchenko, A. V. et al. Abnormal development of cerebellar-striatal circuitry in Huntington disease. Neurology94, e1908–e1915 (2020). - PMC - PubMed

MeSH terms

Substances

LinkOut - more resources