. 2025 Jul 1;16(1):5461.
doi: 10.1038/s41467-025-60643-2.

Positional BMP signaling orchestrates villus length in the small intestine

Affiliations

Positional BMP signaling orchestrates villus length in the small intestine

Xu Wang et al. Nat Commun. .

Abstract

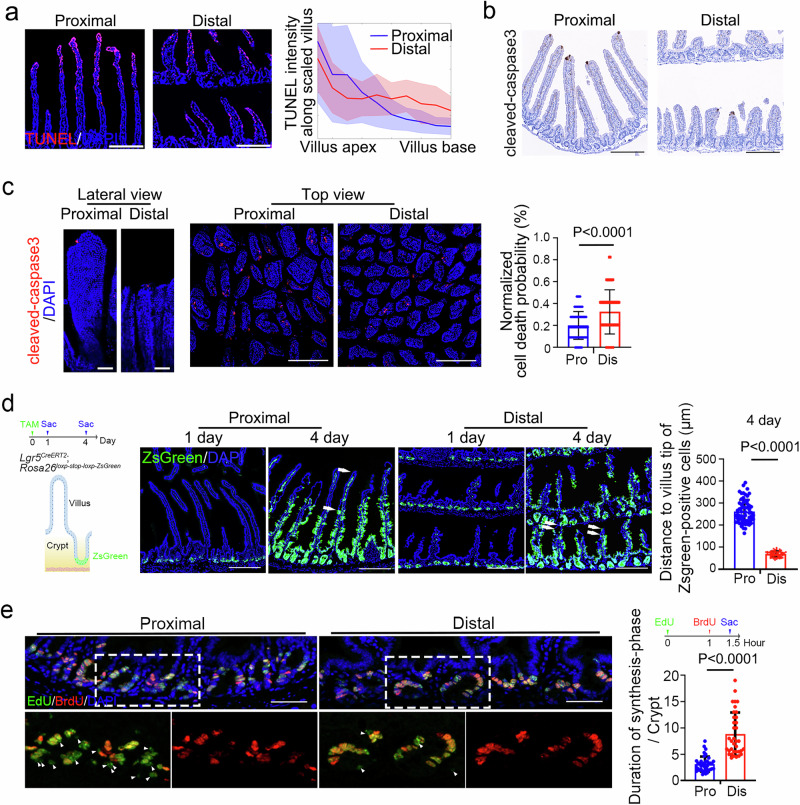
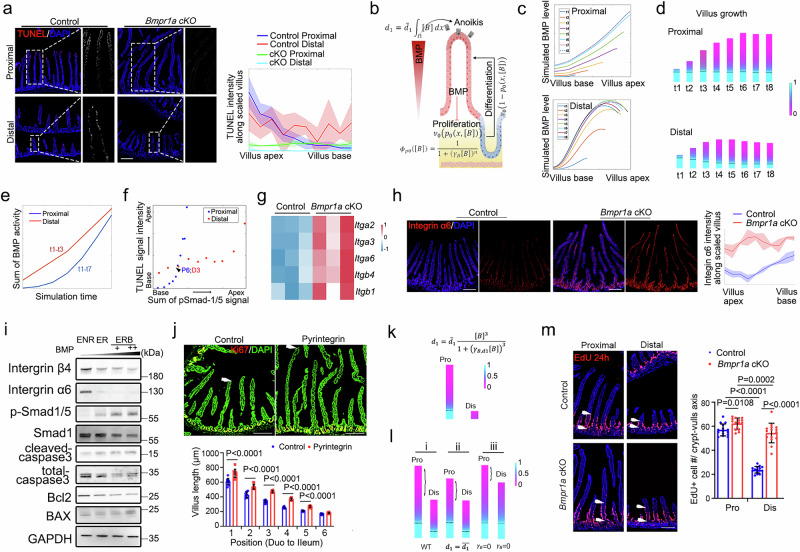
The intestinal epithelium undergoes fast turnover, and the villus length in the small intestine gradually decreases from the duodenum to the ileum. However, the underlying mechanisms remain poorly understood. In this study, we investigate the regulatory mechanism underlying the regional disparity of villus length. A progressive strengthening of BMP signaling from the duodenum to the jejunum and ileum establishes a signaling gradient, resulting in differences in the rates of cell proliferation and apoptosis. We show that BMP signaling regulates the survival of the small intestine epithelial cells by inhibiting integrin expression and thereby inducing cell apoptosis. Combined with mathematical modeling, our data reveal that BMP signaling provides positional cues and antagonizes Wnt signaling to control villus growth, while Wnt signaling promotes BMP signaling to counteract excessive proliferation, thus maintaining villus length. Our findings provide insights into the signaling dynamics governing epithelial turnover and villus length in the small intestine.


Conflict of interest statement

Competing interests: The authors declare no competing interests.

Figures

Fig. 1
Fig. 1. Regional disparity in the proliferation and apoptosis of the small intestine.
a Cell death in the proximal and distal small intestinal segments of wild-type mice revealed by TUNEL assay. TUNEL signal intensity was quantified along the villus epithelium in ten bins per segment, with error bars representing the standard deviation (SD), visualized as shaded regions in the plots. N = 3 mice/group. Scale bars, 200 µm. b Cleaved-caspase 3 staining on paraffin-embedded section in the proximal and distal small intestine. N = 3 mice/group. Scale bars, 200 µm. c Cleaved-caspase 3 staining in whole mount proximal and distal small intestine. Normalized cell death probability was calculated by dividing apoptotic cells (cleaved-caspase 3+) by total epithelial cells in each villus. Apoptotic cells (cleaved-caspase 3+) were counted from the top view, and total epithelial cells were counted from the side view of agarose sections. The average total count per villus was used for each intestinal segment. N = 3 mice/group. Scale bars, lateral view on the left: 50 µm, top view on the right: 200 µm. d Lineage tracing of Lgr5+ cells in the proximal and distal small intestine of Lgr5CreERT2; Rosa26loxp-stop-loxp-ZsGreen mice on day 1 and day 4. Measurement of length from the villus top end to the ZsGreen front on day 4, indicated by the distance between two arrowheads in one villus, is shown on the left panel. Arrowheads indicate two positions: the first marks the true villus tip, and the second marks the region where a cluster of migrating ZsGreen+ cells is located. Each individual data point represents one villus measurement. N = 3 mice/group. Scale bars, 200 µm (Created in BioRender. Liu (2025) https://BioRender.com/do3glyu). e Proliferation dynamics revealed by EdU/BrdU dual labeling. Representative images show EdU (green) and BrdU (red) labeling, with nuclei counterstained by DAPI (blue). High magnification images show EdU+ (green) and BrdU+ (red) cells in the epithelium. EdU+, BrdU cells (arrows) indicate cells exiting S-phase. The quantification was presented in the right panel. N = 4 mice. Scale bar: 50 µm. The data were analyzed by an unpaired t-test with Welch-correction (two-sided) (ce). Data represent mean ± SD.
Fig. 2
Fig. 2. Distinct signaling activity in different segments of the small intestine.
a Ki67 immunofluorescence staining in Axin2-mGFP knock-in mice across small intestine segments, showing grayscale and fluorescence intensity. Axin2 intensity was quantified from stem to TA cells within crypts, with error bars representing the standard deviation (SD), visualized as shaded regions in the plots. N = 3 mice/group. Scale bars, 50 μm. b p-Smad1/5 immunofluorescence staining showing BMP signaling intensity along the villus axis. Data is presented by absolute position (left) and relative position (right) for comparison with error bars representing the standard deviation (SD), visualized as shaded regions in the plots. N = 5 mice. Scale bars, 500 μm (left); 100 μm (zoomed-in images on the right). c Immunoblotting of p-Smad1/5, total Smad1, and β-actin from the villus region of the proximal and distal small intestine. N = 3 mice/group. d tdTomato signals in 4xBRE-tdTomato knock-in mice, with magnified views in insets. N = 3 mice/group. Scale bars, 100 μm. e Id1 expression detected by RNAscope, showing punctate signals of Id1 mRNA. Quantification is shown with mean values and standard error of the mean (SEM). N = 3 mice. Scale bar, 100 μm. f Expression of BMP-suppressed enterocyte genes in the proximal and distal small intestine. N = 3 mice/group. g Both BMP ligand and inhibitor undergo generation (B, I), diffusion (DB, DI), and degradation (decB, decI). The competitive binding of the inhibitor to the ligand impedes the interaction between the BMP ligand and receptor (R and decBR) (Created in BioRender. Liu (2025) https://BioRender.com/7ob2gem). h Spatial distribution of BMP ligand, receptor, and inhibitor from villus apex to stroma, with BMP distribution in the proximal and distal small intestine with the model solutions (smooth lines). i Scatter plots comparing BMP and inhibitor diffusion rates, with model solutions fitting p-Smad1/5 distribution. j Grem1 protein distribution in the stromal cells and crypt region of the proximal small intestine, quantified in both regions. N = 3 mice/group. Scale bar: 50 µm. k BMP signaling intensity variation from proximal to distal regions (Created in BioRender. Liu (2025) https://BioRender.com/x1duy74). The data were analyzed by an unpaired t-test with Welch-correction (two-sided) (j). Data represent mean ± SD.
Fig. 3
Fig. 3. BMP signaling regulates villus length.
a Immunofluorescence staining of Ki67 in control and VillinCreERT2; Bmpr1aflox/flox (Bmpr1a cKO) mice at day 12 post-tamoxifen injection (dpi). Quantification of villus length and cell number from the proximal to the distal small intestine and Ki67+ cells in the jejunum. N = 3 mice/group. Scale bars, 200 µm. b Immunofluorescence staining of Ki67 in control and VillinCreERT2; Smad4flox/flox (Smad4 cKO) mice at 12 dpi. Quantification of villus length and cell number from the proximal to the distal small intestine, and Ki67+ cells in the jejunum. N = 3 mice/group. Scale bars, 200 µm. c Immunofluorescence staining of Ki67 in control and CaggCreERT2; Grem1flox/flox (Grem1 cKO) mice at 12 dpi. Quantification of villus length and cell number from the proximal to the distal small intestine, and Ki67+ cells in the jejunum. N = 3 mice/group. Scale bars, 200 µm. d Immunofluorescence staining of Ki67 and E-cadherin in control and Bmpr1a cKO mice at 42 dpi. Quantification of villus length from the proximal to the distal small intestine. N = 3 mice/group. Scale bars, 500 µm. In (ac) the white arrows indicate the apex of the villus, and the original blue color of DAPI staining in microscopy images has been adjusted to green for better visualization. This adjustment applies uniformly across the entire image. Quantification of villus length and cell number was analyzed by two-way ANOVA with Tukey’s multiple comparison test; Quantification of Ki67+ cells was analyzed by unpaired t-test (two-sided). Data represent mean ± SD.
Fig. 4
Fig. 4. BMP signaling promotes anoikis by suppressing integrin expression.
a TUNEL assay (control and Bmpr1a cKO mice) with grayscale enlargements. TUNEL+ cells quantified across intestinal regions (Villus lengths-scaled) with error bars representing the standard deviation (SD), visualized as shaded regions in the plots. N = 3 mice/group. Scale bars, 200 µm. b Two-stage cell lineage model: progenitor cell proliferation and differentiation leading to cell death (d_1) controlled by BMP activity (Created in BioRender. Liu (2025) https://BioRender.com/jyzljkj). c Computational modeling shows that BMP signaling progressively amplifies during villus elongation (t1–t8). Distal segments, which exhibit lower expression and diffusion rate of Grem1, develop earlier and stronger BMP peaks compared to proximal regions. d Simulated villus growth (proximal/distal) with progenitor cell proportions. The dashed line marks the crypt-villus boundary. e Model prediction of BMP signaling activity in the apical cells of the villi upon reaching a state of equilibrium in villus growth. f p-Smad1/5 and TUNEL intensity profiles along villus (proximal P6 vs distal D3 positions). P6, 6th position from a base in the proximal segment. D3, 3rd position from base in the distal segment. g Integrin gene heatmap (control vs cKO). N = 3 mice/group. h Immunofluorescence staining and quantification of integrin α6 with error bars representing the standard deviation (SD), visualized as shaded regions in the plots. N = 3 mice/group. Scale bars, 200 µm. i Organoid immunoblots (48 h treatments: E [EGF], N [Noggin], R [R-spondin], B [BMP 6.7/20 ng/mL]). N = 3 cultures. N = 3 independent organoid cultures. j Ki67 staining and villus length quantification in control and Pyrintegrin-injected mice. N = 3 mice/group. Scale bars, 200 µm. The white arrows indicated the apex of the villus. k Villus growth prediction under the threshold mechanism, modifying the differentiated cell removal rate (d_1) using a Hill equation. l Villus length modeling under different conditions (WT, constant d_1, γ_B = 0) of the model shown in Fig. 4b. m EdU+ cells 24 h after injection. N = 3 mice/group. Scale bars, 200 µm. The data were analyzed by two-way ANOVA with Tukey’s multiple comparison test (i) and unpaired t-test with Welch-correction (two-sided) (m). Data represent mean ± SD.
Fig. 5
Fig. 5. BMP signaling provides positional cues and generates negative feedback on Wnt signaling.
a Immunofluorescence staining of Ki67 at 0 h, 24 h, 48 h, and 72 h after poly(I:C) injection (hpi). N = 3 mice/group. Scale bars, 100 µm. The expression regions of Ki67 were indicated by arrowheads (Created in BioRender. Liu (2025) https://BioRender.com/mycsfrf). b GFP fluorescence imaging of Axin2-mGFP in control and Bmpr1a cKO mice in the proximal segment (left). The images showed fluorescence intensity of Axin2-mGFP, highlighting the Wnt-responsive protein expression (middle). Quantification of Axin2 intensity was performed from the stem cell zone to the transit-amplifying (TA) zone within crypts for both Bmpr1a cKO and control mice (right). N = 3 mice/group. Scale bars, 50 µm. c RT-qPCR of Sox9, Cd44, Id1, Id2, and Bmpr1a in control and Bmpr1a cKO organoids cultured in ENR and ERB medium for 24 h. E, EGF, 50 ng/mL; N, Noggin, 100 ng/mL; R, R-spondin, 500 ng/mL; B, BMP, 20 ng/mL. N = 3 independent experiments. d A schematic diagram of a two-stage cell lineage model regulated by Wnt and BMP signaling. Wnt signaling promotes proliferation of progenitor cells (p0), while BMP signaling suppresses cell proliferation and Wnt activity (Created in BioRender. Liu (2025) https://BioRender.com/2tio9zc). e Mathematical model of villus growth with corresponding spatial distribution of Wnt and BMP activity in the distal small intestine. t1 through t6 are characterized by identical temporal intervals. The colormap axis represents the proportion of progenitor cells ranging from 0 to 1 along the crypt-villus axis. The dashed line demarcates the boundary between the crypt and the villus. f Immunofluorescence staining of p-Smad1/5 and p-Smad3 at 0 h, 24 h, 48 h, and 72 h after poly(I:C) injection. N = 3 mice/group. Scale bars, 100 µm. g Immunofluorescence staining of Ki67 from the duodenum to the ileum of control and Bmpr1a cKO mice at 48 h after poly(I:C) injection. The white arrows indicate the corresponding position of the duodenum and the ileum. N = 3 mice/group. Scale bars, 500 μm. The original blue color of DAPI staining in microscopy images has been adjusted to green for better visualization (a, g). This adjustment applies uniformly across the entire image. The data were analyzed by an unpaired t-test with Welch-correction (two-sided) (b). Data represent mean ± SD.
Fig. 6
Fig. 6. Positive feedback of Wnt signaling on BMP signaling contributes to the villus length control.
a Immunofluorescence staining of Ki67 in VillinCreERT2; Apcflox/+mice at 16 dpi. Quantification of the villus length and epithelial cell number from the proximal to the distal small intestine and Ki67+ cells in the jejunum. N = 3 mice/group. Scale bars, 200 µm. The white arrows indicate the apex or the base of the villus. b RT-qPCR of Axin2, Ki67, Bmp2, Bmpr1a, Pmp22, and Slc34a2 in intestinal organoids derived from control and Apc heterozygous (hez) mice. N = 3 independent experiments. c RT-qPCR of Axin2, Ki67, Id1, and Id2 in intestinal organoids cultured in E and ER medium. E, EGF; R, R-spondin,. N = 3 independent experiments. d Immunofluorescence staining and quantification of p-Smad1/5 in the proximal region of the small intestine between control and Apc hez mice, with error bars representing the standard deviation (SD), visualized as shaded regions in the plots. N = 3 mice/group. Scale bars, 200 µm. e A schematic diagram of a two-stage cell lineage model regulated by Wnt and BMP signaling, modeled using the Hill equation. Wnt signaling exhibits a feedback regulation on BMP signaling. Conversely, BMP signaling inhibits Wnt signaling (Created in BioRender. Liu (2025) https://BioRender.com/2tio9zc). f The mathematical model shows BMP activity, cell removal rate, and villus length under three conditions: (i) normal; (ii) Wnt activation without BMP regulation (γ_1 = 0); (iii) Wnt activation with BMP regulation (γ_1). The colormap represents progenitor cell proportion along the crypt-villus axis, with a dashed line marking the crypt-villus boundary. g Immunofluorescence staining of Ki67 in the proximal small intestine of the indicated mice. Mice were injected with tamoxifen for five days and then sacrificed 2 days later. N = 3 mice/group. Scale bars, 200 µm. The white arrows indicate the apex of the villus. For a, villus length and cell number were analyzed by two-way ANOVA with Tukey’s multiple comparison test; Ki67+ cells were analyzed by unpaired t-test with Welch-correction (two-sided). b, c Analyzed by unpaired t-test with Welch-correction (two-sided); g was analyzed by one-way ANOVA with Tukey’s multiple comparison test. Data represent mean ± SD.
Fig. 7
Fig. 7. The interaction between BMP and Wnt signaling establishes the different epithelial turnover rates and villus length in the proximal and distal small intestine.
BMP signaling exhibits a spatial gradient from the proximal duodenum to the distal ileum. As BMP signaling increases from the proximal to distal segment, Wnt signaling activity remains relatively constant. BMP signaling inhibits cell proliferation, promotes epithelial cell apoptosis by inhibiting integrin expression, and suppresses Wnt signaling. This gradient of BMP signaling correlates with the gradual reduction in villus length from the proximal to distal small intestine. Along the crypt-villus axis, increased BMP signaling coupled with its negative feedback on Wnt signaling attenuates cell proliferation as villi reach a certain length. Furthermore, the positive feedback of Wnt signaling on BMP signaling prevents excessive proliferation to maintain stable villus length (Created in BioRender. Liu (2025) https://BioRender.com/u0fu7hg).

References

    1. Barker, N. et al. Identification of stem cells in small intestine and colon by marker gene Lgr5. Nature449, 1003–1007 (2007). - PubMed
    1. Sato, T. & Clevers, H. Growing self-organizing mini-guts from a single intestinal stem cell: mechanism and applications. Science340, 1190–1194 (2013). - PubMed
    1. Reddien, P. W. The purpose and ubiquity of turnover. Cell187, 2657–2681 (2024). - PubMed
    1. Gehart, H. & Clevers, H. Tales from the crypt: new insights into intestinal stem cells. Nat. Rev. Gastroenterol. Hepatol.16, 19–34 (2019). - PubMed
    1. Taylor, S. R. et al. Dietary fructose improves intestinal cell survival and nutrient absorption. Nature597, 263–267 (2021). - PMC - PubMed

LinkOut - more resources