. 2025 Jul 1;16(1):472.
doi: 10.1038/s41419-025-07783-x.

TNF-α modulates cell proliferation via SOX4/TGF-β/Smad signaling in benign prostatic hyperplasia

Affiliations

TNF-α modulates cell proliferation via SOX4/TGF-β/Smad signaling in benign prostatic hyperplasia

Jinze Li et al. Cell Death Dis. .

Abstract

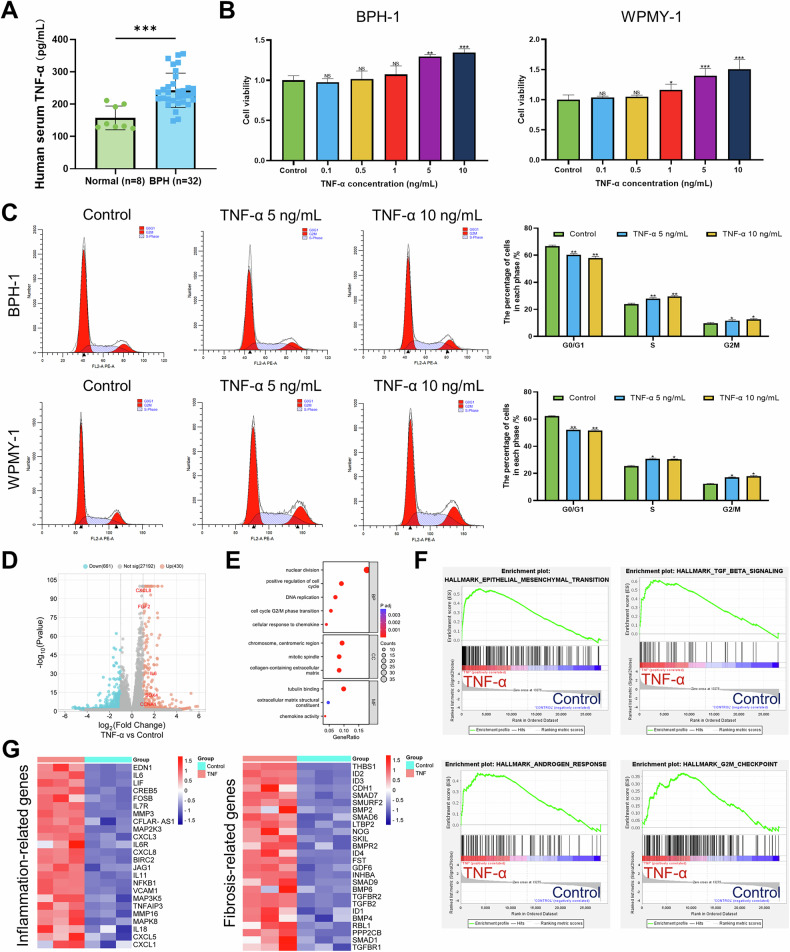
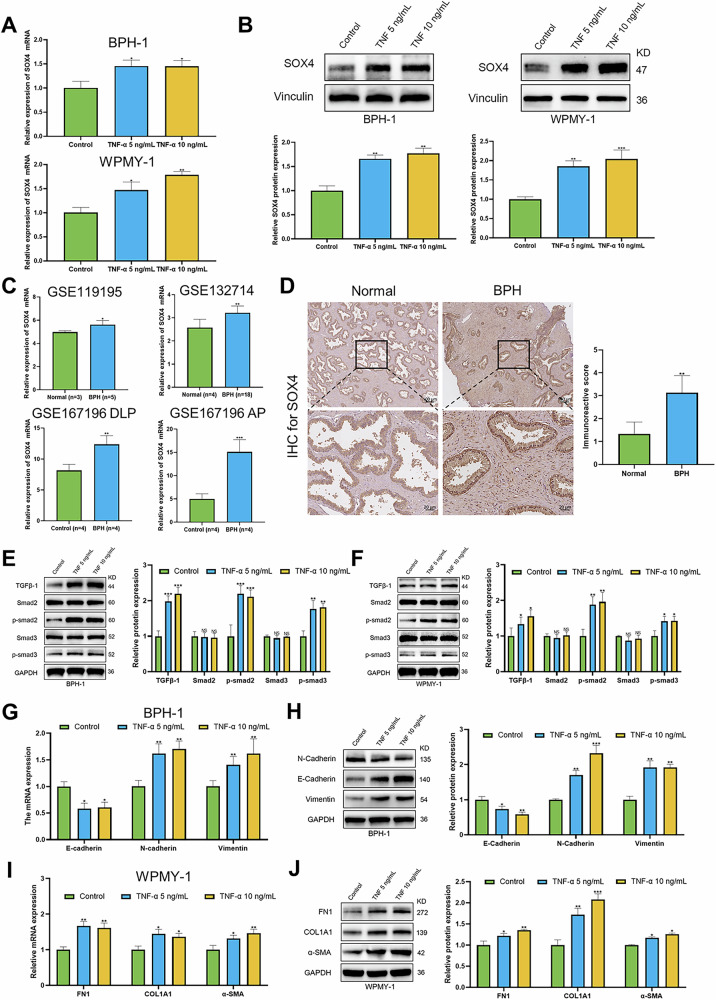
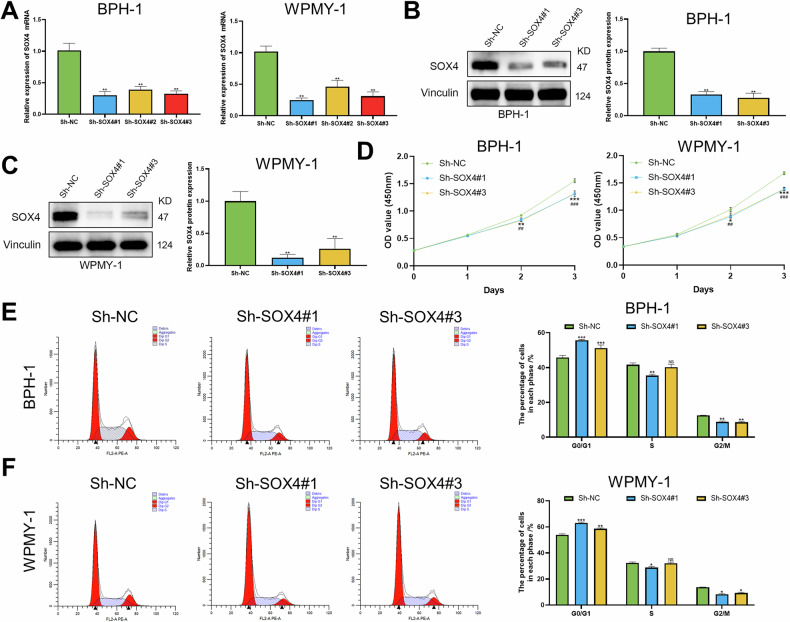
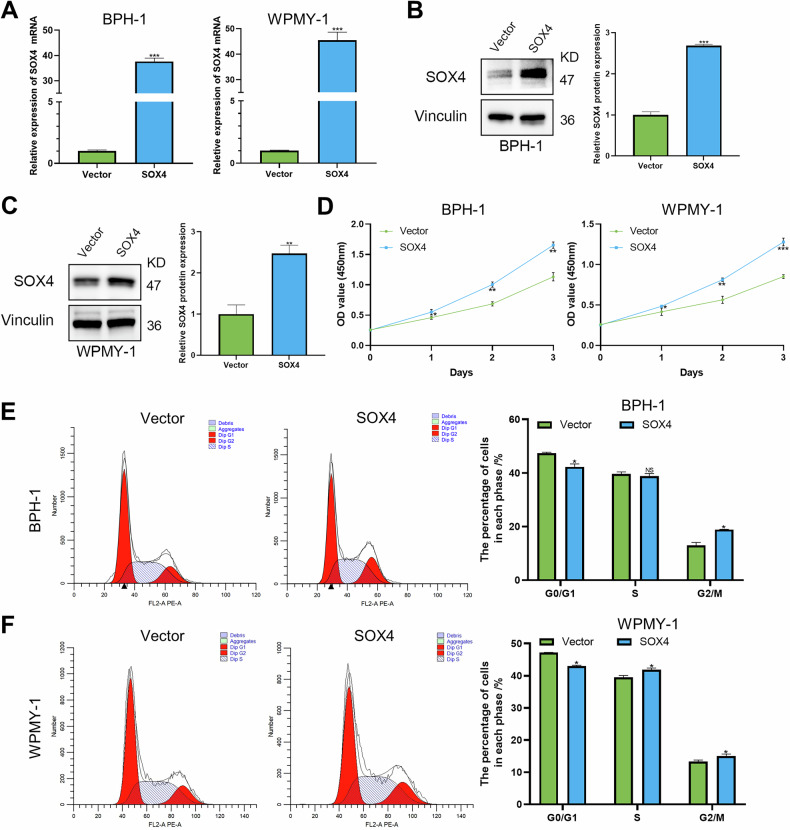
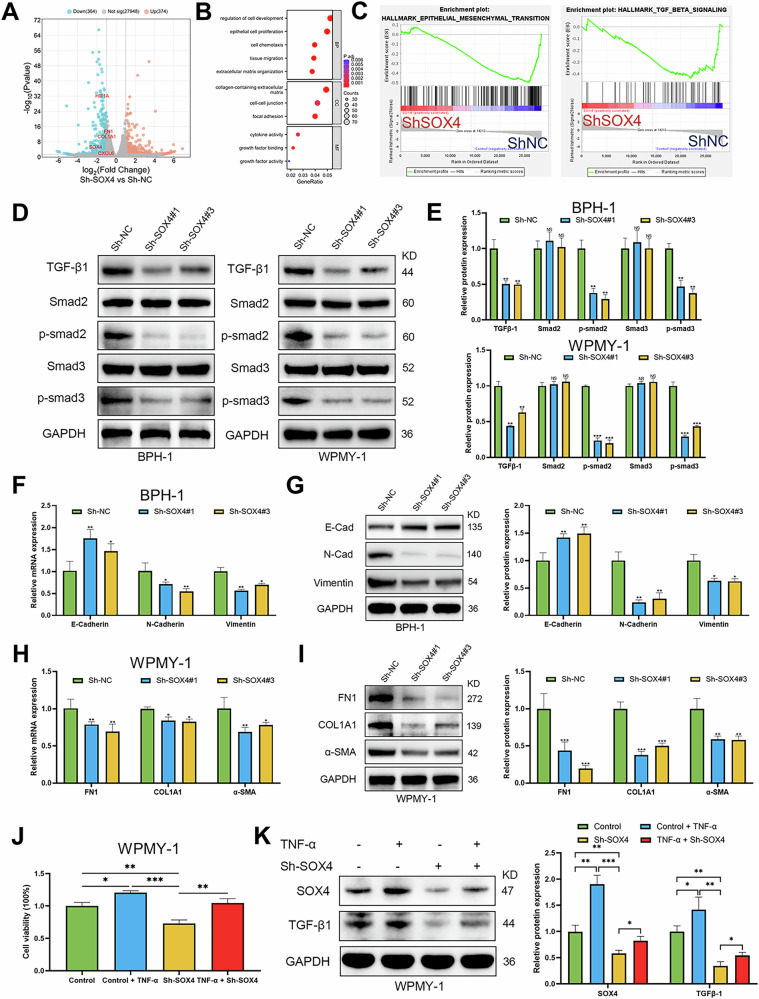
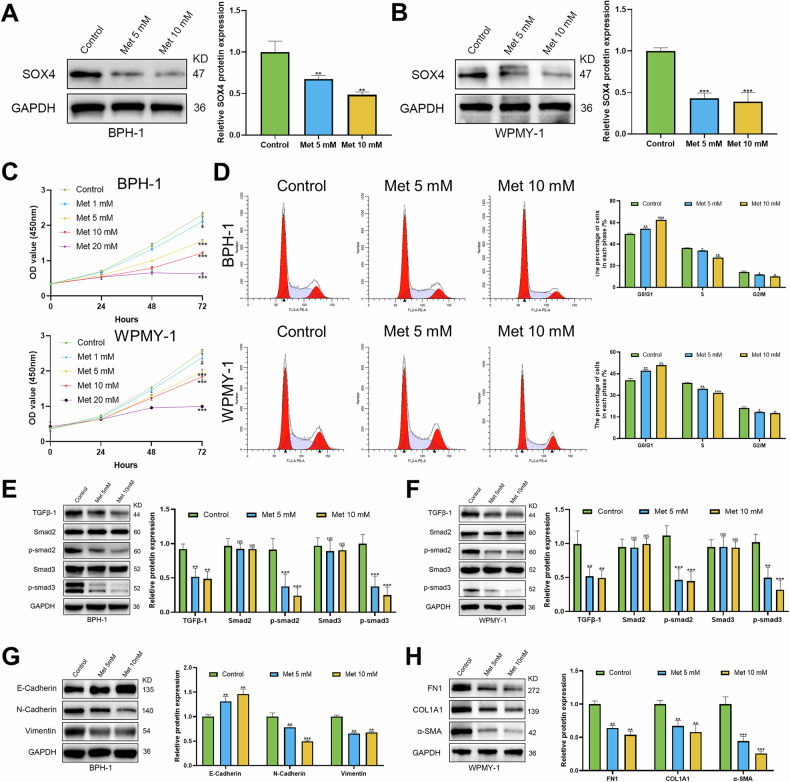
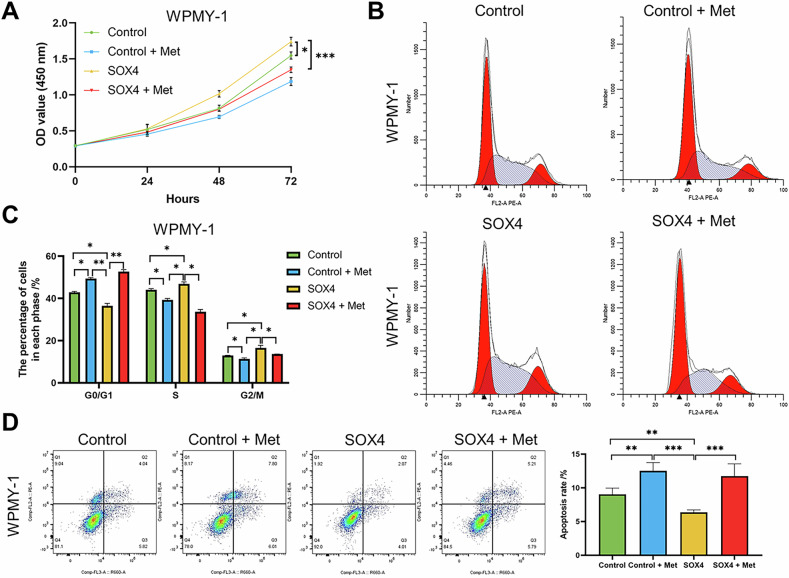
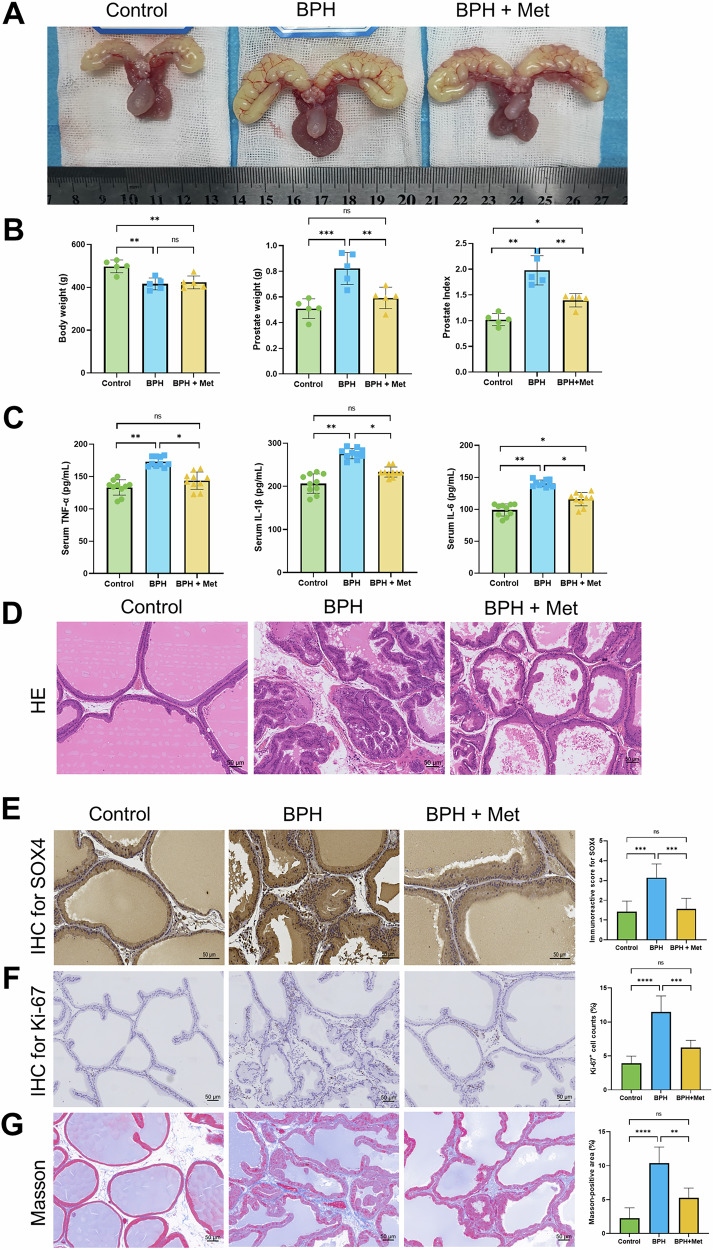
Benign prostatic hyperplasia (BPH) is an age-related condition in men with a poorly defined etiology. Chronic inflammation is increasingly recognized as a key contributor to BPH progression; however, the underlying mechanisms remain incompletely understood. This study aimed to elucidate the role of a TNF-α-induced inflammatory microenvironment in regulating BPH progression. We demonstrated that TNF-α levels were significantly elevated in patients with BPH and positively correlated with key clinical characteristics. In vitro, TNF-α promoted the proliferation of prostatic cells. Mechanistically, TNF-α induced the overexpression of SOX4, which subsequently activated the TGF-β/Smad2/3 signaling axis, thereby enhancing cellular proliferation, promoting epithelial-mesenchymal transition (EMT), and exacerbating fibrosis. Importantly, metformin (Met) treatment reduced the expression levels of relevant inflammatory cytokines in the serum of BPH rats. Further analysis confirmed that Met inhibited the TGF-β/Smad2/3 signaling pathway by downregulating the expression of SOX4, thus suppressing cell proliferation, reversing EMT, alleviating fibrosis, and ultimately exerting anti-BPH effects. Collectively, our findings suggest that TNF-α promotes BPH progression via activation of the SOX4/TGF-β/Smad2/3 axis, while Met exerts therapeutic effects by targeting this pathway. These results highlight SOX4 as a potential therapeutic target for BPH and support the clinical potential of Met in BPH management.


Conflict of interest statement

Competing interests: The authors declare no competing interests.

Figures

Fig. 1
Fig. 1. TNF-α is upregulated in human BPH and promotes the proliferation of BPH-1 and WPMY-1 cells.
A TNF-α is significantly upregulated in BPH patients’ serum. B BPH-1 and WPMY-1 cells were plated in 96-well plates (3 × 103 cells/well) overnight. Then, BPH-1 and WPMY-1 cells were treated with doses of TNF-α (0, 0.1, 0.5, 1, 5, and 10 ng/mL) for 3 days. Cells viability was determined by CCK-8 test. C BPH-1 and WPMY-1 cells were plated in 6-well plates (2 × 106 cells/well) overnight. Then, BPH-1 and WPMY-1 cells treated with TNF-α (0, 5, and 10 ng/mL) for 3 days, and harvested for cell cycle test via flow cytometry. D Valcano plot showing the differentiated expressed genes in WPMY-1 cells treated with TNF-α. E GO analysis showing pathways upregulated in WPMY-1 cells treated with TNF-α. F Enrichment plots of GSEA analyses for pathways in TNF-α group compared with control group. G Heatmap clustering the upregulated genes related to inflammation and fibrosis in WPMY-1 cells. Data are expressed as the means ± SEMs (*p < 0.05, **p < 0.01, ***p < 0.001, ns: not significant).
Fig. 2
Fig. 2. TNF-α induces SOX4 expression and activates the TGF-β/Smad signaling pathway and its downstream genes.
A RT-PCR was used to test the mRNA levels of SOX4 in WPMY-1 and BPH-1 cells treated with TNF-α. B WB was used to test the protein levels of SOX4 in WPMY-1 and BPH-1 cells treated with TNF-α. C GEO data showing SOX4 expression in BPH samples from GSE119195, GSE132714, and GSE167196. D Representative SOX4 IHC staining and quantification in normal and BPH prostate samples. E, F WB analysis of TGF-β/Smad signaling protein expression in BPH-1 and WPMY-1 cells treated with TNF-α (5 ng/mL and 10 ng/mL) for 3 days. G, H RT-PCR and WB analysis of the mRNA and protein expression of EMT markers in BPH-1 cells treated with TNF-α (5 ng/mL and 10 ng/mL) for 3 days. I, J RT-PCR and WB analysis of the mRNA and protein expression of fibrosis markers in WPMY-1 cells treated with TNF-α (5 and 10 ng/ml) for 3 days. Data are expressed as the means ± SEMs (*p < 0.05, **p < 0.01, ***p < 0.001, ns: not significant).
Fig. 3
Fig. 3. Effects of SOX4 knockdown on cell viability and cell cycle in BPH-1 and WPMY-1 cells.
AC RT-PCR and WB were used to confirm the SOX4 knockdown effect in BPH-1 and WPMY-1 cells infected with Sh-NC or Sh-SOX4 lentivirus for 3 days. D BPH-1 and WPMY-1 cells were plated in 96-well plates (3 × 103 cells/well) and infected with Sh-NC or Sh-SOX4 lentivirus for 0–3 days. Cell proliferation viability was determined by CCK-8 test. E, F Flow cytometry was used to test the cells cycle of BPH-1 and WPMY-1 cells infected with Sh-NC or Sh-SOX4 lentivirus for 3 days, retrospectively. Data are expressed as the means ± SEMs (*p < 0.05, **p < 0.01, ***p < 0.001, ns: not significant).
Fig. 4
Fig. 4. Overexpression of SOX4 regulates cell viability and cell cycle in BPH-1 and WPMY-1 Cells.
AC RT-PCR and WB were used to confirm the SOX4 overexpression effect in BPH-1 and WPMY-1 cells infected with vector or SOX4 lentivirus for 3 days. D BPH-1 and WPMY-1 cells were plated in 96-well plates (3 × 103 cells/well) and infected with vector or SOX4 lentivirus for 0–3 days. Cell proliferation viability was determined by CCK-8 test, respectively. E, F Flow cytometry was used to test the cells cycle of BPH-1 and WPMY-1 cells infected with vector or SOX4 lentivirus for 3 days. Data are expressed as the means ± SEMs (*p < 0.05, **p < 0.01, ***p < 0.001, ns not significant).
Fig. 5
Fig. 5. Knockdown of SOX4 regulates TGF-β/Smad signaling pathway and its downstream genes.
A Valcano plot showing the differentiated expressed genes in WPMY-1 cells knocking down SOX4. B GO analysis showing pathways down/up-regulated in WPMY-1 cells knocking down SOX4. C Enrichment plots of GSEA analyses for significant pathways in Sh-SOX4 group compared with Sh-NC group in WPMY-1 cells. D, E WB analysis of TGF-β/Smad pathway protein expression in BPH-1 and WPMY-1 cells infected with Sh-NC or Sh-SOX4 lentivirus for 3 days. F, G RT-PCR and WB analysis of EMT marker expression in BPH-1 cells infected with Sh-NC or Sh-SOX4 lentivirus for 3 days. H, I RT-PCR and WB analysis of fibrosis marker expression in WPMY-1 cells infected with Sh-NC or Sh-SOX4 lentivirus for 3 days. J WPMY-1 cells were plated in 96-well plates (3 × 103 cells/well) overnight. Then, WPMY-1 cells were pretreated with TNF-α and transfected with SOX4 lentivirus for 3 days. Cells viability was determined by CCK-8 test. K WB showing SOX4 and TGF-β1 protein expression in WPMY-1 cells treated with TNF-α and infected with Sh-SOX4 lentivirus for 3 days. Data are expressed as the means ± SEMs (*p < 0.05, **p < 0.01, ***p < 0.001, ns: not significant).
Fig. 6
Fig. 6. Met inhibits cell viability and cell cycle via the SOX4/TGF-β/Smad signaling axis in BPH-1 and WPMY-1 cells.
A, B WB analysis of SOX4 protein expression in BPH-1 and WPMY-1 cells treated with Met (0, 5, and 10 mM), retrospectively. C BPH-1 and WPMY-1 cells were plated in 96-well plates (3 × 103 cells/well) overnight. Then, BPH-1 and WPMY-1 cells were treated with doses of Met (0, 1, 5, 10, and 20 mM) for different time points (0, 24, 48, and 72 h). Cells viability was determined by CCK-8 test. D BPH-1 and WPMY-1 cells were plated in 6-well plates (2 × 105 cells/well) overnight. Then, BPH-1 and WPMY-1 cells treated with Met (0, 5, and 10 mM) for 3 days, and harvested for cell cycle test via flow cytometry. E, F WB analysis of TGF-β/Smad pathway protein expression in BPH-1 and WPMY-1 cells treated with Met (0, 5, and 10 mM) for 3 days. G WB analysis of EMT marker expression in BPH-1 cells treated with Met (0, 5, and 10 mM) for 3 days. H WB analysis of fibrosis marker expression in WPMY-1 cells treated with Met (0, 5, and 10 mM) for 3 days. Data are expressed as the means ± SEMs (*p < 0.05, **p < 0.01, ***p < 0.001, ns: not significant).
Fig. 7
Fig. 7. Overexpression of SOX4 partially reverses the effects of Met-induced inhibition of BPH cell proliferation and TGF-β/Smad signaling activation.
A WPMY-1 cells were plated in 96-well plates (3 × 103 cells/well) overnight. Then, WPMY-1 cells were treated with Vector, Vector combined with Met, overexpression SOX4, or overexpression SOX4 combined with Met. for different time points (0, 24, 48, and 72 h). Cells viability was determined by CCK-8 test. B, C WPMY-1 cells were plated in 6-well plates (2 × 105 cells/well) overnight. Then, WPMY-1 cells were treated with Vector, Vector combined with Met, overexpression SOX4, or overexpression SOX4 combined with Met for 3 days, and harvested for cell cycle test via flow cytometry. D WPMY-1 cells were plated in 6-well plates (2 × 105 cells/well) overnight. Then, WPMY-1 cells were treated with Vector, Vector combined with Met, overexpression SOX4, or overexpression SOX4 combined with Met for 3 days, and harvested for cell apoptosis test via flow cytometry. Data are expressed as the means ± SEMs (*p < 0.05, **p < 0.01, ***p < 0.001).
Fig. 8
Fig. 8. Met exerts its inhibitory effects by modulating the SOX4/TGF-β/Smad signaling axis in vivo.
A Prostate pictures in control, BPH, and BPH combined with Met groups, retrospectively. B Representative HE staining of prostate samples in control, BPH, and BPH combined with Met group. C Bar plots showing the body weight, prostate weight, and prostate index in control, BPH, and BPH combined with Met groups. D Bar plots showing the serum levels of TNF-α, IL-1β, and IL-6 in control, BPH, and BPH combined with Met groups. E Representative SOX4 IHC staining of prostate samples in control, BPH, and BPH combined with Met groups. F Representative IHC staining of Ki-67 in prostate samples from the control, BPH, and BPH combined with Met groups. G Representative Masson staining of prostate samples from the control, BPH, and BPH combined with Met groups. Data are expressed as the means ± SEMs (*p < 0.05, **p < 0.01, ***p < 0.001, ****p < 0.0001, ns not significant).

Similar articles

References

    1. Devlin CM, Simms MS, Maitland NJ. Benign prostatic hyperplasia - what do we know? BJU Int. 2021;127:389–99. - PubMed
    1. Hoke GP, McWilliams GW. Epidemiology of benign prostatic hyperplasia and comorbidities in racial and ethnic minority populations. Am J Med. 2008;121:S3–10. - PubMed
    1. Vuichoud C, Loughlin KR. Benign prostatic hyperplasia: epidemiology, economics and evaluation. Can J Urol. 2015;22:1–6. - PubMed
    1. DerSarkissian M, Xiao Y, Duh MS, Lefebvre P, Swensen AR, Bell CF. Comparing clinical and economic outcomes associated with early initiation of combination therapy of an alpha blocker and dutasteride or finasteride in men with benign prostatic hyperplasia in the United States. J Manag Care Spec Pharm. 2016;22:1204–14. - PMC - PubMed
    1. Chang WH, Tsai YS, Wang JY, Chen HL, Yang WH, Lee CC. Sex hormones and oxidative stress mediated phthalate-induced effects in prostatic enlargement. Environ Int. 2019;126:184–92. - PubMed

MeSH terms