. 2025 Jul 1;16(1):5604.
doi: 10.1038/s41467-025-60512-y.

Acute stress causes sex-specific changes to ventral subiculum synapses, circuitry, and anxiety-like behavior

Affiliations

Acute stress causes sex-specific changes to ventral subiculum synapses, circuitry, and anxiety-like behavior

Carley N Miller et al. Nat Commun. .

Abstract

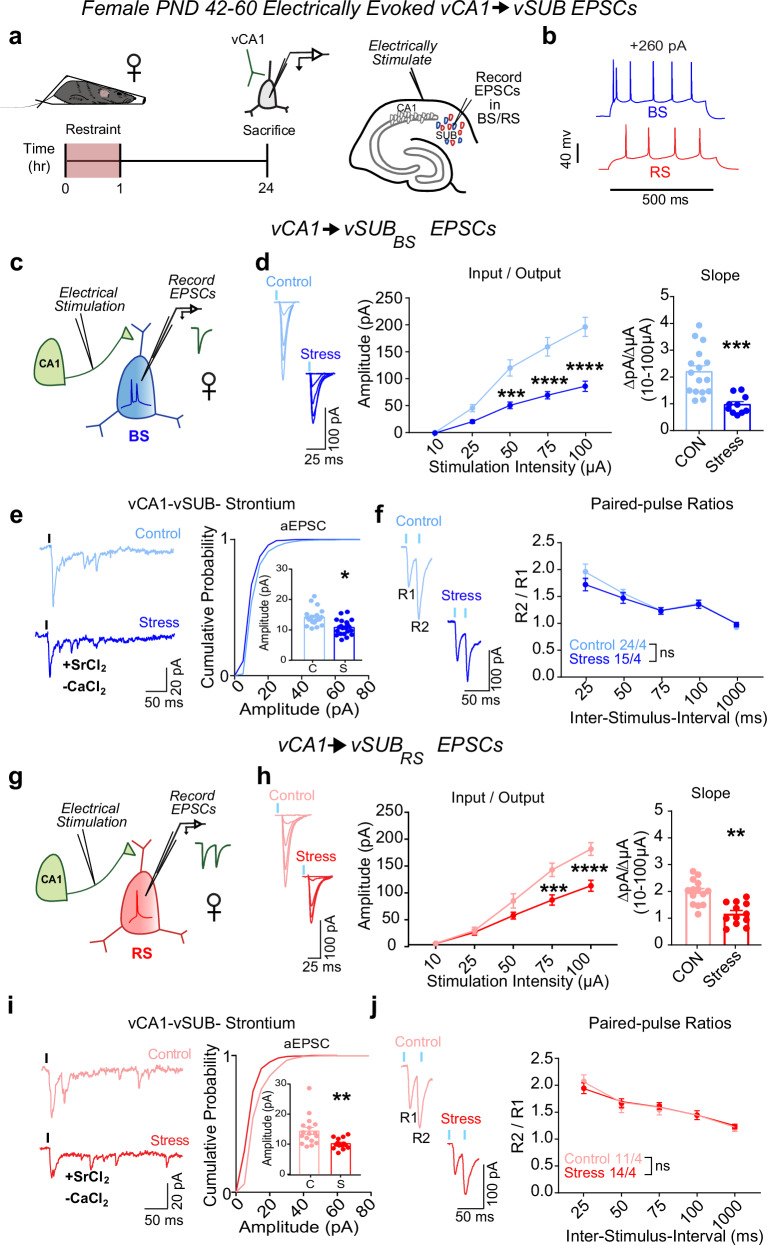
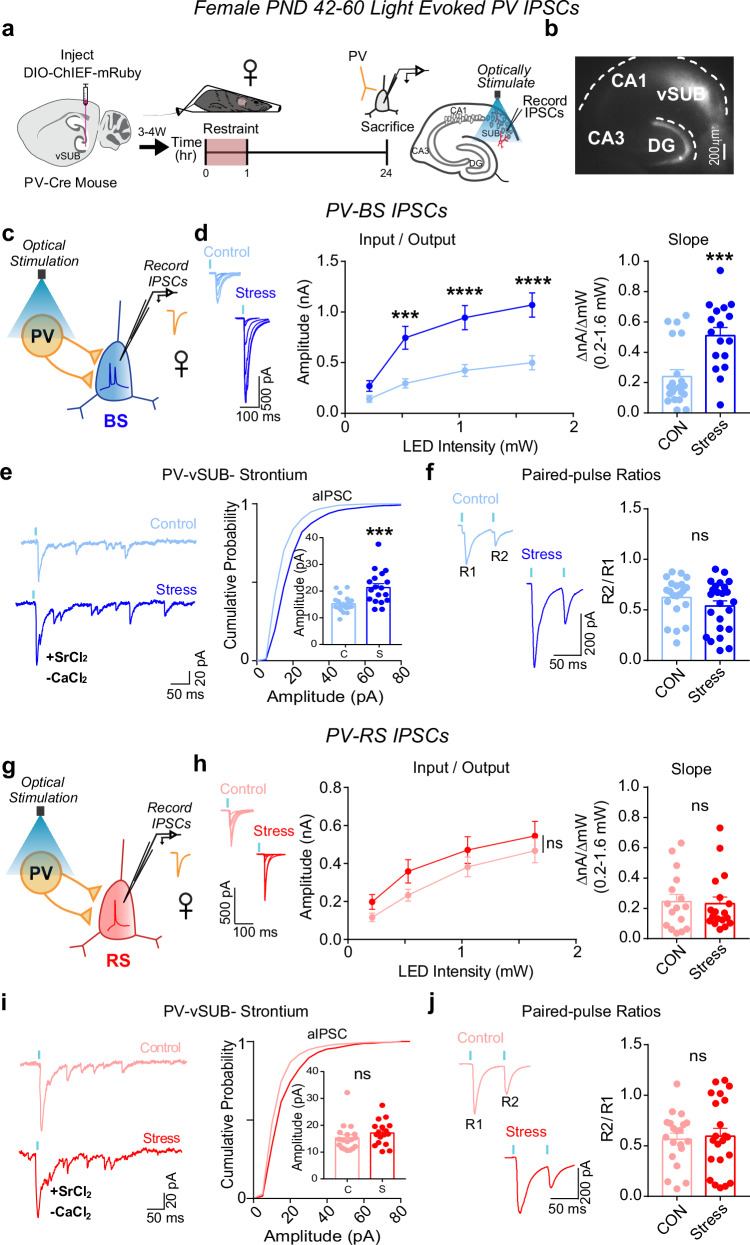
Experiencing a single severe stressor is sufficient to drive sexually dimorphic psychiatric disease development. The ventral subiculum (vSUB) emerges as a site where stress may induce sexually dimorphic adaptations due to its sex-specific organization and pivotal role in stress integration. Using a 1 h acute restraint stress model in mice, we uncover that stress causes a net decrease in vSUB activity in females driven by adrenergic receptor signaling. By contrast, males exhibit a net increase in vSUB activity that is driven by corticosterone signaling. We further identified sexually dimorphic changes in vSUB output to the anterior bed nucleus of the stria terminalis and in anxiety-like behaviors in response to stress. These findings reveal striking changes in psychiatric disease-relevant brain regions and behavior following stress with sex-, cell-type, and synapse-specificity that contribute to our understanding of sexually dimorphic adaptations that may shape stress-related psychiatric disease risk.


Conflict of interest statement

Competing interests: The authors declare no competing interests.

Figures

Fig. 1
Fig. 1. Stress weakens vCA1-vSUB basal excitatory synaptic strength in females.
a Electrically evoked excitatory postsynaptic currents (EPSCs) from vCA1 were recorded in vSUB neurons 24 h after stress in female mice (PND42-60). b Representative traces of action potential firing patterns in burst-spiking (blue) or regular-spiking (red) cells. c, g Experimental schema to record EPSCs from burst-spiking or regular-spiking cells. d Input-output representative traces (left), summary graph (middle), and slope (right) for EPSCs recorded in burst-spiking cells ((d) Stim Intensity x Stress Group F(4, 96) = 13.62, ****p < 0.0001; 10 μA, p > 0.9999; 25 A, p = 0.5756; 50 μA, ***p = 0.0007; 75 μA, ****p < 0.0001; 100 μA, ****p < 0.0001; slope, ***p = 0.0003 (t = 4.212, df = 24); control n = 16/4, stress n = 10/4) or (h) regular-spiking cells ((h) Stim Intensity x Stress Group F(4, 96) = 10.82, ****p < 0.0001; 10 μA, p > 0.9999; 25 μA, p = 0.9997; 50 μA, p = 0.1651, 75 μA, ***p = 0.0001; 100 μA, ****p < 0.0001; slope, **p = 0.0043 (t = 4.149, df = 7); control n = 15/4, stress n = 12/5). e, i Representative traces of strontium-mediated aEPSCs after electrical stimulation (left) and aEPSC amplitude (right) for burst-spiking ((e) *p = 0.0352 (t = 3.129, df = 4); control n = 20/3, stress n = 21/3) or regular-spiking cells ((i;) **p = 0.051 (t = 3.040, df = 28); control n = 16/3, stress n = 14/3). f, j Representative PPR trace (50 ms) (left) and PPR quantification (right) from burst-spiking ((f) ISI x Stress Group F(4, 148) = 1.236, p = 0.2982; control n = 24/4, stress n = 15/3) or regular-spiking cells ((j) ISI x Stress Group F(4, 92) = 0.5969, p = 0.6658; control n = 11/4, stress n = 14/4). Data are mean ± SEM calculated from the total number of cells indicated in graphs. Numbers in the legend represent the numbers of cells/animals. Statistical significance was determined by 2-way repeated measures ANOVA followed by Šidák’s multiple comparisons test ((d) (middle), (f, h) (middle), (j)) or a nested unpaired Student’s t-test (two-tailed) ((d) (right), (e, h) (right), (i)). Source data are provided as a Source Data file.
Fig. 2
Fig. 2. Stress does not alter vCA1-vSUB basal excitatory synaptic strength in males.
a Electrically evoked EPSCs from vCA1 were recorded in vSUB neurons 24 h after stress in male mice (PND42-60). b Representative traces of firing patterns in burst-spiking (blue) or regular-spiking (red) cells. c, g Experimental schema to record EPSCs from burst-spiking or regular-spiking cells. d Input-output representative traces (left), summary graph (middle), and slope (right) for EPSCs recorded in burst-spiking (Stim Intensity x Stress Group F(4, 52) = 0.4200, p = 0.7934; slope, p = 0.6195 (t = 0.5234, df = 6); control n = 6/3, stress n = 8/3) or (h) regular-spiking cells (Stim Intensity x Stress Group F(4, 88) = 0.3494, p = 0.8438; slope, p = 0.8081 (t = 0.2458, df = 22); control n = 13/3, stress n = 11/4). e, i Representative traces of strontium-evoked asynchronous EPSCs (aEPSCs) and aEPSC amplitude summary graph (right) for burst-spiking ((e) p = 0.7469 (t = 0.3458, df = 4); control n = 17/3, stress n = 14/3) or regular-spiking cells (i; p = 0.9882 (t = 0.01494, df = 26); control n = 14/3, stress n = 14/3). f, j Representative PPR traces (50 ms) (left) and PPR measurements (right) from burst-spiking ((f) ISI x Stress Group F(4, 132) = 1.257, p = 0.2901; control n = 17/5, stress n = 18/4) or regular-spiking cells ((j) ISI x Stress Group F(4, 140) = 0.9487, p = 0.4378; control n = 19/6, stress n = 18/4). Data are mean ± SEM calculated from the total number of cells indicated in the graphs. Numbers in the legend represent the numbers of cells/animals. Statistical significance was determined by 2-way repeated measures ANOVA followed by Šidák’s multiple comparisons test ((d) (middle), (f, h) (middle), (j)) or a nested unpaired Student’s t-test (two-tailed) (d) (right), (e, h) (right), (i)). Source data are provided as a Source Data file.
Fig. 3
Fig. 3. Stress strengthens parvalbumin-positive interneuron (PV)-burst-spiking (BS) inhibition via increased postsynaptic strength in females.
a A Cre-dependent ChIEF adeno associated virus (AAV) was injected into vSUB of PV-Cre female mice (PND42-60) and optogenetically evoked inhibitory postsynaptic currents (IPSCs) from PV interneurons were recorded from burst-spiking (blue) or regular-spiking (red) cells 24 h after stress. b Example image of ChIEF-mRuby expression in the vSUB. c, g Optogenetically stimulated IPSCs were recorded in burst-spiking or regular-spiking cells after stress. d, h Input-output representative traces (left), summary graph (middle), and slope (right) for IPSCs recorded in burst-spiking ((d) LED Intensity x Stress Group F(3, 108) = 15.07, ****p < 0.0001, 0.213 mW, p = 0.7032; 0.518 mW, ***p = 0.0004; 1.050 mW, ****p < 0.0001; 1.640 mW, ****p < 0.0001; slope, ***p = 0.0004 (t = 3.908, df = 36); control n = 21/3, stress n = 17/3) or regular-spiking cells ((h) LED Intensity x Stress Group F(3, 96) = 0.2289, p = 0.8761; slope, p = 0.9034 (t = 0.1259, df = 7); control n = 16/3, stress n = 18/3). e, i Representative traces of strontium-mediated asynchronous IPSCs (aIPSCs) after optogenetic stimulation (left) and aIPSC amplitude (right) for burst-spiking ((e) ***p = 0.0004 (t = 3.948, df = 36); control n = 20/3, stress n = 18/3) or regular-spiking cells (i; p = 0.6575 (t = 0.5781, df = 4); control n = 18/3, stress n = 17/3). f, j Representative PPR traces (50 ms) (left) and PPR measurements (right) from burst-spiking ((f) p = 0.5518 (t = 0.6488, df = 4); control n = 22/3, stress n = 24/3) or regular-spiking cells ((j) p = 0.8504 (t = 0.1957, df = 7); control 20/3, stress n = 22/3). Data are represented as mean ± SEM; means were calculated from the total number of cells indicated in graphs. Numbers in the legend represent the numbers of cells/animals. Statistical significance was determined by a 2-way repeated measures ANOVA followed by Šidák’s multiple comparisons test ((d) (middle), (h)(middle)) or nested unpaired Student’s t-test (two-tailed) (d (left)-(f, h) (left)-(j)). Source data are provided as a Source Data file.
Fig. 4
Fig. 4. Stress weakens parvalbumin-positive interneuron (PV)-burst-spiking (BS) inhibition via decreased postsynaptic strength in males.
a A Cre-dependent ChIEF adeno associated virus (AAV) was injected into vSUB of PV-Cre male mice (PND42-60) and optogenetically evoked inhibitory postsynaptic currents (IPSCs) from PV interneurons were recorded from burst-spiking (blue) or regular-spiking (red) cells 24 h after stress. b Example image of ChIEF-mRuby expression in the vSUB. c, g Optogenetically stimulated IPSCs were recorded in burst-spiking or regular-spiking cells after stress. d, h Input-output representative traces (left), summary graph (middle), and slope (right) for IPSCs recorded in burst-spiking ((d) LED Intensity x Stress Group F(3, 84) = 9.405, ****p < 0.0001, 0.213 mW, p = 0.8332; 0.518 mW, p = 1994; 1.050 mW, ***p = 0.0005; 1.640 mW, ****p < 0.0001; slope, *p = 0.0369 (t = 3.080, df = 4); control n = 15/3, stress n = 15/3) or regular-spiking cells (h; LED Intensity x Stress group F(3, 69) = 0.2209, p = 0.8815; slope, p = 0.6163 (t = 0.5424, df = 4); control n = 10/3, stress n = 15/3). e, i Representative traces of strontium-mediated asynchronous IPSCs (aIPSCs) after optogenetic stimulation (left) and aIPSC amplitude (right) for burst-spiking ((e) *p = 0.0109 (t = 2.690, df = 35); control n = 23/3, stress n = 14/3) or regular-spiking cells (i; p = 0.7594 (t = 0.3085, df = 38); control n = 19/3, stress n = 21/3). f, j Representative PPR traces (50 ms) (left) and PPR measurements (right) from burst-spiking ((f) p = 0.4417 (t = 0.8531, df = 4); control n = 21/3, stress n = 20/3) or regular-spiking cells ((j) p = 0.2826 (t = 1.093, df = 31); control 13/3, stress n = 20/3). Data are mean ± SEM calculated from the total number of cells indicated in the graphs. Numbers in the legend represent the numbers of cells/animals. Statistical significance was determined by a 2-way repeated measures ANOVA followed by Šidák’s multiple comparisons test ((d) (middle), (h) (middle)) or nested unpaired Student’s t-test (two-tailed) ((d) (left)-(f, h) (left)-(j)). Source data are provided as a Source Data file.
Fig. 5
Fig. 5. vSUB burst-spiking (BS) cells primarily project to anterior bed nucleus of the stria terminalis (aBNST) and exhibit sex-specific activity in vivo.
a vSUB-aBNST cartoon. b Retrograde labeling schema. c Representative retrograde labeling images. d–f Identification and quantification of intrinsic excitability and rheobase of aBNST-projecting vSUB cells and in female mice ((e) Current Injected x Cell Type F(8, 616) = 0.7289, p = 0.6661; rheobase, p = 0.6624 (t = 0.4383, df=78); burst-spiking=64/3 regular-spiking=16/3) or male ((f) Current injected x Cell Type F(8, 720) = 0.3925, p = 0.9249; rheobase, p = 0.1793 (t = 1.353, df = 90); burst-spiking = 72/3, regular-spiking=20/3) mice. g Strategy to measure in vivo calcium activity from aBNST-projecting vSUB cells during control (Pre), stress (Res), and stress recovery (Post) periods. h aBNST injection site (right) and vSUB fiber placement (left) images. (ik, pr) Representative traces and heat maps from control (i female; p male), recovery (k female; r male) or struggle initiation periods (j female; q male). l, s Overlay of traces for females (l) and males (s). m, t Z-score amplitudes in females ((m) F(1.684, 15.16) = 9.289, **p = 0.0033, Pre vs Res **p = 0.0088; Pre vs Post p = 0.9114; Res vs Post *p = 0.0348; n = 10) and males ((t) F(1.911, 15.29) = 12.76, ***p = 0.0006, Pre vs Res *p = 0.0390; Pre vs Post p = 0.2682; Res vs Post **p = 0.0013; n = 9) mice. n, u Overall activity, the area under the curve (AUC), in females ((n) F(1.676, 15.08) = 87.03, ****p < 0.0001, Pre vs Res ****p < 0.0001; Pre vs Post p = 0.9996; Res vs Post ****p < 0.0001; n = 10) and males (u; F(1.146, 9.168) = 28.38, ***p = 0.003, Pre vs Res **p = 0.0012; Pre vs Post *p = 0.0259; Res vs Post **p = 0.0023; n = 9). o, v Calcium event frequency in females ((o) F(1.353, 12.18) = 6.702, *p = 0.0173, Pre vs Res p = 0.0574; Pre vs Post p = 0.8446; Res vs Post p = 0.0529; n = 10) and males ((v) F(1.504, 12.03) = 7.179, *p = 0.0127, Pre vs Res p = 0.1528; Pre vs Post p = 0.5012; Res vs Post **p = 0.0012; n = 9). Data: mean ± SEM from the number of cells (electrophysiology) or animals (fiber photometry). Significance: 2-way repeated measures ANOVA followed by Šidák’s multiple comparisons test ((e, f) intrinsic excitability), unpaired Student’s t-test (two-tailed) ((e, f) rheobase), or 1-way repeated measures ANOVA followed by Šidák’s multiple comparisons test (mo, tv). Source data are provided as a Source Data file.
Fig. 6
Fig. 6. Stress causes sex-specific changes to vSUB output to the anterior bed nucleus of the stria terminalis (aBNST) and anxiety-like behavior.
a Experimental schema to optogenetically isolate vSUB input to aBNST and monitor light-evoked exciatory postsynaptic currents (EPSCs) in male and female mice (PND42-60) 24 h after restraint stress. b, d Input-output representative traces (left), summary graph (middle), and slope (right) for EPSCs recorded in the aBNST of female ((b) LED Intensity x Stress Group F(5, 100) = 8.563, ****p < 0.0001, 0.3 mW, p > 0.9999; 0.8 mW, p = 0.1421; 1.3 mW, **p = 0.0091; 3.1 mW, **p = 0.0014; 5.8 mW, ***p = 0.0002; 6.6 mW, ***p = 0.0004; slope, ***p = 0.0005 (t = 4.181, df = 20); control n = 9/3, stress n = 13/3) or male mice ((d) LED Intensity x Stress Group F(5, 110) = 10.84, ****p < 0.0001, 0.3 mW, p = 0.9984; 0.8 mW, p = 0.7935; 1.3 mW, p = 0.0588; 3.1 mW, ***p = 0.0004; 5.8 mW, ****p < 0.0001; 6.6 mW, ****p < 0.0001; slope, p = 0.06 (t = 2.601, df = 4); control n = 14/3, stress n = 10/3). c, e Representative PPR traces (50 ms) (left) and PPR measurements (right) from female ((c) *p = 0.0207 (t = 2.476, df = 24), control n = 13/3, stress n = 13/3) or male ((e) *p = 0.0348 (t = 3.142, df = 4), control n = 16/3, stress n = 14/3) mice. f Anxiety-like behavior was assessed in the elevated zero maze (EZM) and conveyed as the percent time spent in the closed arm. (g, h) Distance traveled during the EZM in females ((g) p = 0.7923 (t = 0.2684, df = 14); control n = 8, stress n = 8) and males ((h) p = 0.9573 (t = 0.054117, df = 20); control n = 11, stress n = 11). (i, j) Percent closed arm time in the EZM for females ((i) **p = 0.0086 (t = 3.055, df=14); control n = 8, stress n = 8) and males ((j) p = 0.7830 (t = 0.2792, df = 20); control n = 11, stress n = 11). Data are represented as mean ± SEM and calculated from the total number of cells (electrophysiology) or total animals (behavior) as indicated in bars. Statistical significance was determined by a 2-way repeated measures ANOVA followed by Šidák’s multiple comparisons test ((b) (middle), (d) (middle)), nested unpaired Student’s t-test (two-tailed) ((b) (left)-(c, d) (left)-(e)), or unpaired Student’s t-test (two-tailed) (gj). Source data are provided as a Source Data file.
Fig. 7
Fig. 7. Adrenergic signaling drives stress-enhancement of parvalbumin interneuron (PV)-burst-spiking (BS) inhibition in females.
ad Impact of adrenergic receptor (AR) or corticosterone (Cort) synthesis inhibitors in stress-naive females. a Experimental schema. b Inhibitory post-synaptic current (IPSC) input-output curves (left) and slope (right). (LED Intensity x Drug F(6, 126) = 0.3048, p = 0.9334; slope, F(2, 6) = 0.2611, p = 0.7785; saline n = 14/3, AR n = 15/3, Cort n = 16/3). c Strontium-evoked aIPSC amplitudes (c; F(2, 6) = 0.2684, p = 0.7733; saline n = 15/3, AR n = 13/3, Cort n = 13/3). d Paired-pulse ratios (PPRs) (50 ms; F(2, 42) = 0.3617, p = 0.6986; saline n = 14/3, AR n = 15/3, Cort n = 16/3). eh AR inhibition in stress-exposed females. e Experimental schema. f IPSC input-output curves (left; LED Intensity x Condition F(6, 123) = 4.931, ***p = 0.0001, Control+Saline vs Stress + AR, 0.213 mW, p > 0.9999; 0.528 mW, p > 0.9999; 1.050 mW, p = 0.5795; 1.640 mW, p = 0.4584; Control+Saline vs Stress + Saline, 0.213 mW, p = 0.4963; 0.528 mW, ***p = 0.0006; 1.050 mW, ****p < 0.0001; 1.640 mW, ****p < 0.0001) and slope (right; F(2, 42) = 8.709, ***p = 0.0007, Control+Saline vs Stress+AR, p = 0.3836, Control + Saline vs Stress+Saline, ***p = 0.0005; Control + Stress n = 13/3, Stress+Saline n = 15/3, Stress + AR = 17/4). (g) Strontium-evoked asynchronous IPSC (aIPSC) amplitudes (F(2, 7) = 6.955, *p = 0.0217, Control+Saline vs Stress+AR p = 0.5212, Control+Saline vs Stress + Saline *p = 0.0175, Control + Saline n = 12/3, Stress+Saline n = 13/3, Stress + AR n = 15/4). h PPRs (50 ms; F(2, 7) = 0.6844, p = 0.5532, Control+Saline n = 13/3, Stress + Saline n = 15/3, Stress + AR n = 17/3). il Cort inhibition in stress-exposed females. i Experimental schema. j Input-output curve and representative traces (left; LED Intensity x Condition F(6, 114) = 5.539, ****p < 0.0001, Control + DMSO vs Stress + Cort, 0.213 mW, p > 0.9999; 0.518 mW, p = 0.1381; 1.050 mW, ****p < 0.0001; 1.640 mW, ***p < 0.0001; Control+DMSO vs Stress+DMSO, 0.213 mW, p > 0.9999, 0.518 mW, p = 0.2742, 1.050 mW, *p = 0.0188, 1.640 mW, **p = 0.0080) and slope (right; F(2, 6) = 9.566, *p = 0.0136, Control+DMSO vs Stress+Cort, *p = 0.0123, Control+DMSO vs Stress+DMSO, *p = 0.0453; Control + DMSO n = 16/4, Stress + DMSO n = 9/2, Stress+Cort n = 16/3). k Strontium-evoked aIPSCs (F(2, 6) = 11.29, **p = 0.0092, Control+DMSO vs Stress + Cort *p = 0.0123, Control + DMSO vs Stress+DMSO *p = 0.0195; Control+DMSO n = 17/4, Stress + DMSO n = 8/2, Stress + Cort n = 13/3). l IPSC PPRs (50 ms; F(2, 6) = 0.1572, p = 0.8580, Control + DMSO n = 16/4, Stress+DMSO n = 9/2, Stress + Cort n = 16/3). Data: mean ± SEM calculated from individual cells indicated in graphs. Significance: 2-way repeated measures ANOVA followed by Šidák’s multiple comparisons test (bj input-output curves) or nested 1-way ANOVA followed by Šidák’s multiple comparisons test (bj input-output slopes, c-d, g-h, k-l). Source data are provided as a Source Data file.
Fig. 8
Fig. 8. Corticosterone signaling drives stress-reduction of parvalbumin interneuron (PV)-burst-spiking (BS) inhibition in males.
ad Impact of adrenergic receptor (AR) or corticosterone (Cort) synthesis inhibitors in stress-naive females. a Experimental schema. b Inhibitory post-synaptic current (IPSC) input-output curves (left; LED Intensity x Drug F(6, 117) = 0.9416, p = 0.4682) and slope (right; F(2, 6) = 0.9140, p = 0.4503; saline n = 13/3, AR n = 14/3, Cort n = 15/3). c Strontium-evoked asynchronous IPSC (aIPSC) amplitudes (F(2, 6) = 1.229, p = 0.3570; saline n = 14/3, AR n = 12/3, Cort n = 12/3). d IPSC PPR (50 ms) (F(2, 6) = 0.4402, p = 0.6631; saline n = 13/3, AR n = 14/3, Cort n = 15/3). eh AR inhibition in stress-exposed males. e Experimental schema. f Input-output curve (left; LED Intensity x Stress Group F(6, 141) = 9.182, ****p > 0.0001, Control+Saline vs Stress + AR, 0.213 mW p = 0.9465, 0.528 mW p = 0.8516, 1.050 mW *p = 0.0412, 1.640 mW **p = 0.0033; Control + Saline vs Stress+Saline, 0.213 mW p = 0.9909, 0.528 mW **p = 0.0074, 1.050 mW ****p < 0.0001, 1.640 mW ****p < 0.0001) and slope (right; F(2, 7) = 7.844, *p = 0.0163, Control+Saline vs Stress+AR *p = 0.0283, Control + Saline vs Stress+Saline *p = 0.0186; Control + Saline n = 17/4, Stress+Saline n = 16/3, Stress + AR n = 17/3). g aIPSCs (F(2, 7) = 4.801, *p = 0.0487, Control + Saline vs Stress+AR p = 0.4003, Control + Saline vs Stress+Saline *p = 0.0344, Control+Saline n = 16/4, Stress + Saline n = 14/3, Stress+AR n = 13/4). (h) IPSC PPRs (50 ms; F(2, 7) = 1.629, p = 0.2625, Control+Saline n = 17/4, Stress+Saline n = 16/3, Stress + AR n = 17/3). il Cort inhibition in stress-exposed males. i Experimental schema. j Input-output curve (left; LED Intensity x Stress Group F(6, 144) = 11.88, ****p < 0.0001, Control + DMSO vs Stress + Cort, 0.213 mW p > 0.9999, 0.518 mW p > 0.9999, 1.050 mW p = 0.1380, 1.640 mW p = 0.9988; Control + DMSO vs Stress+DMSO, 0.213 mW p > 0.9999, 0.518 mW p = 0.1890, 1.050 mW ****p < 0.0001, 1.640 mW ****p < 0.0001) and slope (right; F(2, 7) = 5.235, *p = 0.0407, Control + DMSO vs Stress + Cort p = 0.8739, Control+DMSO vs Stress+DMSO *p = 0.0345; Control+DMSO n = 20/4, Stress+DMSO n = 14/3, Stress + Cort n = 14/3). k aIPSC amplitudes (F(2, 7) = 13.65, **p = 0.0038, Control + DMSO vs Stress+DMSO p = 0.2359, Control+DMSO vs Stress + DMSO *p = 0.0025, Control+DMSO n = 16/3, Stress+DMSO n = 13/3, Stress+Cort n = 12/3). l IPSC PPRs (50 ms; F(2, 7) = 0.02841, p = 0.9721, Control+DMSO n = 20/4, Stress+DMSO n = 16/3, Stress+Cort n = 14/3). Summary models for females (m) and males (n). Data are mean ± SEM calculated from individual cells. Significance: 2-way repeated measures ANOVA followed by Šidák’s post-hoc test (bj input-output curves) or nested 1-way ANOVA followed by Šidák’s post-hoc test (bj input-output slopes, c, d, g, h, k, l). Source data are provided as a Source Data file.

Update of

Similar articles

References

    1. Bangasser, D. A. & Valentino, R. J. Sex differences in stress-related psychiatric disorders: neurobiological perspectives. Front. Neuroendocrinol.35, 303–319 (2014). - PMC - PubMed
    1. Dalsgaard, S. et al. Incidence rates and cumulative incidences of the full spectrum of diagnosed mental disorders in childhood and adolescence. JAMA Psychiatry77, 155−164 (2019). - PMC - PubMed
    1. McLean, C. P., Asnaani, A., Litz, B. T. & Hofmann, S. G. Gender differences in anxiety disorders: Prevalence, course of illness, comorbidity and burden of illness. J. Psychiatr. Res.45, 1027–1035 (2011). - PMC - PubMed
    1. Chiba, S. et al. Chronic restraint stress causes anxiety- and depression-like behaviors, downregulates glucocorticoid receptor expression, and attenuates glutamate release induced by brain-derived neurotrophic factor in the prefrontal cortex. Prog. Neuro Psychopharmacol. Biol. Psychiatry39, 112–119 (2012). - PubMed
    1. Fanselow, M. S. & Dong, H. W. Are the dorsal and ventral hippocampus functionally distinct structures?. Neuron65, 7–19 (2010). - PMC - PubMed