. 2025 Jul 1;16(1):5314.
doi: 10.1038/s41467-025-60658-9.

A constricted mitochondrial morphology formed during respiration

Affiliations

A constricted mitochondrial morphology formed during respiration

Manish K Singh et al. Nat Commun. .

Abstract

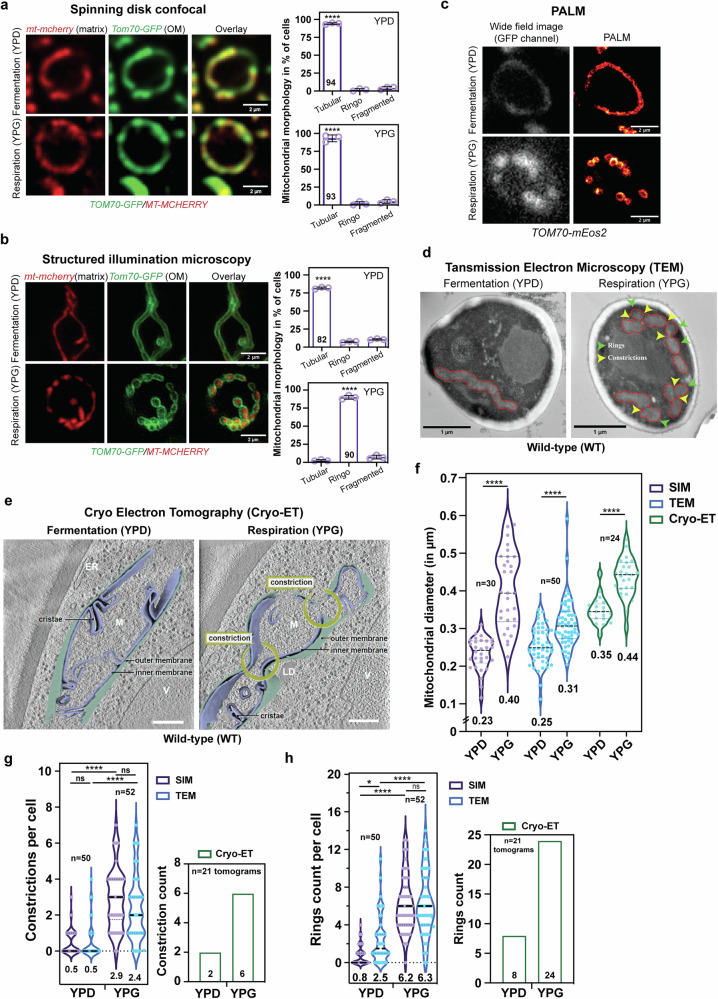
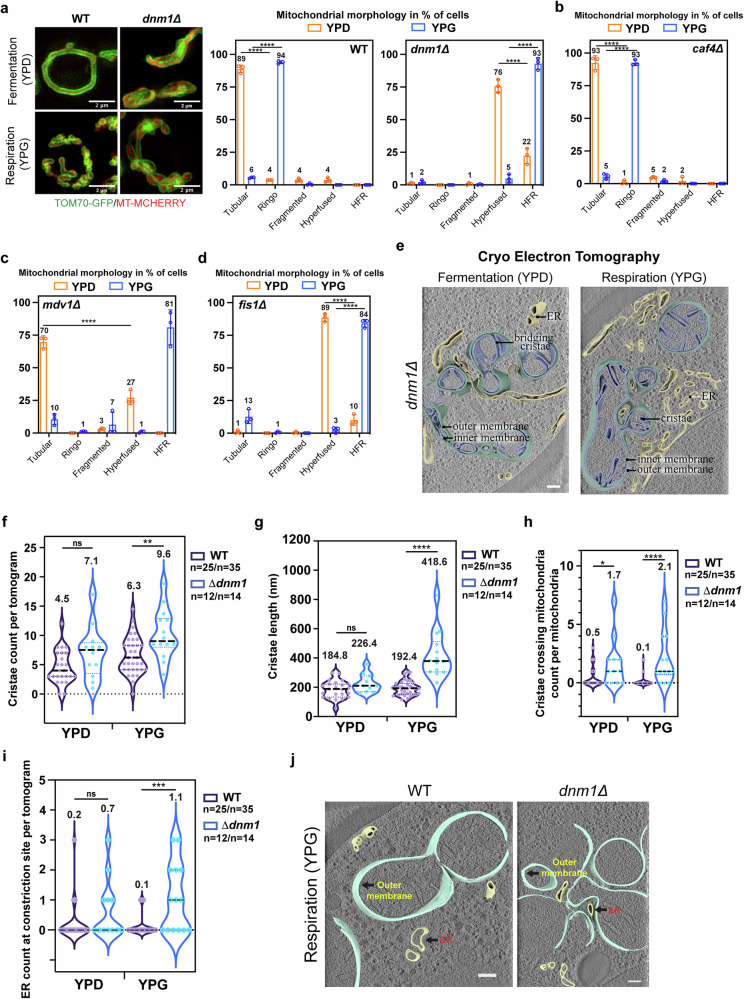
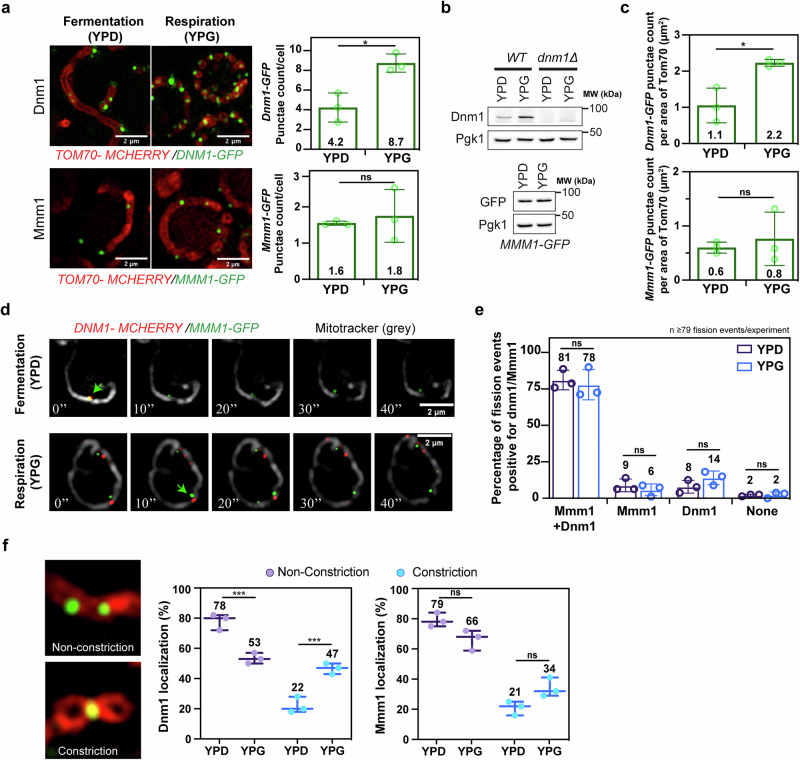
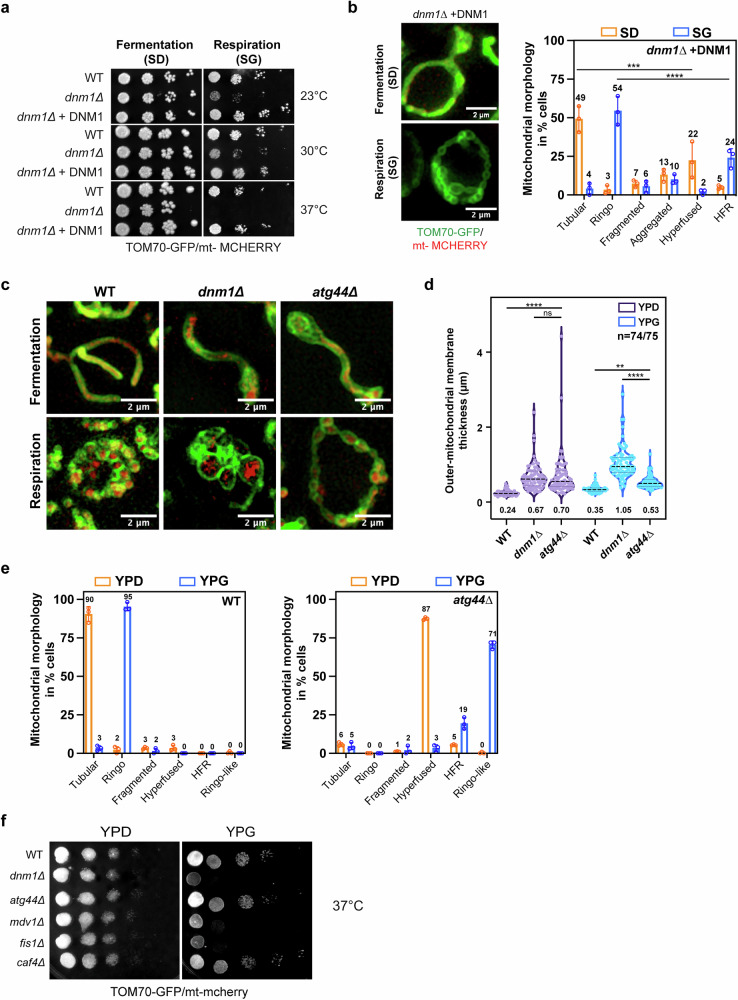
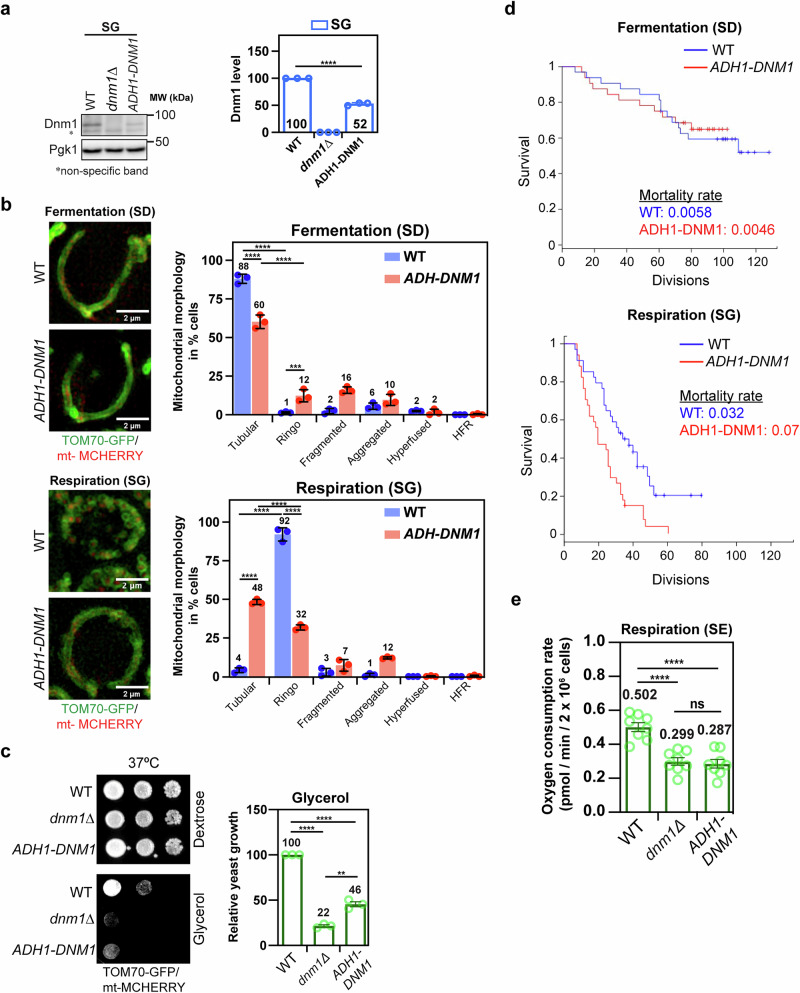
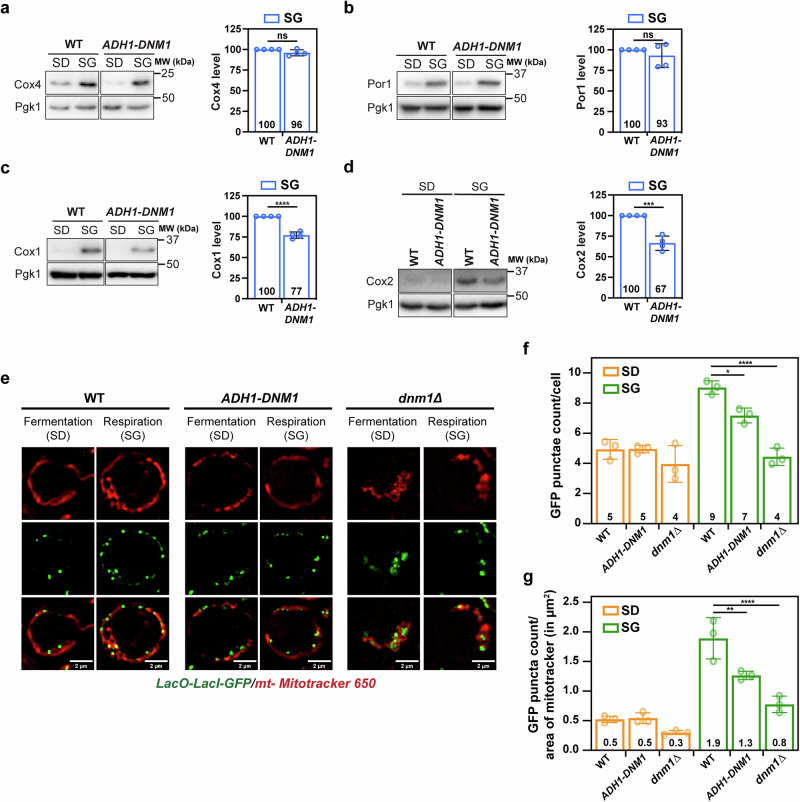
Mitochondria assemble in a dynamic tubular network. Their morphology is governed by mitochondrial fusion and fission, which regulate most mitochondrial functions including oxidative phosphorylation. Yet, the link between mitochondrial morphology and respiratgion remains unclear. Here, we uncover a mitochondrial morphology dedicated to respiratory growth of Saccharomyces cerevisiae, which we refer to as "Ringo". The Ringo morphology is characterized by stable constrictions of mitochondrial tubules. Ringo constrictions are mediated by the yeast dynamin Dnm1 and, unlike mitochondrial fission, occur in the absence of contacts with the endoplasmic reticulum. Our data show that blocking formation of the Ringo morphology correlates with decreased respiration, decreased expression of OXPHOS subunits and perturbed mitochondrial DNA distribution. These results open important perspectives about the link between mitochondrial form and function.


Conflict of interest statement

Competing interests: The authors declare no competing interests.

Figures

Fig. 1
Fig. 1. Identification and characterization of the Ringo mitochondrial morphology.
a, b Spinning-disc acquisitions (a) or SIM z-projections (b) of cells labeled for mitochondrial matrix (mt-mCherry) and Outer Membranes (Tom70-GFP) in fermentation (top) or respiration (bottom). Scale bar, 2 µm. Right graphs: percentage of cells with Tubular, Ringo or Fragmented mitochondria. Mean ± s.d. from > 41 cells (a) or > 86 cells (b) per n = 3 independent experiments (purple circles). ****p < 0.0001 (One-way Anova test followed by Tukey’s multiple comparisons test) (c) Representative wide-field or PALM images of cells labeled with TOM70-mEOS2 in fermentation or respiration (see also Supplementary Fig. 1b with images obtained from two independent experiments). d Representative TEM micrographs (Scale bar, 1 µm) of cells in fermentation or respiration (see also Supplementary Fig. 4a with images obtained from two independent experiments). Mitochondria are delimited by red demarcations. Rings and constrictions are indicated by green or yellow arrowheads, respectively. e Slices through tomographic volumes and 3D renderings of mitochondria (M) during fermentation or respiration. Vacuoles (V), Lipid Droplets (LD) and mitochondrial sub-compartments are indicated. Scale bars, 500 nm. f Average mitochondrial diameter per cell, ****p < 0.0001 (g) constriction counts per cell (left) or per Tomogram (right), ****p < 0.0001, ns p = 0.9989 or 0.2978 and (h) ring counts per cell (left) or per Tomogram (right), in YPD or YPG as quantified in SIM, TEM, or Cryo-ET, *p = 0.0107, ****p < 0.0001, ns p = 0.9991. In fh, violin plots from n = 24 to 50 cells (f) or n = 50 to 52 cells (g, h) with mean indicated at the bottom and by black dashed lines (quartiles with dotted lines). In g, h, n = 21 tomograms (Cryo-ET). In fh, ns, not significant (Two-way Anova test followed by Tukey’s multiple comparisons test).
Fig. 2
Fig. 2. Identification and characterization of the HFR mitochondrial morphology.
ad SIM acquisitions (z-projections) of WT or dnm1Δ cells (a), caf4Δ (b), mdv1Δ (c) and fis1Δ (d) cells labeled for mitochondrial matrix (mt-mCherry) and Outer Membranes (Tom70-GFP) in fermentation (top) or respiration (bottom). Scale bar, 2 µm. Graphs: percentage of cells with Tubular, Ringo, Fragmented, Hyperfused or HFR mitochondria during fermentation (YPD, orange) or respiration (YPG, blue). Mean ± s.d. from > 69 (a), > 62 (b), > 78 (c) or > 113 (d) cells per n = 3 independent experiments (colored circles). ***p < 0.0002 (c) or ****p < 0.0001 (Two-way Anova test followed by Tukey’s multiple comparisons test) (e) Slices through tomographic volumes and 3D renderings of Hyperfused or HFR mitochondria from dnm1Δ cells during fermentation or respiration, respectively. Endoplasmic Reticulum (ER), Nucleus (N) and mitochondrial sub-compartments are indicated. Scale bars, 500 nm. f Cristae count per tomogram, p = 0.0700 (ns), **p = 0.0066 (g) Cristae length, p = 0.1233 (ns), ****p < 0.0001 (h) Cristae crossing mitochondria count per mitochondria, *p = 0.0241, ****p < 0.0001 and (i) ER count at constrictions sites per tomogram (p = 0.0694 (ns), ***p = 0.0003) in WT or dnm1Δ during fermentation (YPD) and respiration (YPG), as quantified in Cryo-ET. In (fi), violin plots from n = 25 (WT YPD), n = 35 (WT YPG), n = 12 (dnm1Δ YPD) or n = 14 (dnm1Δ YPG) tomograms with mean indicated at the top and by dashed lines (quartiles with dotted lines). ns, not significant (Two-tailed Mann-Whitney t-test). j Slices through tomographic volumes and 3D renderings of Ringo (WT) and HFR (dnm1Δ) mitochondria during respiration. Endoplasmic Reticulum (ER), and mitochondrial outer membranes are indicated. Scale bars, 500 nm.
Fig. 3
Fig. 3. Constrictions within Ringo mitochondria are mediated by Dnm1 but do not require contacts with the ER.
a SIM of WT cells labeled for Tom70-mcherry and Dnm1-GFP (top) or Mmm1-GFP (bottom) in fermentation (YPD) or respiration (YPG). Scale bar, 2 µm. Right graphs: Dnm1 (top) and Mmm1 (bottom) puncta count per cell ( > 51 for Dnm1; > 77 for Mmm1) in YPD or YPG. *p = 0.0109, ns p = 0.6582 (Two-tailed unpaired t test). b Total protein extracts prepared from WT and dnm1Δ (top) or MMM1-GFP (bottom) cells in YPD or YPG and analyzed by immunoblotting as indicated. MW (kDa) indicated on the right. c Quantification of Dnm1-GFP (top) or Mmm1-GFP (bottom) puncta count/area of Tom70-mCherry from cells ( > 50 cells per experiment) in (a). *p = 0.014, ns p = 0.6056 (Two-tailed unpaired t test). d SIM Time-lapse from Dnm1-mcherry, Mmm1-GFP, mitotracker (grey) triple-labeled cells during fermentation and respiration. Green arrows indicate fission events. e Percentage of total fission events positive or negative for both Dnm1 and/or Mmm1 (> 79 fission events per experiment). ns p = 0.9946, ns p = 0.9964, ns p = 0.8602, ns p > 0.9999 (Two-way Anova followed by Tukey’s multiple comparisons test). f Percentage of Dnm1 (left) or Mmm1 (right) localization at non-constrictions (purple) or constriction (blue) sites in cells ( > 76 cells per experiment) from (a). ***p = 0.0007, ***p = 0.0007, ns p = 0.0930, ns p = 0.0839 (Two-way Anova followed by Tukey’s multiple comparisons test). For all graphs, Mean ± s.d. from n = 3 independent experiments (circles and dots). ns, not significant.
Fig. 4
Fig. 4. Atg44 is dispensable for the Ringo morphology formation.
a Dextrose and glycerol serial dilutions of WT, dnm1Δ and dnm1Δ+DNM1 strains at 23, 30 and 37 °C. b SIM acquisitions (z-projections) of dnm1Δ+DNM1 cells labeled with mt-mCherry and Tom70-GFP in fermentation (top) or respiration (bottom). Scale bar, 2 µm. Right graph: percentage of cells with Tubular, Ringo, Fragmented, Aggregated, Hyperfused or HFR mitochondria during fermentation (SD, orange) or respiration (SG, blue). Mean ± s.d. from >64 cells in n = 3 independent experiments (colored circles). ***p = 0.0004, ****p < 0.0001 (Two-way Anova test followed by Tukey’s multiple comparisons test) (c) Same as (b) with WT, dnm1Δ or atg44Δ cells in YPD (top) or YPG (bottom) media. d Average mitochondrial thickness per cell from (c), in YPD or YPG as quantified in SIM. Violin plots from n = 74 to 75 cells with mean indicated at the bottom and by black dashed lines (quartiles with dotted lines). ****p < 0,0001,ns p = 0.9966, **p = 0.0089, ****p < 0.0001 (Two-way Anova test followed by Tukey’s multiple comparisons test) (e) Percentage of WT and atg44Δ cells from (c) with Tubular, Ringo, Fragmented, Aggregated, Hyperfused, HFR or Ringo-like mitochondria during fermentation (YPD, orange) or respiration (YPG, blue). Mean ± s.d. from > 73 cells in n = 3 independent experiments (colored circles). f Same as (a) with WT, dnm1Δ, atg44Δ, mdv1Δ, fis1Δ and caf4Δ cells at 37 °C (see also Supplementary Fig. 8d). For all graphs, ns, not significant.
Fig. 5
Fig. 5. Inhibition of Ringo formation correlates with decreased respiration.
a Total protein extracts prepared from WT, dnm1Δ or ADH1-DNM1 cells in glycerol (SG) media and analyzed by immunoblotting as indicated. MW (kDa) indicated on the right. Right graph: Dnm1 levels normalized to Pgk1 in dnm1Δ and ADH1-DNM1 relative to the WT strains in SG. Mean ± s.d. from n = 3 independent experiments (blue circles). ****p < 0.0001 (One-way Anova followed by Tukey’s multiple comparisons test). b SIM acquisitions (z-projections) of WT and ADH1-DNM1 cells labeled with mt-mCherry and Tom70-GFP in fermentation (top) or respiration (bottom). Scale bar, 2 µm. Right graphs: percentage of WT (blue) and ADH1-DNM1 (red) cells with Tubular, Ringo, Fragmented, Aggregated, Hyperfused or HFR mitochondria during fermentation (Top) or respiration (Bottom). Mean ± s.d. from > 95 cells in n = 3 independent experiments (colored circles). ****p < 0,0001, ***p = 0.0007 (Two-way ANOVA multiple comparisons) (c) Dextrose and glycerol serial dilutions of WT, dnm1Δ or ADH1-DNM1 strains at 37 °C. Right graph: Quantification of indicated cells grown at 37 °C on glycerol media relative to the WT strain. Mean ± s.d. from n = 3 independent experiments. ****p < 0.0001, **p = 0.0014 (Two-tailed unpaired t-test) (d) Survival curves derived from single-cell analysis of WT (blue) and ADH-DNM1 (red) cells in SD (top) or SG (bottom) media (Supplementary Fig. 9c), were generated using the Kaplan–Meier estimator (WT n = 32 cells; ADH1-DNM1 n = 32 cells for SD; WT n = 34 cells; ADH1-DNM1 n = 34 cells for SG). e Oxygen Consumption Rates (OCRs) of WT, dnm1Δ and ADH-DNM1 cells grown in 2% Ethanol media (SE) at 30 °C. Mean ± s.d. from n = 8 independent experiments (green circles). ****p < 0.0001, ns p = 0,9299 (Two-tailed unpaired t-test). ns, not significant.
Fig. 6
Fig. 6. Inhibition of Ringo formation correlates with decreased OXPHOS components expression and perturbed mtDNA homeostasis.
ad Total protein extracts prepared from WT and ADH1-DNM1 cells in SD or SG media analyzed by immunoblotting as indicated. MW (kDa) on the right. Right graphs: Cox4 (a), Por1 (b), Cox1 (c) and Cox2 (d) levels normalized to Pgk1 in ADH1-DNM1 relative to the WT strains in SG media. Mean ± s.d. from n = 4 independent experiments (blue circles). ns p = 0,0688 (a), ns p = 0,3672 (b), ****p < 0,0001 (c) and ***p = 0,0002 (d), ns, not significant, (Two-tailed unpaired t-test). (e) SIM acquisitions of WT, ADH1-DNM1 and dnm1Δ mtLacO-LacI strains (LacI-GFP) in SD or SG media and labelled with Mitotracker 650. Scale bar, 2 μm. f LacI-GFP puncta count per cell in WT, ADH1-DNM1, and dnm1Δ strains ( > 22 cells) during fermentation (SD, orange) and respiration (SG, green). **p = 0.0484, ****p < 0,0001 (g) Quantification of LacI-GFP puncta count/area of Mitotracker 650 from cells ( > 22) in (e). *p = 0.005, ****p < 0,0001. In (f) and (g), Mean ± s.d. from n = 3 independent experiments (colored circles), two-way Anova followed by Tukey’s multiple comparisons test.

Similar articles

References

    1. Quintana-Cabrera, R. & Scorrano, L. Determinants and outcomes of mitochondrial dynamics. Mol. Cell83, 857–876 (2023). - PubMed
    1. Tilokani, L., Nagashima, S., Paupe, V. & Prudent, J. Mitochondrial dynamics: overview of molecular mechanisms. Essays Biochem62, 341–360 (2018). - PMC - PubMed
    1. Ozeir, M. & Cohen, M. M. From dynamin related proteins structures and oligomers to membrane fusion mediated by mitofusins. Biochim Biophys. Acta Bioenerg.1863, 148913 (2022). - PubMed
    1. Bleazard, W. et al. The dynamin-related GTPase Dnm1 regulates mitochondrial fission in yeast. Nat. Cell Biol.1, 298–304 (1999). - PMC - PubMed
    1. Sesaki, H. & Jensen, R. E. Division versus fusion: Dnm1p and Fzo1p antagonistically regulate mitochondrial shape. J. Cell Biol.147, 699–706 (1999). - PMC - PubMed

MeSH terms

LinkOut - more resources