Clinical Trial
. 2025 Jul 1;16(1):5700.
doi: 10.1038/s41467-025-60049-0.

Aerobic and resistance exercise-regulated phosphoproteome and acetylproteome modifications in human skeletal muscle

Affiliations
Clinical Trial

Aerobic and resistance exercise-regulated phosphoproteome and acetylproteome modifications in human skeletal muscle

Mark W Pataky et al. Nat Commun. .

Abstract

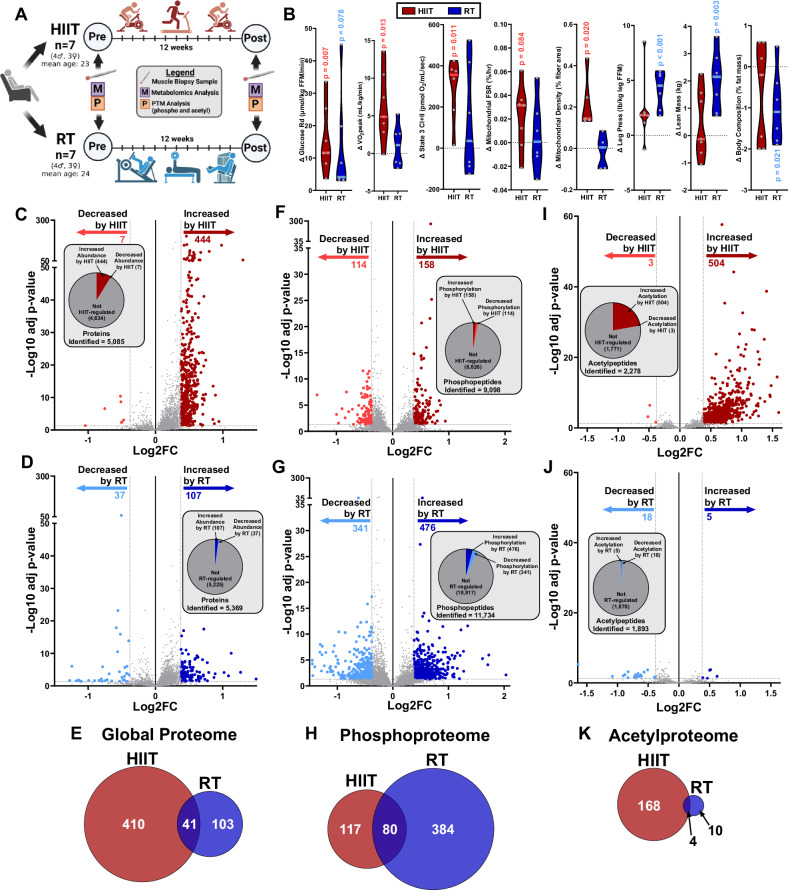
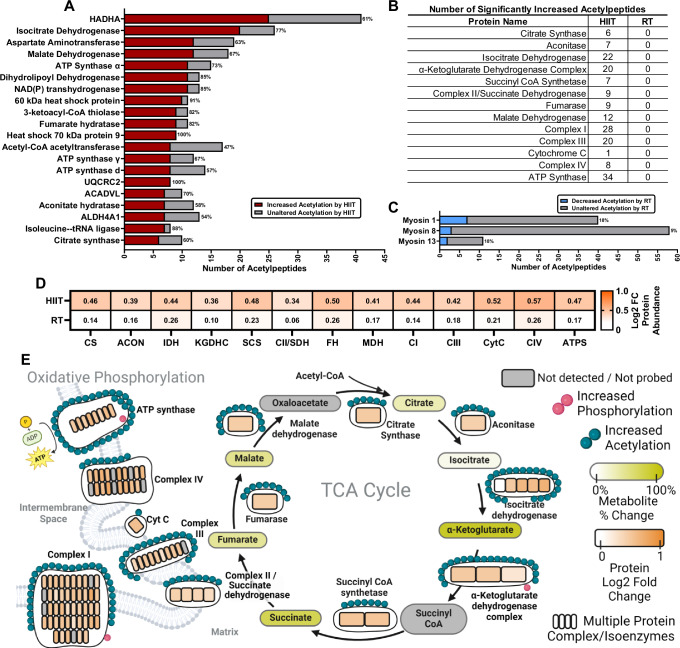
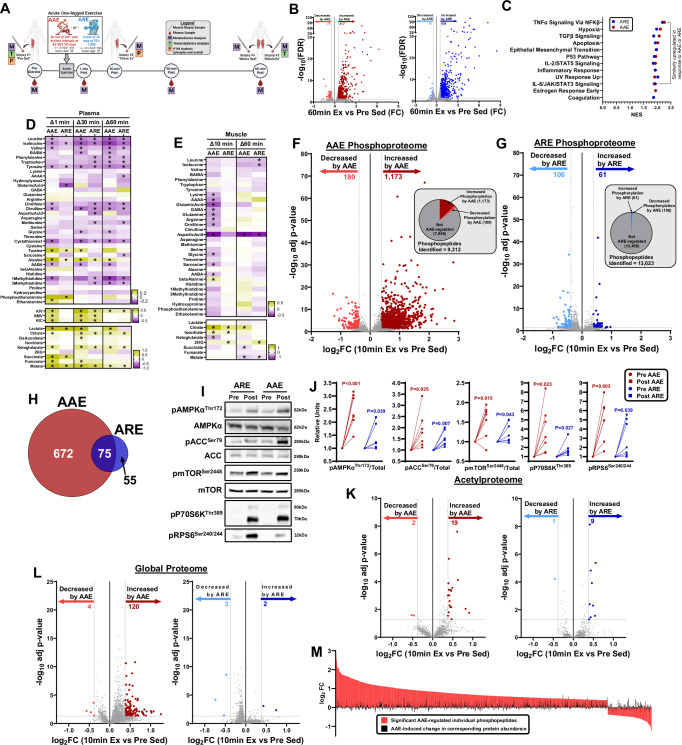
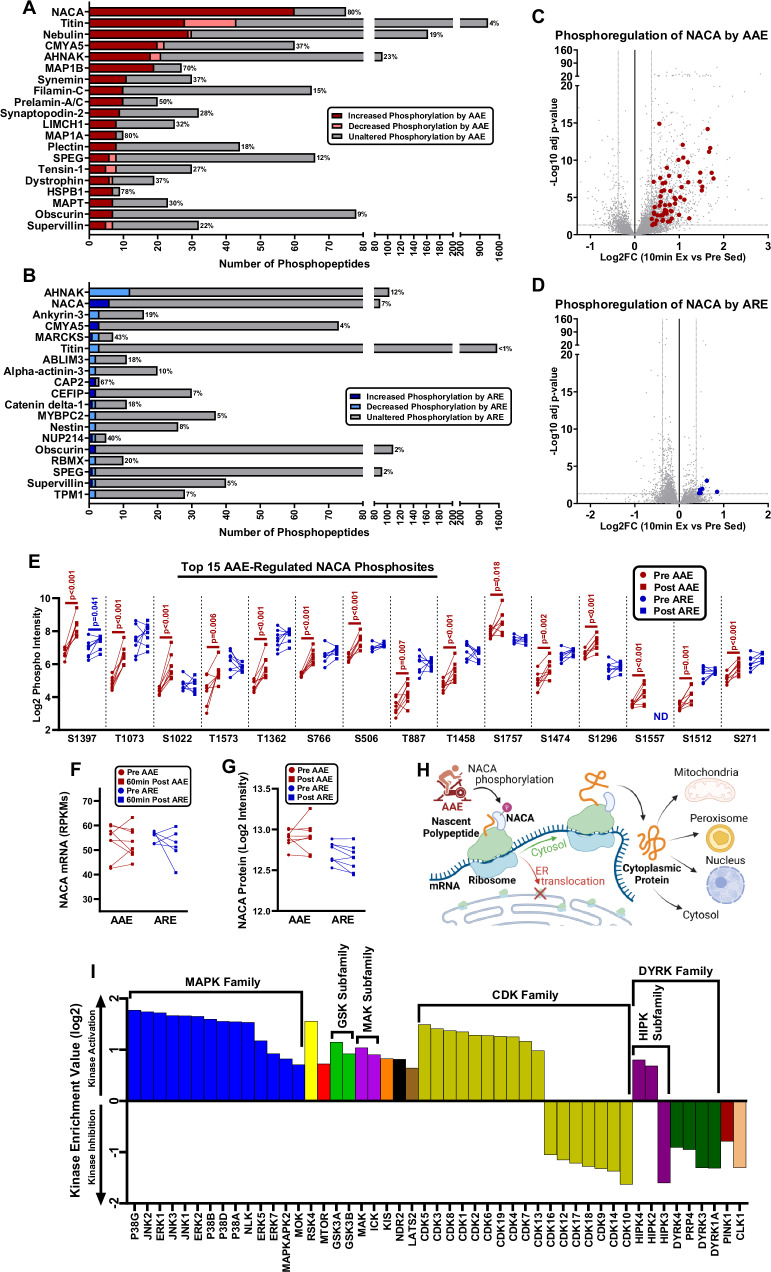
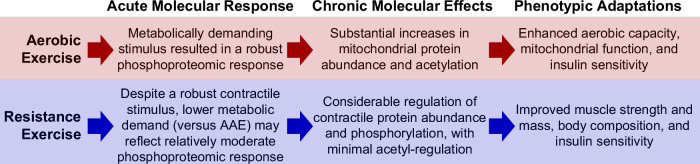
Despite indisputable benefits of different exercise modes, the molecular underpinnings of their divergent responses remain unclear. We investigate post-translational modifications in human skeletal muscle following 12 weeks of high-intensity aerobic interval or resistance exercise training. High-intensity aerobic training induces acetylproteome modifications including several mitochondrial proteins, indicating post-translational regulation of energetics machinery, whereas resistance exercise training regulates phosphoproteomic modifications of contractile/cytoskeletal machinery, consistent with greater strength. Furthermore, despite similar transcriptional responses to a single acute bout of aerobic and resistance exercise, more robust phosphoproteomic and metabolomic responses occur with acute aerobic exercise, including phosphorylation of structural/contractile and membrane transport machinery, and the nascent polypeptide-associated complex-α, a regulator of protein translation. Together, our findings provide new insight on the intricate phosphoproteomic and acetylproteomic modifications in muscle that potentially explain physiological responses to different modes of chronic and acute exercise. This study is registered with ClinicalTrials.gov, numbers NCT01477164 and NCT04158375.


Conflict of interest statement

Competing interests: C.M.A. is a shareholder and serves as an officer and K.S.N. is on the advisory board at Emmyon, Inc. The remaining authors declare no competing interests.

Figures

Fig. 1
Fig. 1. Experimental procedure of the phospho-, acetyl-, and global proteomic analysis of human skeletal muscle biopsy tissues.
After trypsin digest, peptides were isobarically labeled and combined into two tubes. One tube was acetyl enriched and the other tube was fractionated by high-performance liquid chromatography (HPLC). Of these, two distinct fractions were recombined, resulting in 48 tubes, of which a small portion was used for global proteomics analysis. Four tubes with distinct fractions were combined again, resulting in 12 tubes, which were used for phospho-enrichment. Mass spectra were measured on all samples using a Thermo Fusion Tribrid coupled to Ultimate 3000 HPLC. Created in BioRender. Pataky, M. (2025).
Fig. 2
Fig. 2. HIIT and RT regulate distinct global, phospho-, and acetyl-proteomic adaptations in human skeletal muscle.
A Diagram of exercise training study design. Created in BioRender. Pataky, M. (2025). B The change (Δ) in insulin sensitivity (Glucose Rd), aerobic capacity (VO2peak), mitochondrial respiration (State 3 CI + II), mitochondrial protein synthesis rate (fractional synthesis rate, FSR), mitochondrial density (mitochondrial area/muscle fiber area), muscle strength (Leg Press), Lean Mass, and % Fat Mass in response to 12 weeks of HIIT or RT is displayed. Dots represent individual participants. *P < 0.05. CK The global proteomic, phosphoproteomic, and acetylproteomic responses in skeletal muscle to HIIT (red panels, n = 7) or RT (blue panels, n = 7) is shown. Dots in volcano plots represent individual proteins, phosphopeptides, or acetylpeptides. Proteins or PTM peptides with an adjusted p-value of <0.05 (equivalent to -log10 of 1.301) and an absolute fold-change (FC) ≥ ± 0.3 (equivalent to log2FC of 0.3785) were considered differentially expressed and colored in the graphs. C Global proteomic changes with HIIT. Inset; Among >5000 global proteins identified, approximately 9% were regulated by HIIT. D Global proteomic changes with RT. Inset; Among >5000 global proteins identified, approximately 3% were regulated by RT. E Venn diagram shows the number of unique and similar HIIT- and RT-regulated proteins. F Phosphoproteomic changes with HIIT. Inset; Among >9000 phosphopeptides identified, approximately 3% were regulated by HIIT. G Phosphoproteomic changes with RT. Inset; Among >11,000 phosphopeptides identified, approximately 7% were regulated by RT. H Number of unique and similar HIIT- and RT-regulated proteins with at least one exercise training-regulated phospho motif (phosphoproteins). I Acetylproteomic changes with HIIT. Inset; Among >2200 acetylpeptides identified, approximately 22% were regulated by HIIT. J Acetylproteomic changes with RT. Inset; Among >1800 acetylpeptides identified, approximately 1% were regulated by RT. K Venn diagram shows the number of unique and similar HIIT- and RT-regulated proteins with at least one exercise training-regulated acetyl motif (acetylproteins). Statistical significance was assessed by paired two-sided Student’s t-test in (b). Two-sided paired t-test with Benjamini–Hochberg correction for multiple comparisons was used for (cj). Source data are provided as a Source Data file.
Fig. 3
Fig. 3. Enhanced mitochondrial function with high-intensity aerobic Interval Training (HIIT) coincides with greater mitochondrial protein acetylation and abundance.
A The top 20 HIIT-regulated acetylproteins (based on the number of HIIT-regulated acetylpeptides) are shown (n = 7). B The number of HIIT- or RT-regulated acetylpeptides on TCA cycle and electron transport chain related enzymes are listed in the table. Note, RT did not regulate acetylation on any of the listed enzymes. C Three proteins (all myosin heavy chain isoforms) were identified in the RT group (n = 7) with more than one RT-regulated acetylpeptide. D The HIIT- and RT-induced change in TCA cycle and electron transport chain enzyme protein abundance is shown in the heatmap. E Diagram of HIIT-regulation of TCA cycle and electron transport chain protein abundance, post-translational modifications, and metabolite concentration, created in BioRender. Pataky, M. (2025). The HIIT-induced increase in protein abundance or TCA cycle metabolite concentration are depicted by darker shades of orange and yellow, respectively. Significantly increased acetylation or phosphorylation by HIIT on a given reside is depicted by blue or pink circles, respectively. No protein, metabolite, or PTM residue were significantly decreased by HIIT. Source data are provided as a Source Data file.
Fig. 4
Fig. 4. Phospho-regulation of contractile and cytoskeletal proteins highlight the resistance exercise training response in skeletal muscle.
The top 20 (A) HIIT- and (B) RT-regulated phosphoproteins (based on the number of HIIT- or RT-regulated phosphopeptides) are shown (n = 7 per group). C, D Upstream kinase enrichment analysis shows significantly activated (dark blue or red) or inhibited (light blue or red) predicted kinases in response to (C) RT or (D) HIIT. (E) A comparison of the directional change (activation vs inhibition) in significantly (FDR < 0.05) regulated kinase activity is plotted. Colors of dots represent kinases predicted to be regulated by only RT (blue), only HIIT (red), or both RT and HIIT (purple). F Diagram of RT-regulation of post-translational modifications to skeletal muscle contractile proteins, Created in BioRender. Pataky, M. (2025). Significantly increased phosphorylation or acetylation by RT on a given reside is depicted by pink or blue circles, respectively. Significantly decreased phosphorylation or acetylation by RT on a given reside is depicted by purple or yellow circles, respectively. Two-sided paired t-test with Benjamini–Hochberg correction for multiple comparisons was used for (C, D). Source data are provided as a Source Data file.
Fig. 5
Fig. 5. Despite similar transcriptomic responses, the human skeletal muscle metabolomic and phosphoproteomic responses were more robust following acute aerobic versus acute resistance exercise.
A Acute exercise study design, created in BioRender. Pataky, M. (2025). B Change in skeletal muscle mRNA expression (60 min-post versus pre-exercise) in response to acute aerobic (AAE, left panel, n = 8 total, 6 male and 2 female) or acute resistance exercise (ARE, right panel, n = 6 total, 3 male and 3 female). Dots represent individual mRNA. Transcripts with corrected false discovery rate <0.05 and absolute fold-change (FC) ≥ ± 0.5 were considered differentially expressed and colored. C Upregulated Hallmark pathways are plotted based on normalized enrichment score (NES). D Change (Δ) in plasma metabolite concentrations at 1, 30, and 60 min after AAE (n = 10) or ARE (n = 19) are expressed as fold-change. Plasma metabolite concentration was considered significantly altered if p < 0.05 and fold-change >0.1. E AAE- and ARE-induced change (Δ) in muscle metabolite concentrations at 10 and 60 min post-exercise (versus pre-exercise) are expressed as fold-change. Muscle metabolite concentration was considered significantly altered if p < 0.05 and fold-change >0.15. F, G Skeletal muscle phosphoproteome (10min-post versus pre-exercise) in response to AAE (n = 8) or ARE (n = 8). Dots represent individual phosphopeptides. Phosphopeptides with adjusted p-value of <0.05 and absolute FC ≥ ± 0.3 were considered differentially expressed and colored. H Number of unique and similar AAE- and ARE-regulated proteins with at least one exercise-regulated phopsho-site (phosphoproteins). I, J Representative immunoblots of established exercise-responsive phosphoproteins with quantifications are displayed as lines representing individual participants (n = 7 per group) (normalized to the average across all samples on blot). K, L Change in muscle acetylproteome (K) and global proteome (L) (10 min-post versus pre-exercise) after AAE (left panel) or ARE (right panel). Dots represent individual acetyl-peptides and proteins, respectively. Proteins or acetyl-peptides with adjusted p-value < 0.05 and absolute fold-change ≥ ±0.3 were considered differentially expressed and colored. M The AAE-induced change in significantly AAE-regulated phosphopeptides (red bars) plotted with corresponding change in protein abundance (black bars). Statistical significance in (D, E) was assessed using two-way ANOVA with Bonferroni correction for multiple comparisons. Two-sided paired t-test with Benjamini–Hochberg correction for multiple comparisons was used for (FM). Two-sided paired t-tests were used for (J). Source data are provided as a Source Data file.
Fig. 6
Fig. 6. Acute aerobic exercise robustly regulates phosphorylation of the ribosomal chaperone NACA.
The top 20 (A) AAE and (B) ARE phospho-regulated proteins (based on the number of AAE- or ARE-regulated phosphopeptides), are shown (n = 8 per group). LIMCH1  LIM and calponin homology domains-containing protein 1, SPEG Striated muscle preferentially expressed protein kinase, CMYA5 Cardiomyopathy-associated protein 5, AHNAK = Neuroblast differentiation-associated protein, MAP1B Microtubule-associated protein 1B, MAP1A = Microtubule-associated protein 1A, MAPT = Microtubule-associated protein tau, HSPB1 = Heat shock protein beta-1. C, D Volcano plots of all AAE- or ARE-regulated phosphopeptides is shown with significantly regulated NACA phosphopeptides highlighted in red or blue, respectively. E The top 15 AAE-regulated phosphopeptides on NACA (based on fold change) with a single identified phospho-acceptor site are shown with red and blue lines representing the change for each individual participant following AAE (n = 8) and ARE (n = 8), respectively. ND not detected. F NACA transcripts are unchanged at 60 min post AAE (n = 8) or ARE (n = 6). G NACA protein abundance in unchanged at 10 min post AAE (n = 8) or ARE (n = 8) (when AAE-induced NACA phosphorylation is enhanced). H Following its activation by phosphorylation, which occurs after AAE, NACA functions as a ribosomal chaperone to direct nascent polypeptides to the correct intracellular location. Created in BioRender. Pataky, M. (2025). I Significantly AAE-regulated (FDR < 0.05) upstream predicted upstream kinases were determined by kinase enrichment analysis. Kinases are grouped and colored based on known protein family/sub-family. Bar direction (up or down) indicate activation or inhibition of predicted kinase. Two-sided paired t-test with Benjamini–Hochberg correction for multiple comparisons was used for (CE). Statistical significance was assessed by paired two-sided Student’s t-test in (F, G). Source data are provided as a Source Data file.
Fig. 7
Fig. 7. Summary of the acute and chronic molecular responses to different exercise training modes.
The acute and chronic molecular responses to aerobic and resistance exercise lead to some distinct and some similar phenotypic adaptations.

Similar articles

References

    1. Robinson, M. M. et al. Enhanced protein translation underlies improved metabolic and physical adaptations to different exercise training modes in young and old humans. Cell Metab.25, 581–592 (2017). - PMC - PubMed
    1. Hickson, R., Bomze, H. & Holloszy, J. Linear increase in aerobic power induced by a strenuous program of endurance exercise. J. Appl. Physiol.42, 372–376 (1977). - PubMed
    1. Holloszy, J. O. Biochemical adaptations in muscle: effects of exercise on mitochondrial oxygen uptake and respiratory enzyme activity in skeletal muscle. J. Biol. Chem.242, 2278–2282 (1967). - PubMed
    1. Koh, J.-H. et al. Enhancement of anaerobic glycolysis–a role of PGC-1α4 in resistance exercise. Nat. Commun.13, 1–15 (2022). - PMC - PubMed
    1. Stocks, B. & Zierath, J. R. Post-translational modifications: the signals at the intersection of exercise, glucose uptake, and insulin sensitivity. Endocr. Rev.43, 654–677 (2022). - PMC - PubMed

Publication types

Associated data