. 2025 Jul 1;16(1):5578.
doi: 10.1038/s41467-025-60586-8.

Bioactive lipid mediator class switching regulates myogenic cell progression and muscle regeneration

Affiliations

Bioactive lipid mediator class switching regulates myogenic cell progression and muscle regeneration

Paul Fabre et al. Nat Commun. .

Abstract

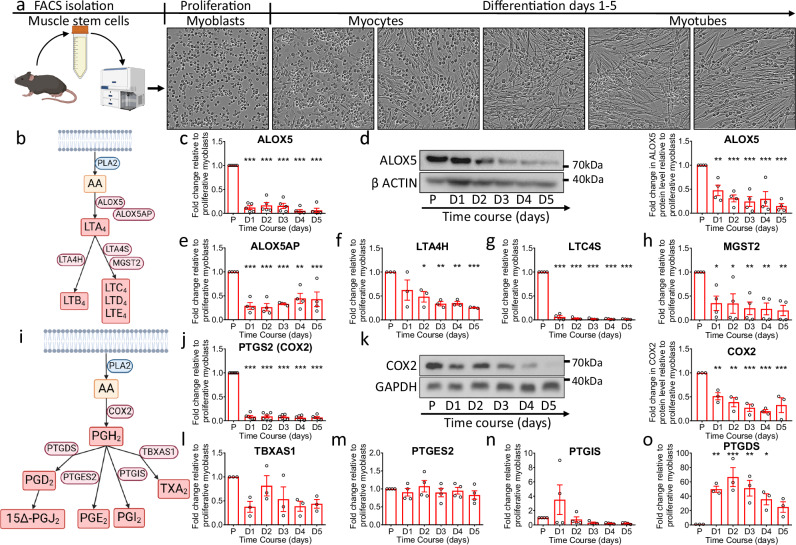
The muscle stem cell niche is well-described as influencing myogenic cell fate decision; however, the intrinsic mechanisms driving muscle stem cell progression during myogenesis are not yet fully elucidated. Here, we demonstrate that bioactive lipid class switching, an auto-regulatory mechanism originally described during the inflammatory process, is conserved during myogenesis. During the transition from proliferation to differentiation, myogenic cells shift from pro-inflammatory to pro-resolution pathways, a process partially mediated by 15Δ-PGJ2 that promotes the expression of the prostaglandin inactivation enzyme 15-hydroxyprostaglandin dehydrogenase. Using pharmacological inhibitors and knockout models of the pro-resolution enzyme 15-lipoxygenase, we show that blocking the bioactive lipid class switching impairs myoblast differentiation in vitro and muscle regeneration in vivo. Administration of the pro-resolving mediator Protectin-D1 restores myogenesis, enhances muscle regeneration post-injury and improves muscle phenotype in a dystrophic mouse model. Overall, these findings provide a better comprehension of the mechanisms regulating myogenic progression, which opens new therapeutic avenues for muscle regeneration and dystrophies.


Conflict of interest statement

Competing interests: The authors declare no competing interests.

Figures

Fig. 1
Fig. 1. Reduction in pro-inflammatory bioactive lipid biosynthesizing enzymes during myogenic progression.
a Graphical overview of the myoblast isolation, culture, and differentiation experiment (Created in BioRender). b Graphical representation of the leukotriene synthesis cascade (Created in BioRender). c–h Expression of leukotriene synthesis enzymes quantified by qPCR: Alox5 (c) (P vs. D1 p < 0.0001; P vs. D2 p < 0.0001; P vs. D3 p < 0.0001; P vs. D4 p < 0.0001; P vs. D5 p < 0.0001), Alox5ap (e) (P vs. D1 p < 0.0001; P vs. D2 p < 0.0001; P vs. D3 p = 0.0002; P vs. D4 p = 0.0012; P vs. D5 p < 0.0009), Lta4h (f) (P vs. D2 p = 0.0133; P vs. D3 p = 0.0023; P vs. D4 p = 0.0026; P vs. D5 p = 0.0009), Ltc4s (g) (P vs. D1 p < 0.0001; P vs. D2 p < 0.0001; P vs. D3 p < 0.0001; P vs. D4 p < 0.0001; P vs. D5 p < 0.0001), Mgst2 (h) (P vs. D1 p = 0.0124; P vs. D2 p = 0.0116; P vs. D3 p = 0.0038; P vs. D4 p = 0.0033; P vs. D5 p = 0.0022). d, k Representative Western Blots and quantification of the enzymes ALOX5 (d) (P vs. D1 p = 0.0045; P vs. D2 p = 0.0003; P vs. D3 p = 0.0001; P vs. D4 p = 0.0003; P vs. D5 p < 0.0001) and COX-2 (k) (P vs. D1 p = 0.0073; P vs. D2 p = 0.0013; P vs. D3 p = 0.0003; P vs. D4 p = 0.0001; P vs. D5 p = 0.0006) expression during myogenesis (relative to GAPDH or β-actin as loading control). i Graphical representation of the prostaglandin synthesis cascade (Created in BioRender). j, l–o Expression of prostaglandin synthesis enzymes quantified by qPCR: Ptgs2 (j) (P vs. D1 p < 0.0001; P vs. D2 p < 0.0001; P vs. D3 p < 0.0001; P vs. D4 p < 0.0001; P vs. D5 p < 0.0001), Tbxas1 (l), Ptges2 (m), Ptgis (n), Ptgds (o) (P vs. D1 p = 0.0061; P vs. D2 p = 0.0006; P vs. D3 p = 0.0050; P vs. D4 p = 0.0489). Results are expressed as mean +/- SEM. Biological replicates n = 5 for panel c; n = 4 for panels d, e, g, h, m, n; n = 6 for panel j; n = 3 for panels f, k, l, o. *p < 0.05, **p < 0.01, *** p < 0.001. One-Way ANOVA with Dunnett’s multiple comparisons test. Source data are provided as a Source Data file.
Fig. 2
Fig. 2. Increase in pro-resolving lipid biosynthesizing enzymes during myogenic progression.
a Graphical representation of the pro-resolving lipid mediator cascade (Created in BioRender). b, c, e Expression of pro-resolving enzymes quantified by qPCR: Pla2g2d (b) (P vs. D3 p = 0.0413; P vs. D4 p = 0.0088; P vs. D5 p = 0.0218), Alox15 (c) (P vs. D3 p = 0.0487; P vs. D4 p = 0.0057) and Alox12 (e) (P vs. D3 p = 0.0169). d Representative Western Blots and quantification of the enzyme ALOX15 during myogenesis (relative to β-actin as loading control) (P vs. D5 p = 0.0133). f Expression of the prostaglandin-degrading enzyme Hpgd quantified by qPCR (P vs. D4 p = 0.0430; P vs. D5 p = 0.0002). g Expression of Ptgs2 after 24 h treatment with prostaglandins PGE2 (250 nM) or vehicle (p = 0.0221). h Expression of Hpgd after 24 h treatment with prostaglandins PGE2 (250 nM), PGD2 (250 nM) and 15Δ-PGJ2 (250 nM) (Veh vs PGE2 p = 0.0103; Veh vs 15Δ-PGJ2 p = 0.0155). i Expression of Ptgs2, Ptges, Hpgd, Ptgds, and Myog from single cell RNA sequencing dataset (Oprescu SN et al. iScience 2020) from uninjured, 0.5, 2, 3.5, 5, 10, and 21 days post-injury (dpi) in WT muscle. j Proportion of cells expressing Ptgds in MuSCs (Pax7+MyoD-), myoblasts (Pax7-MyoD + ), or differentiated myoblasts (Pax7-Myog + ) in WT muscle at 3.5 dpi (Oprescu SN et al. iScience 2020). Results are expressed as mean +/- SEM. Biological replicates n = 3 for panels b, d, f; n = 6 for panels c, e; n = 4 for panel g; n = 5 for panel h (except n = 3 for PGD2 and 15Δ-PGJ2 groups). *p < 0.05, **p < 0.01, *** p < 0.001. 2-way Paired t-test (g, h), One-way ANOVA with Dunnett’s multiple comparisons test (b, c, d, e, f). Source data are provided as a Source Data file.
Fig. 3
Fig. 3. Targeted lipidomics identifies the bioactive lipid class switching from pro-inflammatory lipids to pro-resolving lipids during myogenic progression.
a Graphical representation of the pro-inflammatory and pro-resolving lipid mediator cascade (green). Bioactive lipid receptors are identified in gray boxes. (Created in BioRender). b–e, j–m Quantification by mass spectrometry (LC-MS/MS) of lipid mediator levels measured in the medium of proliferating vs differentiating myoblasts (day 1, 3, 5): PGF2a (b) (P vs. D1 p = 0.0134; P vs. D3 p = 0.0329), PGE2 (c) (P vs. D1 p = 0.0134; P vs. D3 p = 0.0329), TXB2 (d) (P vs. D1 p = 0.0001; P vs. D3 p = 0.0007; P vs. D5 p = 0.0009), PGD2 (e), 15(R)-LXA4 (j) (P vs. D1 p = 0.0076; P vs. D3 p = 0.0027; P vs. D5 p = 0.0065), RvE1 (k), RvD5n-3 DPA (l) (P vs. D1 p = 0.0096), PDX (m). f–i,n–q Quantification by qPCR of bioactive lipid receptors’ expression in myogenic cells during myogenesis in vitro: Ptgfr (f) (P vs. D1 p < 0.0001; P vs. D3 p < 0.0001; P vs. D5 p < 0.0001), EP4 (g) (P vs. D1 p < 0.0001; P vs. D3 p < 0.0001; P vs. D5 p < 0.0001), Tbxa2r (h), DP2 (i) (P vs. D5 p = 0.0176), Fpr2 (n) (P vs. D1 p < 0.0001; P vs. D3 p = 0.0003; P vs. D5 p < 0.0001), Cmklr1 (o), Gpr101 (p) (P vs. D5 p = 0.0150), Gpr37 (q) (P vs. D5 p = 0.0068). a–q Pro-inflammatory lipids and receptors are identified in red, pro-resolving lipids and receptors are identified in green, and PGD2/DP2 that play a role in triggering the switch are identified in orange. Results are expressed as mean +/- SEM. Biological replicates n = 4 for panels b–d, g, j, l, n–q; n = 3 for panels e, f, h, i, k, m. *p < 0.05, **p < 0.01, *** p < 0.001. Repeated measure one-way ANOVA with Dunnett’s multiple comparisons test (b–e, j–m), One-way ANOVA with Dunnett’s multiple comparisons test (f–i, n–q). Source data are provided as a Source Data file.
Fig. 4
Fig. 4. Lack of Alox15 impairs bioactive lipid class switching and blocks myogenic cell differentiation.
a–h Quantification by mass spectrometry (LC-MS/MS) of bioactive lipid levels PGE2 (a), PGF2a (b), TXB2 (c) (P vs. D1 p = 0.0066; P vs. D3 p = 0.0220), PGD2 (d), LXA4 (e) (P vs. D3 p = 0.0142), 15(R)-LXA4 (f) (P vs. D1 p = 0.0029; P vs. D3 p = 0.0010; P vs. D5 p = 0.0020), RvD5n-3 DPA (g) (P vs. D1 p = 0.0303; P vs. D3 p = 0.0185), PDX (h) (P vs. D1 p = 0.0447) in the medium of wildtype (WT, black) and Alox15-knockout (Alox15-KO, red) myogenic cells during myogenesis. Results expressed as the fold change relative to proliferating myoblasts (asterisks indicate a significant difference in between Alox15-KO and WT at the same time point). i Growth curve of WT and Alox15-KO proliferating myoblasts. j Representative images of proliferating myoblasts immunostained for Pax7 (red), Myog (green), and DAPI (blue). Scale bars = 50 μm. k, l Quantification of the proportion of Pax7-expressing cells (MuSC/proliferative myoblasts) and Myog-expressing cells (differentiated myoblasts) in proliferating medium. m Representative images of differentiated myoblasts (day 1) immunostained for Pax7 (red), Myog (green), and DAPI (blue). Scale bars = 50 μm. n–p Quantification of the proportion of Pax7-expressing cells (MuSC/proliferative myoblasts) (n) (p = 0.0067), MyoD-expressing cells (committed myoblasts) (o) (p = 0.0125) and Myog-expressing cells (differentiated myoblasts) (p) (p = 0.0070) after 1 day in differentiation medium. q Fusion index of WT and Alox15-KO myogenic cells after 4 days in differentiation medium (p = 0.0115). Results are expressed as mean +/- SEM. Biological replicates n = 4 for WT and n = 3 for Alox15KO for panels (a–c, e–g); n = 3 for panels (d, h); n = 5 for panel (i); n = 6 for WT and n = 3 for Alox15KO for panel (k); n = 6 for WT and n = 4 for Alox15KO for panel (l); n = 9 for WT and n = 6 for Alox15KO for panels (n, p); n = 3 for WT and n = 4 for Alox15KO for panel (o); n = 4 for panel (q);. * p < 0.05, **p < 0.01, *** p < 0.001. Repeated measures 2-way ANOVA with Uncorrected Fisher’s LSD multiple comparisons test (a–i). 2 way Unpaired t-test (k, l, n–q). Source data are provided as a Source Data file.
Fig. 5
Fig. 5. ALOX15 pharmacological inhibition impairs human myogenic cells differentiation.
a–h Expression quantification by qPCR of the enzymes ALOX5 (a), ALOX5AP (b) (P vs. D3 p = 0.0037; P vs. D5 p = 0.0009; P vs. D7 p = 0.0008), PTGS2 (c) (P vs. D3 p = 0.0392), PTGDS (d) (P vs. D7 p = 0.0429), ALOX15 (e) (P vs. D3 p = 0.0089), and ALOX12 (f) in human myogenic cells during in vitro myogenesis. Pro-inflammatory enzymes are identified in red, pro-resolving enzymes are identified in green. g Growth curve of human myoblasts treated with the ALOX15 inhibitor PD146176 (10 μM, 20 μM) or vehicle (VEH) for 3 days in proliferation medium. h Representative images of human myogenic cells at 3 days of differentiation immunostained for Myosin heavy chain (MyHC, pink), Myog (green), and DAPI (blue). Scale bars = 50 μm. i Fusion index of human myoblasts treated with PD146176 (10 μM, 20 μM) or vehicle (VEH) for 3 days in differentiation medium (VEH vs. PD146176 10 uM p = 0.00141; VEH vs. PD146176 20 uM p = 0.0011). Results are expressed as mean +/- SEM. Biological replicates n = 3 for panels af; n = 5 for panels g, i. * p < 0.05, **p < 0.01, *** p < 0.001. One-way ANOVA with Dunnett’s multiple comparisons test (a–f). Repeated measure 2-way ANOVA with Uncorrected Fisher’s LSD multiple comparisons test (g). 2-way Paired t-test (i). Source data are provided as a Source Data file.
Fig. 6
Fig. 6. Alox15-KO mice display impaired regeneration.
a Schematic showing the timeline of cardiotoxin (CTX) injury experiment and muscle collection at 7- and 14-days post injury (dpi) (Created in BioRender). b Representative images of Pax7 (red), DAPI (blue) staining on muscle sections of tibialis anterior (TA) muscle of uninjured WT and Alox15-KO mice. Scale bars = 50 μm. c Quantification of Pax7+ cells in TA muscles of uninjured WT and Alox15-KO mice. d Representative images of H&E staining on muscle sections of TA muscle of uninjured WT and Alox15-KO mice. Scale bars = 50 μm. e Quantification of the minimal fiber diameter (MFD) in TA muscles of uninjured WT and Alox15-KO mice. f Representative images of Pax7 (red), Myog (green), DAPI (blue) staining on muscle sections of TA muscle of WT and Alox15-KO mice at 7 dpi. Scale bars = 50 μm. g, h Quantification of the number of Pax7+ (g) (p = 0.0287) and Myog+ (h) (p = 0.0022) cells in TA muscles of WT and Alox15-KO mice at 7 dpi. i Representative images of H&E staining on muscle sections of TA muscle of WT and Alox15-KO mice at 7 dpi. Scale bars = 50 μm. j Quantification of the minimal fiber diameter in TA muscles of WT and Alox15-KO mice at 7 dpi (p = 0.0377). k Representative images of Pax7 (red), Myog (green), DAPI (blue) staining on muscle sections of the TA muscle of WT and Alox15-KO mice at 14 dpi. Scale bars = 50 μm. l, m Quantification of the number of Pax7+ (l) and Myog+ (m) (p = 0.0143) cells in the TA muscles of WT and Alox15-KO mice at 14 dpi. n Representative images of H&E staining on muscle sections of the TA muscles of WT and Alox15-KO mice at 14 dpi. Scale bars = 50 μm. o Quantification of the minimal fiber diameter in the TA muscles of WT and Alox15-KO mice at 14 dpi (p = 0.0355). p Schematic showing the timeline of mdx mice CTX-injury experiment followed by the transplantation of WT and Alox15-KO myoblasts in the right and left TA muscles at 3 DPI and muscle collection at 14 dpi (Created in BioRender). q Representative images of Dystrophin (pink), WGA (green), DAPI (blue) staining on muscle sections of TA muscle of mdx mice at 14 dpi. Scale bars = 75 μm. r Quantification of Dystrophin+ myofibers in TA muscles of mdx mice at 14 dpi transplanted with WT or Alox15-KO myoblasts (p = 0.0336). Results are expressed as mean +/- SEM. Black bars represent the WT group and red bars are the Alox15-KO group. Biological replicates n = 5 for panel (c); n = 3 for panel (e); n = 3 for WT and n = 6 for Alox15KO for panels (g, h, l, m); n = 4 for panels (j, r); n = 3 for WT and n = 7 for Alox15KO for panel (o). * p < 0.05, **p < 0.01, *** p < 0.001. 2-way Unpaired t-test. Source data are provided as a Source Data file.
Fig. 7
Fig. 7. Protectin D1 enhances muscle regeneration.
a Representative micrographs showing myosin heavy chain (MyHC, fuchsia) and DAPI (nuclei, blue) staining on myoblasts differentiated for 2 days and treated (twice per day) with Vehicle (Veh) or protectin-D1 (PD1). Scale bars = 50 μm. b Quantification of the fusion index of WT myoblasts differentiated for 2 days and treated with Vehicle (Veh) or protectin-D1 (PD1) (p = 0.0017). c, d Representative Western blots and quantification of ERK1/2 phosphorylation in myoblasts treated with PD1 for 0, 15, 30, 60, 120 min (0 vs. 30 p = 0.0282; 0 vs. 60 p = 0.0191). e Schematic showing the timeline of daily intraperitoneal (i.p.) injection of Protectin-D1 (PD1, 5 ug/kg/day), or vehicle (Veh) in Alox15-KO mice after cardiotoxin (CTX) injury (Created in BioRender). f Representative images of Laminin (green), DAPI (blue) staining on muscle sections of tibialis anterior (TA) muscle of Alox15-KO mice at 7 dpi (dpi) and injected daily with PD1 or Veh. Scale bars = 50 μm. g–i Quantification of Pax7+ cells (g) (p = 0.0494), Myog+ cells (h), and the minimal fiber diameter (MFD) (i) (p = 0.0301) in the TA muscles of Alox15-KO mice at 7 dpi (dpi) and injected daily with PD1 or Veh. j Representative images of embryonic MyHC (MYH3, green), Wheat Germ Agglutinin (WGA; connective tissue marker; red), DAPI (nuclei, blue) staining on sections of the TA muscle of Alox15-KO mice at 7 dpi and injected daily with PD1 or Veh. Scale bars = 50 μm. k Quantification of the number of MYH3+ myofibers in the TA muscles of Alox15-KO mice at 7 dpi and injected daily with PD1 or Veh (p = 0.0348). l Representative images of Dystrophin (fuchsia) and DAPI (nuclei, blue) staining on sections of the TA muscle of Alox15-KO mice at 7 dpi and injected daily with PD1 or Veh. Scale bars = 50 μm. m Quantification of the number of Dystrophin+ myofibers in the TA muscles of Alox15-KO mice at 7 dpi and injected daily with PD1 or Veh (p = 0.0018). n Representative images of Laminin (green) and DAPI (blue) staining on muscle sections of the TA muscle of Alox15-KO mice at 14 dpi and injected daily with PD1 or Veh. Scale bars = 50 μm. o–q Quantification of Pax7+ cells (o), Myog+ cells (p), and the minimal fiber diameter (q) (p = 0.025) in the TA muscles of Alox15-KO mice at 14 dpi and injected daily with PD1 or Veh. Results are expressed as mean +/- SEM. Black bars represent the Alox15-KO group and blue bars are Alox15-KO + PD1 group. n = 3 for panels (b, k, m); n = 5 panel (d); n = 6 for Alox15KO and n = 3 for Alox15KO + PD1 for panels (g, h, o, p); n = 4 for Alox15KO and n = 3 for Alox15KO + PD1 for panel (i); n = 7 for Alox15KO and n = 3 for Alox15KO + PD1 for panel (q). *p < 0.05, **p < 0.01, *** p < 0.001. 2-way Paired t-test (b), One-way repeated measure ANOVA with Uncorrected Fisher’s LSD multiple comparisons (d), 2-way unpaired t-test (g–i, k, m, o–q). Source data are provided as a Source Data file.
Fig. 8
Fig. 8. Protectin D1 promotes muscle regeneration in mdx mice.
a Schematic showing the timeline of daily intraperitoneal (i.p.) injection of Protectin-D1 (PD1, 5 ug/kg/day), or vehicle (Veh) in mdx mice for 21 days (Created in BioRender). b Representative micrographs of Pax7 (red), Myog (green), and DAPI (nuclei, blue) staining on sections of the tibialis anterior (TA) muscles of mdx mice treated with PD1 or vehicle. Scale bars = 50 μm. c, d Quantification of the number of Pax7+ (c) (p = 0.0137), and Myog+ (d) (p = 0.0303) cells in muscles of mdx mice after 21 days of PD1 or Veh treatment. e Representative micrographs of Laminin (green), DAPI (nuclei, blue) staining on muscle sections of the TA muscle of mdx mice after 21 days of PD1 or Veh treatment. Scale bars = 50 μm. f, g Quantification of the cross-sectional area (f) (p = 0.0414) and number of myonuclei per fiber (g) (p = 0.0376) in the TA muscles of mdx mice after 21 days of PD1 or Veh treatment. h Isometric contractile properties of EDL muscles showing the specific force of mdx mice treated daily for 21 days with PD1 or Veh (80hz p < 0.0017; 100hz; p < 0.0001; 150hz; p = 0.0005). Results are expressed as mean +/- SEM. Black bars represent the mdx group and blue bars are mdx + PD1 group. Biological replicates n = 4 for panel c, n = 6 for panel d; n = 5 for mdx and n = 6 for mdx + PD1 for panels (f, g); n = 5 for panel (h). *p < 0.05, **p < 0.01, *** p < 0.001. 2-way Unpaired t-test (c, d, f, g), 2-way ANOVA with Uncorrected Fisher’s LSD multiple comparisons test (h). Source data are provided as a Source Data file.

References

    1. Mauro, A. Satellite cell of skeletal muscle fibers. J. Biophys. Biochem Cytol.9, 493–495 (1961). - PMC - PubMed
    1. Snow, M. H. Myogenic cell formation in regenerating rat skeletal muscle injured by mincing. II. An autoradiographic study. Anat. Rec.188, 201–217 (1977). - PubMed
    1. Schultz, E., Gibson, M. C. & Champion, T. Satellite cells are mitotically quiescent in mature mouse muscle: an EM and radioautographic study. J. Exp. Zool.206, 451–456 (1978). - PubMed
    1. Kuang, S., Gillespie, M. A. & Rudnicki, M. A. Niche regulation of muscle satellite cell self-renewal and differentiation. Cell Stem Cell2, 22–31 (2008). - PubMed
    1. Dort, J., Fabre, P., Molina, T. & Dumont, N. A. Macrophages are key regulators of stem cells during skeletal muscle regeneration and diseases. Stem Cells Int.2019, 4761427 (2019). - PMC - PubMed

MeSH terms

Substances

LinkOut - more resources