. 2025 Jul 1;16(1):5589.
doi: 10.1038/s41467-025-60664-x.

A large C-terminal Rad52 segment acts as a chaperone to Form and Stabilize Rad51 Filaments

Affiliations

A large C-terminal Rad52 segment acts as a chaperone to Form and Stabilize Rad51 Filaments

Emilie Ma et al. Nat Commun. .

Abstract

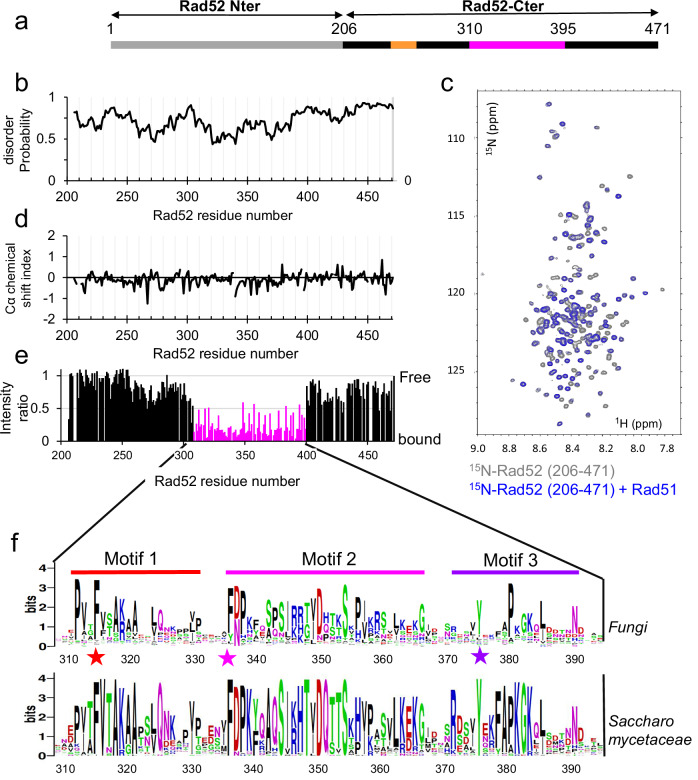
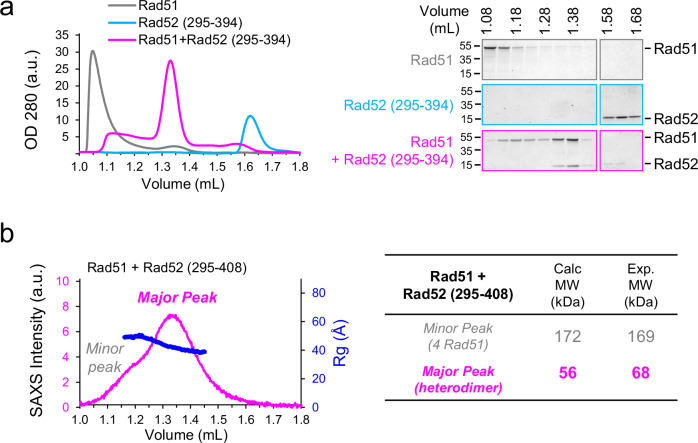
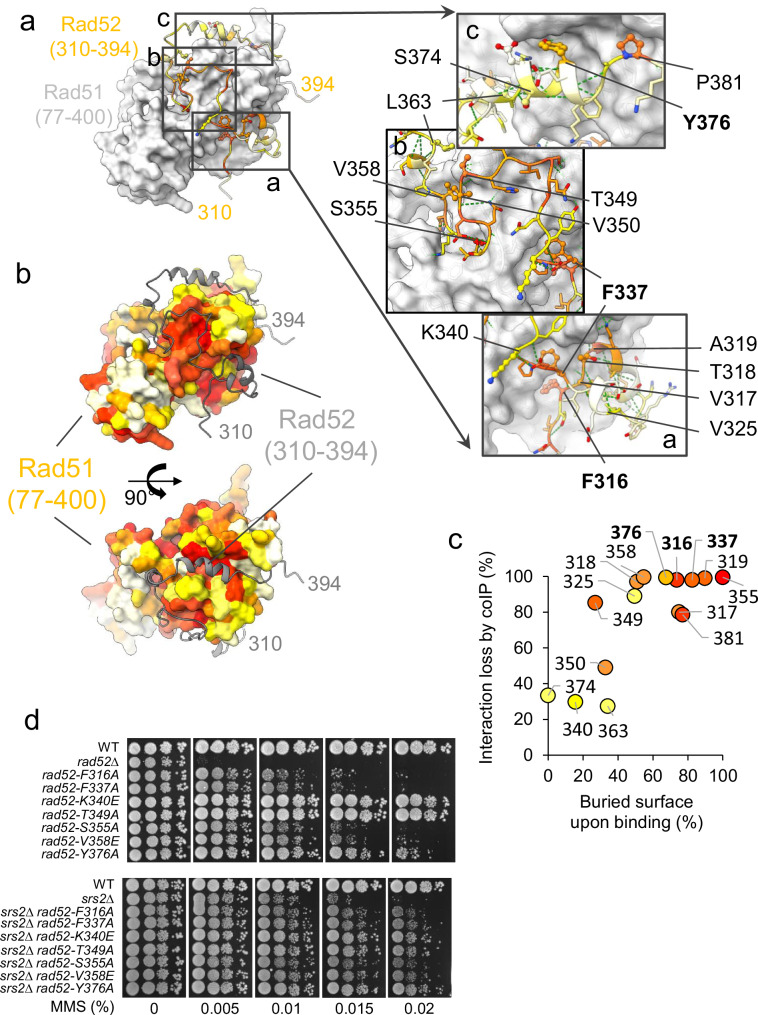
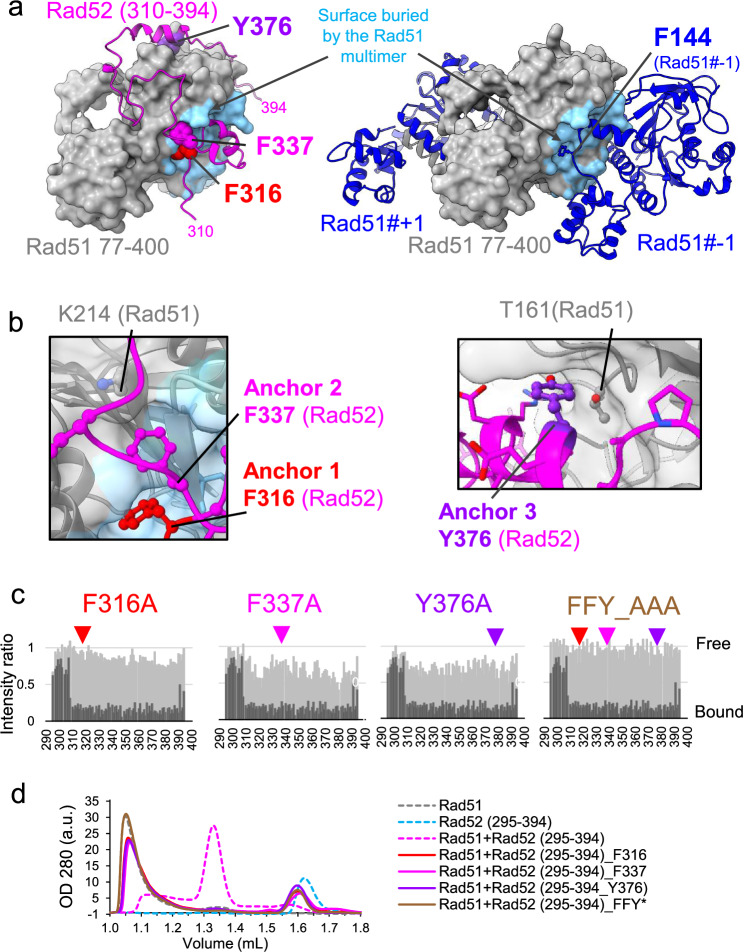
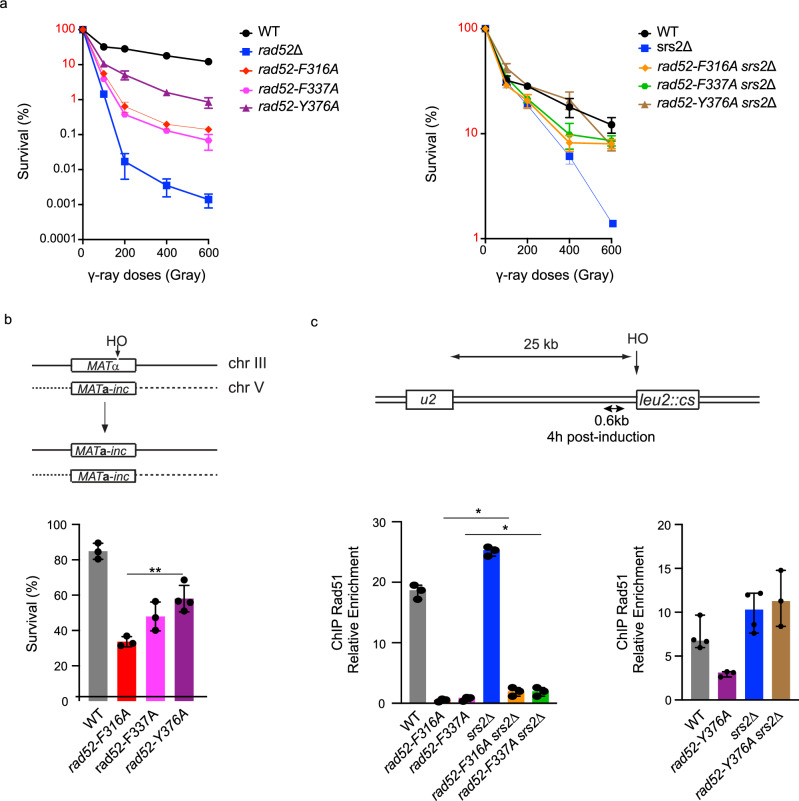
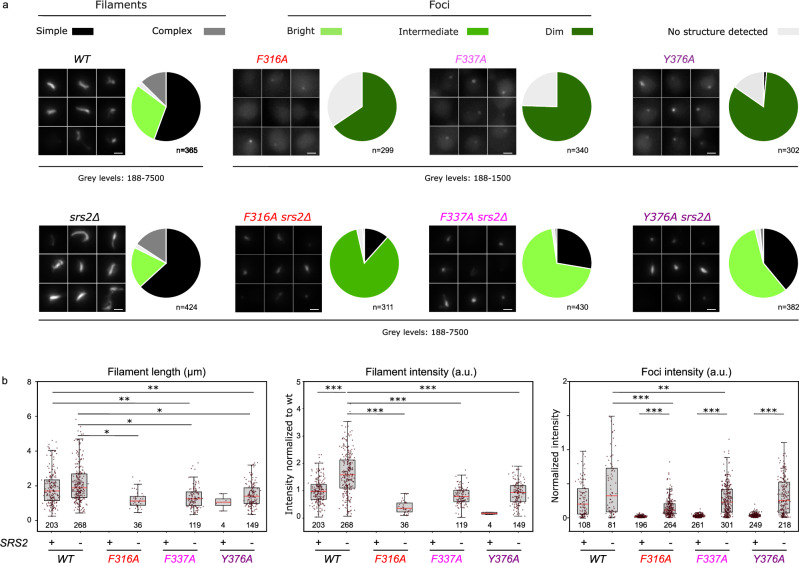
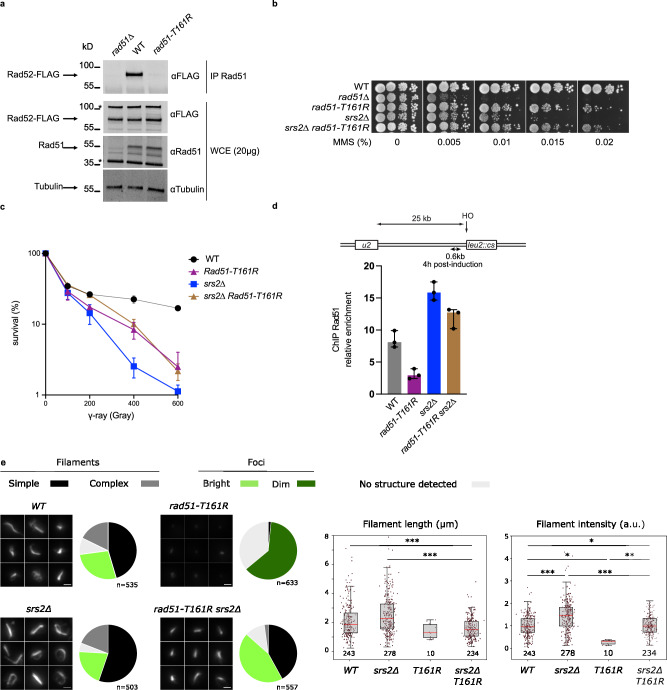
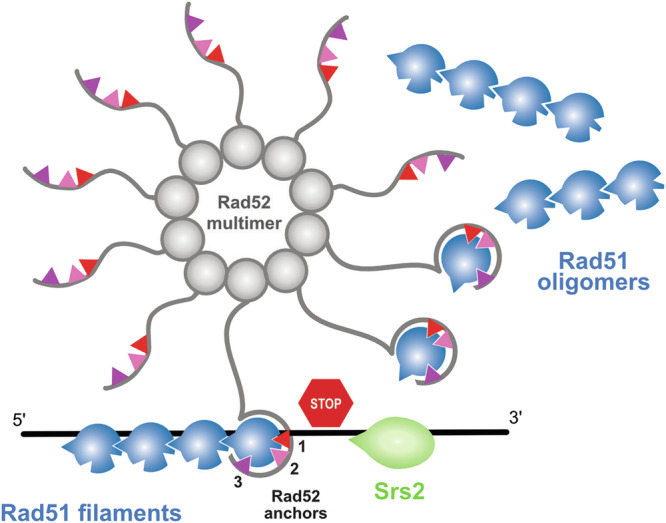
Homologous recombination (HR) is essential for the repair of DNA double-strand breaks and the restart of stalled replication forks. A critical step in HR is the formation of Rad51 nucleofilaments, which perform homology search and strand invasion of a homologous DNA sequence required for repair synthesis. In the yeast Saccharomyces cerevisiae, Rad52 facilitates Rad51 nucleofilament formation by mediating Rad51 loading onto ssDNA and counteracting Rad51 filament dissociation by the DNA translocase Srs2. The molecular basis of these two Rad52 functions remains unclear. Our integrative structural analyses of the Rad51-Rad52 interaction, combining NMR, SAXS, and modeling, reveal that an 85-residue segment of Rad52, conserved in fungi, folds upon binding to a broad surface of a Rad51 monomer. Notably, it includes an FxxA motif conserved in the BRC repeats of BRCA2 and at the Rad51-Rad51 interface. This binding mode was validated through an extensive set of mutations. Using in vivo assays and a functional fluorescent GFP-Rad51 fusion protein, we demonstrated that this entire segment is critical for Rad51 filament formation. These findings highlight how Rad52 functions as an assembly chaperone by preventing Rad51 oligomerization, promoting nucleation of Rad51 nucleofilaments on ssDNA, and counteracting the effects of Srs2 on destabilizing Rad51 filaments.


Conflict of interest statement

Competing interests: The authors declare no competing interests.

Figures

Fig. 1
Fig. 1. Rad52 C-ter is disordered and interacts with Rad51 with a central region of 85 residues.
a General organization of Rad52 domains. The C-terminal domain is shown in black, with the region interacting with Rad51 in magenta, and the RPA binding region in orange. b Predicted disorder of Rad52-Cter domain (206-471) (see Materials and Methods). c 1H-15N SOFAST-HMQC spectrum of the uniformly 15N labeled Rad52-Cter domain (206-471) alone in gray and in blue, after addition of equimolar amount of unlabeled Rad51. d Cα chemical shift index calculated for all assigned residues of the Rad52-Cter domain (206-471). The values close to zero of this index show that this domain is fully disordered, consistent with the predictions. e Mapping of the interaction between Rad52-Cter domain (206–471) and Rad51, using the intensities ratio (I/I0), where I and I0 are the intensity of the signals 1H-15N SOFAST-HMQC spectra before and after addition of Rad51, respectively. f Sequence Logo of the central region of the Rad52-Cter domain (310–395) generated with homologues of Rad52 in fungi or in Saccharomycetaceae. F316 (Anchor 1), F337 (Anchor 2), and Y376 (Anchor 3) located in each conserved motif and mutated in this study are highlighted with a star. Disorder prediction, Cα chemical shift index and intensities ratio are provided in the Source Data file.
Fig. 2
Fig. 2. Rad52 C-ter forms a 1:1 complex with Rad51 and prevents Rad51 oligomerization.
a Left panel: SEC profile analysis of Rad51, Rad52 (295–394) and Rad51+Rad52 (295–394) in a 1:1 ratio. Right panel: SDS-PAGE analysis of fraction from SEC profile in left panel revealed with coomassie blue. Position of molecular weight markers are indicated (in kDa), images representative of 2 independent experiments. Uncropped blots are provided in the Source Data file. b SAXS data for the 1:1 complex between Rad51+Rad52 (295–408). Left panel: Series intensity (magenta, left axis) vs. elution volume, and, if available, radius of gyration (Rg) vs. elution volume (blue, right axis). The profile includes a major and a minor peak. The deconvolution of these peaks is shown in Supplementary Fig. 2B. Right panel: Molecular weight calculated with SAXS data (Exp. MW) compared to theoretical MW (Calc. MW) for the major and minor peaks. The full dataset is provided in the Source Data file.
Fig. 3
Fig. 3. Rad52 (310–394) folds upon binding Rad51 burying a large conserved surface.
a Left panel: Best AlphaFold2 model of the complex between Rad51 (77–400) (gray surface) and Rad52 (310–394) (colored according to sequence conservation: from red for the highest conservation to white). Three boxes highlight zoomed-in regions shown in the right panels. Right panels: the side chains of Rad52 residues interacting with Rad51 are depicted as sticks, with mutated residues represented in ball-and-stick. Labels point to the C-alpha carbons of the mutated residues. Green dashed lines highlight hydrogen bonds. b AlphaFold2 model of the Rad51 (77–400) complex with its surface colored according to sequence conservation and Rad52 (310–394) shown as a gray cartoon. Two perpendicular orientations are provided in the upper and lower panels, respectively. c Interaction loss (%) plotted as a function of the surface area of each residue buried upon interaction. Interaction loss was determined by the intensity ratio between mutant and WT Rad52 co-immunoprecipitated with Rad51. d Serial 10-fold dilutions of haploid strains bearing different RAD52 mutations of residue involved in the interaction, spotted onto rich medium (YPD) containing different MMS concentrations. Upper panel: SRS2 background, lower panel: srs2∆ background. Source data are provided in the Source Data file.
Fig. 4
Fig. 4. Rad52 (310–394) competes with Rad51 oligomers through the cooperative binding of several anchors.
a Left panel, best AlphaFold2 model of the complex between Rad51 (77–400) (gray surface) and Rad52 (310–394) (colored in magenta). The three key residues mutated are highlighted with balls. Right panel, structure of three Rad51 monomers assembled in a multimer (PDB code 1SZP). The central protein is truncated (Rad51 (70–400) and shown as a gray surface), the two other Rad51 molecules (#-1 et #+1) are shown as cartoon in blue. Residue F144 side chain is highlighted. For both panels, the Rad51 surface buried upon formation of the Rad51 filament is colored in blue. b Zoomed-in of residues F316 and F337 (left panel) and Y376 (right panel). The Rad51 surface is shown with transparency to show the position of K214 and T161 from Rad51 contacting F337 and Y376, respectively. The Rad51 surface buried upon formation of the Rad51 filament is colored in blue. c In light gray, mapping of the interaction between Rad52-Cter domain mutants (295–394) and Rad51, using the intensities ratio (I/I0), where I and I0 are the intensity of the signals 1H-15N SOFAST-HMQC spectra before and after addition of Rad51, respectively. For comparison, values for the WT are indicated in dark gray. d SEC profile analysis of Rad51, Rad52 (295–394) and Rad51 + Rad52 (295–394) WT and mutants in a 1:1 ratio. Source data are provided in the Source Data file.
Fig. 5
Fig. 5. Anchor 1 and 2 are more important for Rad51 filament formation than Anchor 3.
a Survival curves of haploid cells with the indicated genotypes exposed to γ-rays. Survival from 1 to 100% is labeled in red to underline the difference of scale displayed on the left and the right panels. Each data points indicates the mean ± SEM. WT n = 4, rad52n = 6, rad52-F-316A, rad52-F337A, srs2∆, rad52-F316A srs2∆, rad52-F316A srs2n = 3. Results from rad52-Y376A and rad52-Y376A srs2∆ are from ref. (CC BY 4.0: https://creativecommons.org/licenses/by/4.0/). b Survival rates of cells suffering an HO-induced gene conversion between MAT ectopic alleles. Bars represent the mean ± SD (n = 3). Results from rad52-Y376A are from. (**p = 0.0033, two-tailed unpaired t test). c ChIP analysis shows that rad52-F316A (Anchor 1) and rad52-F337A (Anchor 2) highly impact Rad51 recruitment at a HO-induced DSB and the low dependency on Srs2. Upper panel: schematic of the HO-induced SSA repair system used. Lower panel: Rad51 ChIP relative enrichment was assessed at 0.6 kb from the DSB site 4 h after HO induction. Data are presented as the median and error bars represent the minimum and maximum values (n = 3). *Statistical analysis shows that deleting SRS2 in the rad52 mutants increase slightly but significantly the recruitment of Rad51 (rad52-F316A versus rad52-F316A srs2∆, p = 0.029, rad52-F337A versus rad52-F337A srs2∆, p = 0.06; two-tailed unpaired t test). Already published data obtained with rad52-Y376A (Anchor 3) are shown for reference . Source data are provided in the Source Data file.
Fig. 6
Fig. 6. Impact of Rad52-Rad51 binding anchor mutants on Rad51 structure formation in living cells.
a Representative images of Rad51-iGFP 4 h after Isce-I induction in WT, srs2∆, rad52 single mutants or rad52 srs2∆ double mutants. Maximum Z-projection is applied on fluorescent images. Minimum and maximum fluorescence intensities are indicated. Scale bar 1 µm. Pie charts show the proportion of cells with different Rad51 structures as indicated. Bright foci correspond to mean foci intensities > 80% of WT, intermediate to mean values between 20 and 80% of WT, and dim to mean values < 20% of WT. Data are from at least 3 independent experimental replicates. The number of cells analyzed (n) is indicated below each pie chart. b Comparison of Rad51 foci intensities, filament intensities and lengths in WT and mutant strains as indicated. The number of structures analyzed is indicated below each box. Intensities are normalized to the mean intensity of WT Rad51 filaments. On each box, the central mark indicates the median, and the bottom and top edges of the box indicate the 25th and 75th percentiles, respectively. The whiskers extent corresponds to the adjacent value, which is the most extreme data value not considered an outlier (above 75th percentile +1.5 times interquartile range or below 25th percentile −1.5 times interquartile range). Statistical test: logistic regression with binomial distribution, t-statistic on coefficients corrected for multiple comparison with the False Discovery Rate. (See materials and methods; ***P < 0.001, **P < 0.01, *P < 0.05). Exact p-values for all comparisons are presented in Supplementary Fig. 6. Source data are provided in the Source Data file. Microscopy data as well as the complete Source Data file are available in Zenodo: https://zenodo.org/records/15149086.
Fig. 7
Fig. 7. rad51-T161R mimics rad52-Y376A.
a Co-IP experiments showing the loss of interaction between Rad51-T161R and Rad52. Rad51 was immunoprecipitated with a poly-clonal anti-Rad51 antibody (αRad51). The presence of Rad51 in the immunoprecipitated fraction (IP) cannot be detected because it migrates at the same level as the anti-Rad51 IgG used for the immunoprecipitation. However, the absence of Rad52-FLAG in the rad51∆ immunoprecipitate confirmed that the Rad52-FLAG signal observed is related to the Rad52–Rad51 interaction. Position of molecular weight markers are indicated (in kDa).* Unspecific bands. Uncropped blots are provided in the Source Data file. b Serial 10-fold dilutions of haploid strains with the indicated genotypes were spotted onto rich medium (YPD) containing different MMS concentrations. c Survival curves of haploid cells with the indicated genotypes exposed to γ-Rays. Each data points indicates the mean ± SD (n = 3). d ChIP was used to assess Rad51 relative enrichment at 0.6 kb from an HO cut site 4 h after HO induction. Data are presented as the median and error bars represent minimum and maximum values (n = 3). e Left panel: Representative images of Rad51-iGFP 4hrs after Isce-I induction in WT, srs2∆, rad51-T161R or srs2rad51-T161R double mutants. Maximum Z-projection is applied on fluorescent images. Scale bar 1 µm. Pie charts show the proportion of cells with different Rad51 structures as indicated (as in Fig. 6A). Data are from 3 independent experimental replicates. The number of cells analyzed (n) is indicated below each pie chart. Right panel: Comparison of Rad51 filament intensities and lengths in WT and mutant strains as indicated. The number of structures analyzed is indicated below each box. Intensities are normalized to the mean intensity of WT Rad51 filaments. Plots and statistical analyses are as in Fig. 6. Exact p-values for all comparisons are presented in Supplementary Fig. 7G. Source data are provided in the Source Data file. Microscopy data as well as the complete Source Data file are available in Zenodo: https://zenodo.org/records/15149086.
Fig. 8
Fig. 8. Model depicting Rad52 assembly chaperone activity and protection against Srs2, mediated by the interaction of anchors 1, 2 and 3 with Rad51.
The N-terminal domain of Rad52 is represented as a gray sphere and assembles into a decamer, gathering ten unfolded C-terminal regions of Rad52, shown as wavy gray lines. The three Rad52 anchor residues, labeled 1, 2, and 3, are represented as colored triangles using the same color code as in Fig. 4–7. Each C-terminal tail can potentially bind a single Rad51 molecule (shown in blue), thereby dissociating Rad51 oligomers. The Rad51 motif involved in oligomerization (F144VTA) is represented as a blue triangular extension. Anchor 1 directly competes with this oligomerization site. Interaction of the Rad52 C-terminal tail may favor proper Rad51 filament formation and also protect against the action of the Srs2 helicase (in green), which is known to interact with ssDNA and to translocate from the 3’ to 5’ end.

Similar articles

Cited by

References

    1. Kowalczykowski, S. C. An overview of the molecular mechanisms of recombinational DNA repair. Cold Spring Harb. Perspect. Biol.7 (2015). - PMC - PubMed
    1. Triplett, M. K., Johnson, M. J. & Symington, L. S. Induction of homologous recombination by site-specific replication stress. DNA Repair (Amst.)142, 103753 (2024). - PMC - PubMed
    1. Wassing, I. E. & Esashi, F. RAD51: Beyond the break. Semin Cell Dev. Biol.113, 38–46 (2021). - PMC - PubMed
    1. Guirouilh-Barbat, J., Lambert, S., Bertrand, P. & Lopez, B. S. Is homologous recombination really an error-free process?. Front Genet5, 175 (2014). - PMC - PubMed
    1. Piazza, A. & Heyer, W. D. Homologous recombination and the formation of complex genomic rearrangements. Trends Cell Biol.29, 135–149 (2019). - PMC - PubMed

MeSH terms

LinkOut - more resources