. 2025 Jul 1;16(1):5580.
doi: 10.1038/s41467-025-60592-w.

Reward history guides focal attention in whisker somatosensory cortex

Affiliations

Reward history guides focal attention in whisker somatosensory cortex

Deepa L Ramamurthy et al. Nat Commun. .

Abstract

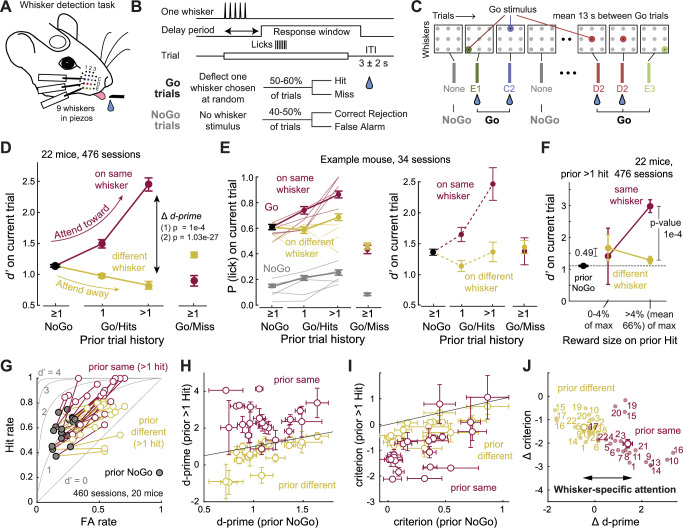
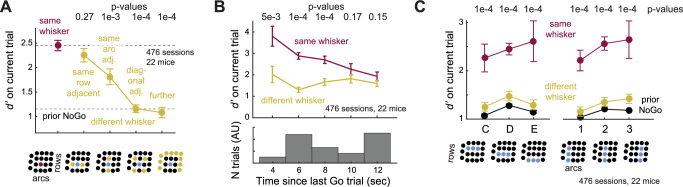
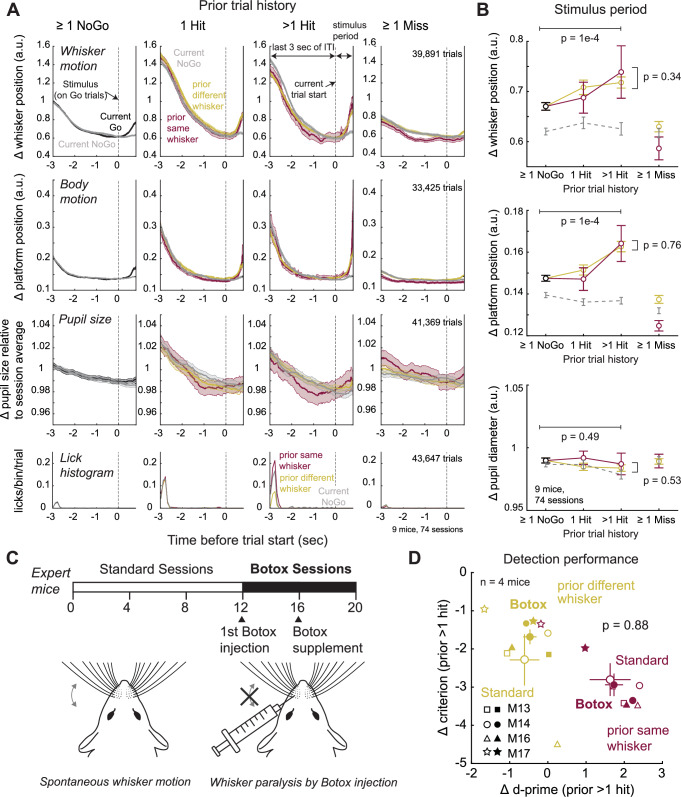
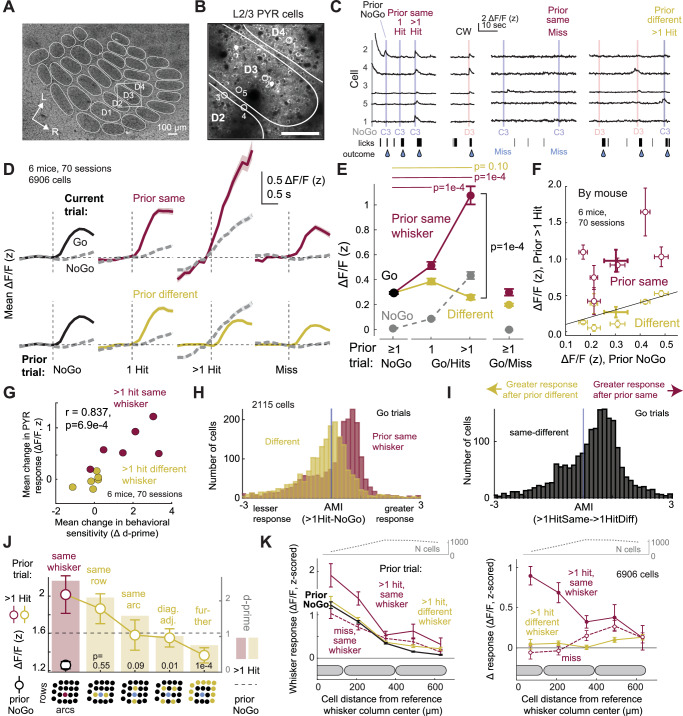
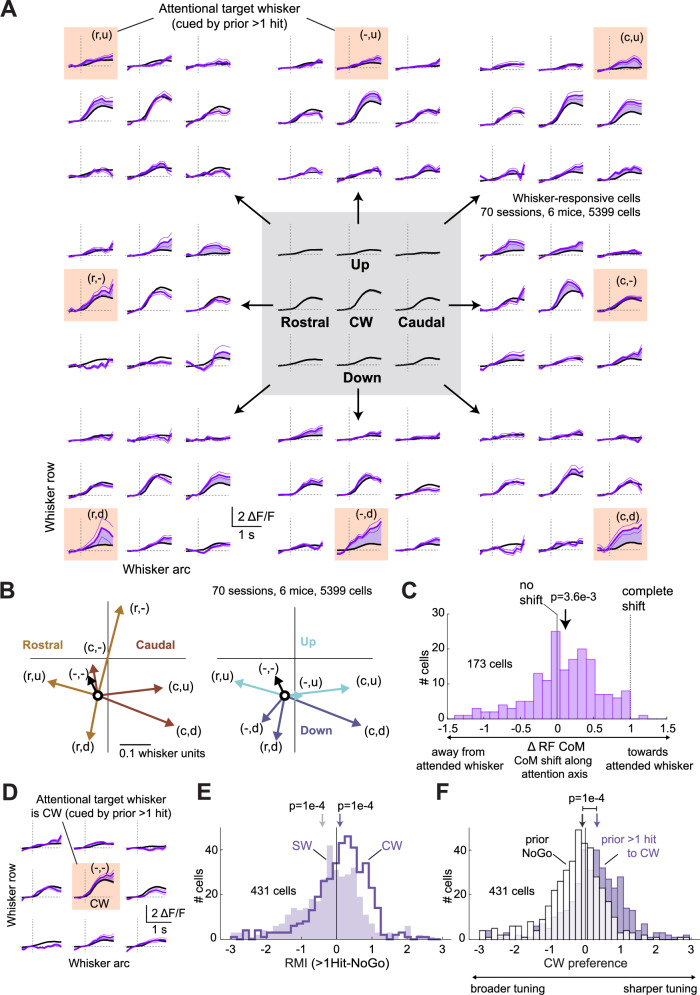
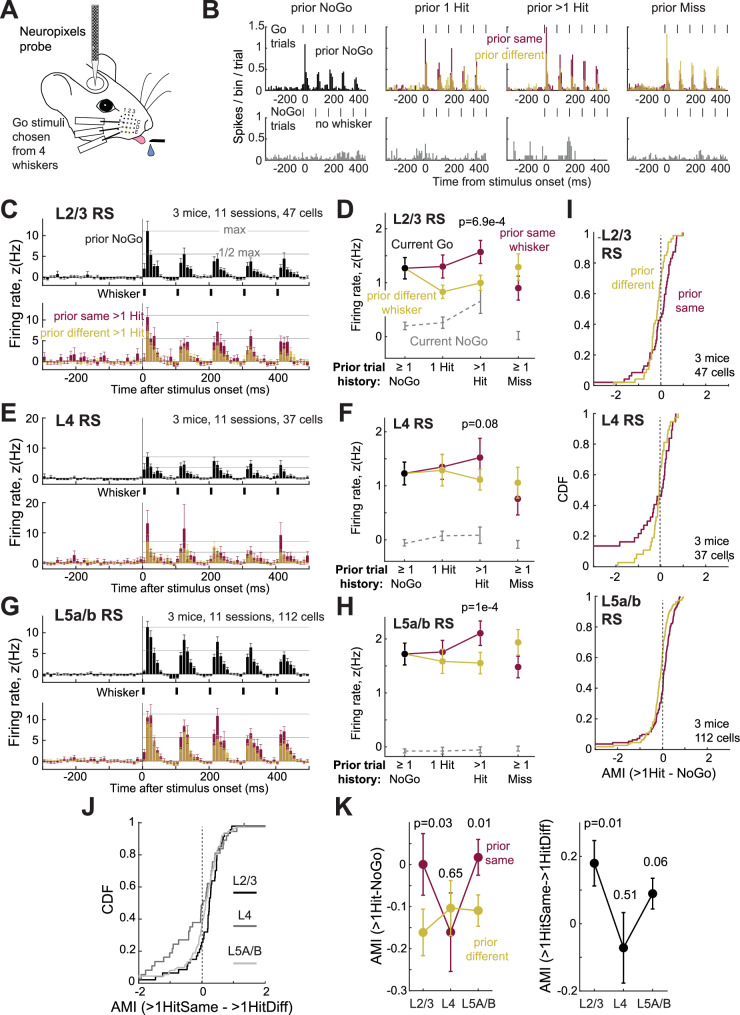
Prior reward is a potent cue for attentional capture, but the underlying neurobiology is largely unknown. In a whisker touch detection task, we show that mice flexibly shift attention between specific whiskers on a trial-by-trial timescale, guided by the recent history of stimulus-reward association. Two-photon calcium imaging and spike recordings reveal a robust neurobiological correlate of attention in the somatosensory cortex, boosting sensory responses to the attended whisker in L2/3 and L5, but not L4. Attentional boosting in L2/3 pyramidal cells is topographically precise and whisker-specific, and shifts receptive fields toward the attended whisker. L2/3 vasoactive intestinal peptide (VIP) interneurons are broadly activated by whisker stimuli, motion, and arousal but do not carry a whisker-specific attentional signal, and thus do not mediate spatially focused tactile attention. These findings provide an experimental model of focal attention in the mouse whisker tactile system, showing that the history of recent past stimuli and rewards dynamically engage local modulation in cortical sensory maps to guide flexible shifts in ongoing behavior.


Conflict of interest statement

Competing interests: The authors declare no competing interests.

Figures

Fig. 1
Fig. 1. Recent reward history cues spatially specific attention for whisker touch.
A Whisker detection task in head-fixed mice. B Trial structure. The delay period was 0, 500, or 1000 ms in different mice (see Supplementary Fig. S1). ITI, Intertrial interval. Bottom, Trial types and outcomes. C Example trial sequence with interleaved Go and NoGo trials; whisker identity on Go trials was chosen randomly. A water drop indicates a reward on Hit trials. D Mean effect of trial history on detection sensitivity (d-prime; 476 sessions, 22 mice). Prior Hits to the same whisker (maroon) increased d’ for detecting that whisker on the current trial (‘attend toward’), while prior Hits to a different whisker (yellow) decreased d’ (‘attend away’). P-values: (1) Permutation tests (prior same 1 Hit vs prior NoGo: p = 1e-4, prior same > 1 Hit vs prior NoGo: p = 1e-4, prior different > 1 Hit vs prior NoGo: p = 1e-4, prior same > 1 Hit vs prior different > 1 Hit: p = 1e-4), (2) Linear mixed effects model, prior history class: p = 1.03e-27; sex: p = 0.155). E Same effect in a single example mouse. Left, underlying effect on hit rate for 5 example sessions (thin lines) and all 34 sessions (thick lines). Right, d’ for this mouse from 34 sessions. F d’ did not increase after unrewarded hits or very small rewards to the same whisker (< 4%: p = 0.49, > 4%: p = 1e-4); p-values for difference in d’ between prior same vs. different conditions (permutation test). G Effect of > 1 prior hits on current trial Hit Rate and False Alarm (FA) rate. Connected symbols show data from individual mice (460 sessions, 20 mice). Gray lines, receiver-operating characteristic (ROC) curves for different d’ levels. Prior same whisker hits drive a whisker-specific increase in hit rate over FA rate and improve d’. H, I Behavioral shifts in d’ (H) and criterion c (I) across individual mice; criterion changes were less whisker-specific. J Changes in d’ (Δ d’) and cc) per mouse included in GI (number, mouse identity). We focus on Δ d’ to index whisker-specific attention. See also Supplementary Fig. S1.
Fig. 2
Fig. 2. Spatiotemporal characteristics of attention cued by reward history.
A Spatial gradient of the attention effect. The facial position of the prior Hit whisker is plotted on the x-axis, relative to the current trial whisker. P-values are for difference from prior same (same row: p = 0.27, same arc: 1e-3, diagonal: 1e-4, further: 1e-4, permutation test). Bottom, each position shown schematically. B Temporal profile of the whisker-specific attention effect (3–5 s: 5e-3, 5–7 s: 1e-4, 7–9 s: 1e-4, 9–11 s: 0.17, > 11 s: 0.15, permutation test). P-values are from permutation tests (FDR-corrected). Bottom, Inter-Go-trial intervals sampled in the task. C Flexible targeting of attention. x-axis represents identity of whisker in current Go trial, grouped into C, D, or E-row whiskers (left), or arcs 1, 2 or 3 (right). For all of these whiskers, prior reward history boosts detection in a whisker-specific way. Bottom, each row or arc shown schematically. P-values are for prior same vs prior different > 1 hit (p = 1e-4 for all whisker positions, permutation test). Data are presented as mean ± SEM across sessions in all panels, unless otherwise specified. Conventions as in Fig. 1. Data from 476 sessions, 22 mice in all panels. See also Supplementary Fig. S1.
Fig. 3
Fig. 3. Whisker motion, body motion, and arousal do not account for whisker-specific behavioral effects.
A Mean whisker motion, platform motion (proxy for body motion), and pupil size traces, from DeepLabCut analysis across 43,647 trials, 74 sessions in 9 mice. Each panel shows the last 3 s of the intertrial interval (ITI) period after the prior trial, plus the current trial stimulus period. Traces and shading are mean ± SEM across all trials. Dashed line, stimulus onset (Go trials) or dummy piezo onset (NoGo trials). Pupil size was normalized within each session to the mean pupil size across the whole session. Bottom row, lick histogram. B Mean whisker movement, body movement, and pupil size change during the stimulus period. Prior Hits increased stimulus-evoked whisker and body motion on subsequent trials (Δ whisker motion, prior > 1 hit same vs prior NoGo: p = 1e-4, prior > 1 hit same vs > 1 hit different: p = 0.39; Δ body motion, prior > 1 hit same vs prior NoGo: p = 1e-4, prior > 1 hit same vs > 1 hit different: p = 0.39; Δ pupil area, prior > 1 hit same vs prior NoGo: p = 0.49, prior > 1 hit same vs > 1 hit different: p = 0.53). p-values are for > 1 Prior Hit vs Prior NoGo (top), and > 1 Prior Hit Same vs > 1 Prior Hit Different (right) (permutation test). Error bars show SEM across trials. C Design of Botox experiment. Behavior was assayed on an average of 12 sessions pre-Botox injection, and 7 sessions post-Botox whisker paralysis. D Reward history-dependent attention effect in each of the 4 mice tested, for standard sessions (before Botox, open symbols) and Botox sessions (filled symbols). M, Mouse numbers as in Fig. 1J. Large points are mean ± SEM across mice. Conventions as in Fig. 1J. Whisker paralysis did not alter the mean whisker-specific d-prime effect or criterion effect (p = 0.88, permutation test comparing same vs. different shifts in Δd′ for standard and Botox sessions. Paired differences in same vs. different Δd′ shifts across session types were tested against zero). See also Supplementary Fig. S2.
Fig. 4
Fig. 4. Neural correlates of attentional capture in L2/3 pyramidal cells in S1.
A, B Example imaging field in S1 centered on the D3 column in a Drd3-Cre;Ai162D mouse (1/70 sessions, 6 mice). L2/3 pyramidal (PYR) cells express GCaMP6s. Scale bar = 100 µm. C Example trials showing strong responses to columnar whisker D3 but weak responses to surround whisker C3, which were strongly modulated by prior trial history. C3 responses increased following multiple prior hits to C3 (left), but not other history conditions (right). D Mean ΔF/F traces by trial history; solid = Go whisker, dashed = NoGo. E Quantification of whisker-evoked ΔF/F by trial type (Go/NoGo) and history. P-values (permutation test, FDR-corrected): prior same 1 Hit vs prior NoGo: p = 1e-4, prior same > 1 Hit vs prior NoGo: p = 1e-4, prior different > 1 Hit vs prior NoGo: p = 0.1, prior same > 1 Hit vs prior different > 1 Hit: p = 1e-4. Linear mixed effects model, prior history class: p = 1e-4; sex: p = 0.878. F Mean ΔF/F modulation by mouse. G Correlation between history-based modulation of PYR whisker responses and behavioral d-prime across mice (r = 0.837, p = 6.9e-4, Pearson’s correlation). H AMI>1HitSame-NoGo and AMI>1HitDiff-NoGo for each cell. Positive values indicate a greater response than prior NoGo. I AMI>1HitSame->1HitDiff for each cell. J Boosting of whisker-evoked ΔF/F responses as a function of somatotopic offset between prior and current trial whisker. P-values from permutation tests (FDR-corrected). Bars show behavioral d-prime for the same mice (subset of data from Fig. 2A). K Somatotopic organization of attentional capture. Left, ΔF/F evoked by a reference whisker as a function of cell position relative to its column center. When calculated from Prior NoGo trials (thick black trace), this defines the classic point representation of a single whisker. This is boosted in prior same > 1 Hit trials, but not prior different > 1 Hit or prior same miss trials. Right, same data shown as difference relative to Prior NoGo trials. Data shown as mean ± SEM across cells in all panels. Conventions as in Fig. 1. See also Supplementary Figs. S3 and S4.
Fig. 5
Fig. 5. Attentional cueing involves receptive field shifts toward attended whiskers.
A Mean whisker-evoked ΔF/F trace for all whisker-responsive cells in all imaged columns. Center, mean ± SEM (across N = 5399 cells) for trials when prior trial was NoGo, separated by the identity of the current trial whisker. This reports the average whisker tuning curve for these neurons, in the absence of attentional cueing. Outer panels, the whisker responses measured when prior trial history was > 1Hit to the indicated attentional target whisker (thick purple trace is mean, thin traces show ± SEM). Purple fill is drawn between mean traces to aid visualization. r, u, c, d denote rostral, up, caudal, or down from the columnar whisker (CW). B Mean tuning center-of-mass (CoM) when the prior trial was NoGo (black circle) vs after prior > 1 Hit to each of the indicated whiskers as defined in panel A. CoM coordinate system is shown in Supplementary Fig. S5A. Vectors are color-coded for whether the target whisker was rostral, caudal, up, or down from the CW. C Magnitude of CoM shift along the attention axis, as defined in Supplementary Fig. S5B. Negative values are shifts away from the attended whisker. The mean CoM shift was significantly greater than zero (p = 3.6e-3, permutation test). D Mean whisker receptive field when prior trial was > 1 hit to the CW (purple), relative to when prior trial was NoGo (black). Format as in panel (A). E Response modulation index (RMI) for modulation of CW and SW responses when the attention is directed to the CW. RMI shows that CW responses were increased (p = 1e-4, permutation test), while mean SW responses were decreased (p = 1e-4, permutation test). F Attention to the CW increases preference of neurons to the CW relative to the top three SWs, thus narrowing their overall tuning width (p = 1e-4, permutation test). See also Supplementary Fig. S5.
Fig. 6
Fig. 6. Attentional cueing improves neural decoding of attended whiskers on single trials.
A Neural decoder design. Left, example field showing L2/3 PYR cells tuned to different best whiskers intermixed in each column, consistent with prior studies. Right, weights for individual neurons were fit using ridge regression 10-fold cross-validation was used to fit a logistic regression predicting stimulus presence (any whisker Go trial) or absence (NoGo trial). B Decoder performance determined from held-out trials (6 mice, 70 sessions). Each dot is one session. Mean ± SEM across sessions is overlaid on the data. Decoder performance is relatively low for any whisker, because many trials are Go trials for whiskers that are not strongly represented in the imaging field. Decoder performance for field best whisker (fBW) trials is high because this whisker is strongly represented in the imaging field. C Mean decoder performance separated by trial history type, when the current trial is any Go whisker (maroon or yellow) or a NoGo trial (gray dash). Solid lines with circle markers show decoder performance across any whisker on the current trial. (All trials, prior same > 1 Hit vs prior NoGo: p = 1e-4, prior different > 1 Hit vs prior NoGo: p = 0.05, prior same > 1 Hit vs prior different > 1 Hit: p = 1e-4). D Same as (C), but for decoder performance when the current trial is an fBW Go trial or a NoGo trial. E Same as (C), but for decoder performance when the current trial is a non-fBW Go trial or a NoGo trial. F Summary of attentional modulation of decoding accuracy for the prior > 1 Hit trial history condition. > 1 prior Hit to a whisker improves single-trial decoding for non-fBW whiskers, but not for the fBW, in each field (non-fBW: p = 1e-4, fBW: p = 0.79). Data are presented as mean ± SEM across sessions in all panels. P-values are for prior same vs prior different > 1 hit (permutation test). P-values from permutation (FDR-corrected), in all panels. See also Supplementary Fig. S6.
Fig. 7
Fig. 7. Attentional effects on extracellular single-unit spiking in S1.
A Neuropixels recording during the whisker detection task. B Mean PSTH for an example L2/3 regular spiking (RS) unit recorded in the D1 whisker column, across all Go trials (D1, C2, delta, and gamma whiskers, top) and NoGo trials (bottom). Whisker-evoked responses were boosted when prior trial history was 1 or > 1 Hit to the same whisker (maroon), and reduced when prior trial was > 1 Hit to a different whisker (yellow). C, E, G Layer-specific analysis for RS units of population mean PSTH (10 ms bins) for Go trials, by trial history (3 mice, L2/3: 47 cells, L4: 37 cells, L5: 112 cells). D, F, H For the same units, population average whisker-evoked response on current Go trials (500-ms window) by trial history, or for current NoGo trials in an equivalent window (prior same > 1 Hit vs prior different > 1 Hit, L2/3: p = 6.9e-4, L4: 0.08, L5a/b: 1e-4, permutation test). I Cumulative distribution (CDF) of attention modulation indices (AMI), AMI>1HitSame-NoGo and AMI>1HitDiff-NoGo values for RS units by layer. J Cumulative distribution of AMI>1HitSame->1HitDiff by layer. K Mean AMI values by layer for the same units (AMI>1HitSame-NoGo vs AMI>1HitDiff-NoGo, L2/3: 0.03, L4: 0.65, L5a/b: 0.01; AMI>1HitSame->1HitDiff, L2/3: 0.01, L4:0.51, L5a/b: 0.06). Error bars show SEM across cells in all panels. P-values from permutation tests (FDR-corrected) in all panels. See also Supplementary Fig. S7.
Fig. 8
Fig. 8. L2/3 VIP cells carry a general arousal signal, but not a whisker-specific attentional signal.
A Circuit model for potential vasoactive intestinal peptide-expressing (VIP) cell role in arousal, movement, and attentional modulation in sensory cortex. SST – somatostatin-expressing interneuron. B Example L2/3 imaging field in a VIP-Cre;Ai162D mouse (1/103 sessions, 7 mice). Scale bar = 50 µm. C Mean ΔF/F traces during the last 3 s of the intertrial interval (ITI) after the prior trial, for prior rewarded (prior 1 Hit or prior > 1 Hit trials) and prior unrewarded trials (prior NoGo or prior Miss). Traces are zeroed to the last 2 frames before stimulus onset. Dynamics of licking behavior, pupil size, whisker position, and body position in the ITI period. The declining baseline, evident on both prior rewarded (blue) and unrewarded (gray) trials, is due to VIP cell encoding of arousal, whisker motion, and body motion which all decline in the inter-trial interval as described in a previous study, and shown in Fig. 3A. Prior rewarded trials show a steeper peak and steeper decline due to licking and reward consumption at the end of the prior trial. D Mean ΔF/F traces by trial history; solid = Go whisker, dashed = NoGo. Conventions as in Fig. 4D. E Same data as in (D) after detrending (see “Methods”). Whisker-evoked responses are non-selectively modulated by prior hits on eitherthe same or different whiskers, consistent with a global arousal effect but not whisker-specific attention. F Quantification of whisker-evoked ΔF/F by trial type (Go/NoGo) and history (prior same 1 Hit vs prior NoGo: p = 0.11, prior same > 1 Hit vs prior NoGo: p = 1e-3, prior different > 1 Hit vs prior NoGo: p = 1e-3, prior same > 1 Hit vs prior different > 1 Hit: p = 0.54, permutation test. Linear mixed effects model, prior history class: p = 0.507; sex: p = 0.753). Conventions as in Fig. 4E. G AMI>1HitSame-NoGo and AMI>1HitDiff-NoGo for each cell. Positive values indicate greater response than prior NoGo. H AMI>1HitSame->1HitDiff for each cell. Data shown as mean ± SEM across cells in all panels. See also Supplementary Fig. S8.

Update of

Similar articles

References

    1. Maunsell, J. H. R. Neuronal mechanisms of visual attention. Annu. Rev. Vis. Sci.1, 373–391 (2015). - PMC - PubMed
    1. Hromádka, T. & Zador, A. M. Toward the mechanisms of auditory attention. Hear. Res.229, 180–185 (2007). - PMC - PubMed
    1. Gallace, A. & Spence, C. in In Touch with the Future: The Sense of Touch from Cognitive Neuroscience to Virtual Reality 0 (Oxford University Press, 2014).
    1. Nobre, A. C. & Stokes, M. G. Premembering experience: A hierarchy of time-scales for proactive attention. Neuron104, 132–146 (2019). - PMC - PubMed
    1. Awh, E., Belopolsky, A. V. & Theeuwes, J. Top-down versus bottom-up attentional control: a failed theoretical dichotomy. Trends Cogn. Sci.16, 437–443 (2012). - PMC - PubMed

Substances

LinkOut - more resources