. 2025 Jul 1;16(1):5602.
doi: 10.1038/s41467-025-60708-2.

Evolution of linear triterpenoid biosynthesis within the Euphorbia genus

Affiliations

Evolution of linear triterpenoid biosynthesis within the Euphorbia genus

Tomasz Czechowski et al. Nat Commun. .

Abstract

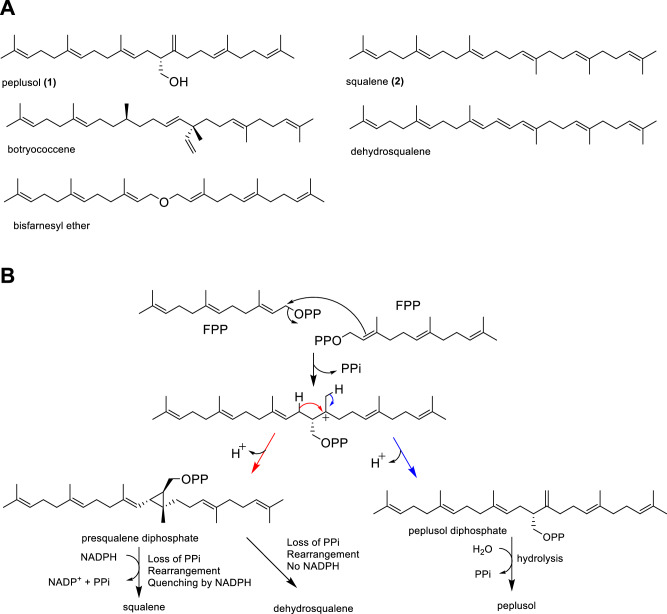
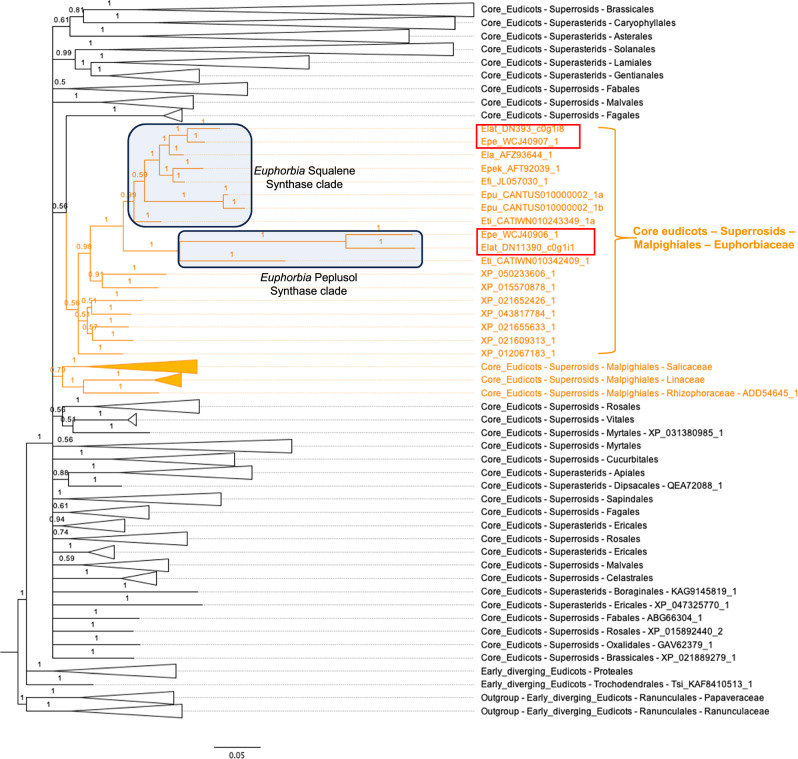
Terpenoids are among the largest classes of plant natural products. Squalene, a high value commodity in the cosmetic, food and pharmaceutical industries, is a common linear precursor for the biosynthesis of C30 triterpenes and sterols across plant, animal and fungal kingdoms. The anti-fungal compound peplusol is another linear C30 triterpene, but has only been reported in the genus Euphorbia. Here, we show that peplusol production has evolved due to duplication of a sterol synthase gene with one copy acquiring peplusol synthase activity and the original gene retaining the ancestral function. We identify a number of key amino acid residues that can convert the squalene synthase enzyme into peplusol synthase and vice versa. The PEPLUSOL SYNTHASE gene from E. peplus is able to drive significant levels of peplusol production in alternate host production platforms including Nicotiana benthamiana (over 2.5% leaf dry weight) and Saccharomyces cerevisiae (30 mg/L culture).


Conflict of interest statement

Competing interests: The authors declare no competing interests.

Figures

Fig. 1
Fig. 1. Proposed formation of selected linear triterpenes.
A Examples of linear triterpenes found in nature. B Proposed scheme for peplusol and squalene formation from farnesyl diphosphate (FPP) precursor.
Fig. 2
Fig. 2. Functional characterisation of EpSS-L1 and EpSS-L2 in N. benthamiana.
A Four week old N. benthamiana plants infiltrated with: Empty Vector (EV), A. thaliana Squalene Synthase (AtSS, GenBank accession BT003419.1), E. peplus Squalene Synthase-like1 (EpSS-L1, GenBank locus tag M5689_021805), E. peplus Squalene Synthase-like2 (EpSS-L2, GenBank locus tag M5689_021806) with and without truncated A. thaliana HMG-CoA reductase (HMGRt, GenBank accession J04537.1). Infiltrated leaves were extracted and analysed by LC-MS in parallel with E. peplus latex-purified peplusol standard. Extracted Ion Chromatograms (EIC) shown for m/z 427.4 showing peplusol (1) and 2,3-oxidosqualene (3) B Peplusol levels were quantified by LC-MS in N. benthamiana leaves infiltrated with gene combinations as on panel A, against a standard curve generated from purified peplusol. n.d.: not detectable, Error bars: SEM (n = 5). C Squalene levels were quantified by GC-MS in N. benthamiana leaves infiltrated with gene combinations as on panel A, n.d.: not detectable, Error bars: SEM (n = 5, where n is the number of biological replicates). Statistically significant (one-sided t-test) changes between control (EV) and candidate genes indicated by asterisks (*: p-value < 0.05,  **: p-value < 0.01). D, E 2,3-oxidosqualene levels were quantified by LC-MS in N. benthamiana leaves infiltrated with gene combinations as on (A) against a standard curve generated from purified 2,3-oxidosqualene. Error bars: SEM (n = 5, where n is the number of biological replicates). Statistically significant (one-sided t-test) changes between control (EV) and candidate genes indicated by asterisks (**: p-value < 0.01). Source data for (BE) are provided as a Source Data file.
Fig. 3
Fig. 3. Functional characterisation of EpSS-L1 and EpSS-L2 in S. cerevisiae.
AS. cerevisiae CEN.PK2-1C, wild type strain (-tHMG1) and truncated HMG-CoA reductase 1 -expressing strain (+tHMG1) were transformed with either Empty Vector (EV, pBEVY-L) or pBEVY-L constructs for overexpression of: A. thaliana Squalene Synthase (AtSS, GenBank accession BT003419.1), E. peplus Squalene Synthase-like1 (EpSS-L1, GenBank locus tag M5689_021805) and E. peplus Squalene Synthase-like2 (EpSS-L2, GenBank locus tag M5689_021806). Empty Vector (EV), A. thaliana Squalene Synthase (AtSS, GenBank accession BT003419.1), E. peplus Squalene Synthase-like1 (EpSS-L1, GenBank locus tag M5689_021805), E. peplus Squalene Synthase-like2 (EpSS-L2, GenBank locus tag M5689_021806) with and without truncated A. thaliana HMG-CoA reductase (HMGRt, GenBank accession J04537.1). S. cerevisiae cultures were extracted and analysed by LC-MS in parallel with E. peplus latex-purified peplusol standard. Extracted Ion Chromatograms (EIC) shown for m/z 427.4 showing peplusol (1) in extracts derived from cell pellets (B) Quantification of peplusol by LC-MS from the extracts shown on (A). Three independent transformants were grown in liquid cultures. Peplusol levels were quantified by LC-MS in: whole liquid cultures (grey bars), cell pellets (blue bars) and media (orange bars), against a standard curve generated from purified peplusol. n.d.: not detectable, Error bars: SEM (n = 3, where n is the number of biological replicates). Statistically significant (one-sided t-test) changes between EpSS-L1 overexpressed in -tHMG1 and +tHMG1 backgrounds indicated by asterisks for whole liquid cultures, cell pellets and media (*: p-value < 0.05, **: p-value < 0.01). C Quantification of squalene by GC-MS. Three independent transformants were grown in liquid cultures. Squalene levels were quantified by GC-MS in cell pellets from the strains shown in panel A. Error bars: SEM (n = 3, where n is the number of biological replicates). Statistically significant (one-sided t-test) differences between control (EV) and candidate genes indicated by asterisks (*: p-value < 0.05, **: p-value < 0.01). Source data are provided as a Source Data file.
Fig. 4
Fig. 4. Functional characterisation of ElSS-L1 and ElSS-L2 in N. benthamiana.
A Peplusol levels were quantified by LC-MS in N. benthamiana leaves infiltrated with: Empty Vector (EV), E. peplus Squalene Synthase-like1 (EpSS-L1, GenBank locus tag M5689_021805), E.lateriflora Squalene Synthase-like1 (ElSS-L1, GenBank accession PP978604), E. lateriflora Squalene Synthase-like2 (ElSS2, GenBank accession PP978605), with and without truncated A. thaliana HMG-CoA reductase (HMGRt, GenBank accession J04537.1). n.d.: not detectable, Error bars: SEM (n = 5 where n is the number of biological replicates). B Squalene levels were quantified by GC-MS in N. benthamiana leaves infiltrated with gene combinations as on panel A. n.d.: not detectable, Error bars: SEM (n = 5 where n is the number of biological replicates). Statistically significant (one-sided t-test) changes between control (EV) and candidate genes indicated by asterisks (**: p-value < 0.01). C 2,3-oxidosqualene levels were quantified by LC-MS in N. benthamiana leaves with gene combinations as on (A). Error bars: SEM (n = 4 or 5, where n is the number of biological replicates). Statistically significant (one-sided t-test) differences between control (EV) and candidate genes indicated by asterisks (**: p-value, < 0.01, *: p-value, < 0.05). Source data are provided as a Source Data file.
Fig. 5
Fig. 5. Evolutionary origin of peplusol synthases inferred from the phylogenetic tree of homologues of squalene synthases of eudicots.
The phylogenetic tree of homologues of squalene synthases of eudicots were constructed using Bayesian inference. The posterior probabilities are shown on the branches and scale bar represents substitutions per nucleotide site. With the exception of the Malpighiales order, clades that contain species from the same order are collapsed and the names of the taxonomic order are labelled. Members in the Malpighiales order are highlighted in orange. All members from the Euphorbiaceae family are shown whereas other families are also collapsed and family names are indicated. A three or four letter prefix followed by an underscore is used as a species identifier for each gene from the Euphorbia species; including Efi_ (E. fischeriana), Ela_ (E. lathyris), Elat_ (E. lateriflora), Epe_ (E. peplus), Epek_ (E. pekinensis), Epu_ (E. pulcherrima), and Eti_ (E. tirucalli). The sister clades of Euphorbia peplusol synthases and squalene synthases are highlighted by shaded rectangles. Sequences heterologously expressed in N. benthamiana and/or S. cerevisiae highlighted in red box. See Supplementary Data 2 for the full list of the sequences used to construct phylogenetic trees with gen bank accessions.
Fig. 6
Fig. 6. Active site amino acid swaps convert squalene synthase into peplusol synthase and vice versa.
Impact of conserved active site hexa- and hepta- amino acid swaps on 3D protein structure of EpSS-L1 and EpSS-L2 were determined using Alpha Fold 3. Highest ranked models (green for EpSS-L1, magenta for EpSS-L2) were overlaid with (A) PDB-deposited (3weh) structure human squalene synthase in complexes with presqualene pyrophosphate (PSPP, grey) and Mg2+ (green spheres) or (B) PDB-deposited (3weg) structure human squalene synthase in complexes with farnesyl thiopyrophosphate (FsPP, a noncleavable FPP analogue, grey) and magnesium ion (grey) and Mg2+ (green spheres). Seven positions identified as potentially important for peplusol synthase activity are shown as stick and wires and labelled for both EpSS-L1 (red) and EpSS-L2 (black). CS. cerevisiae CEN.PK2-1C, wild type strain (-tHMG1) and truncated HMG-CoA reductase 1 -expressing strain (+tHMG1) were transformed with either: Empty Vector (EV, pBEVY-L) or pBEVY-L constructs containing E. peplus Squalene Synthase-like2 (EpSS-L2), E. peplus Squalene Synthase-like2 hexaswap (EpSS-L2to-L1_6AA: F69M, T208M, N209T, T296G, C300Y and K318P), E. peplus Squalene Synthase-like2 heptaswap (EpSS-L2to-L1_7AA: F69M, T208M, N209T, T296G, C300Y, K318P and A173S), E. peplus Squalene Synthase-like1 (EpSS-L1), E. peplus Squalene Synthase-like1 hexaswap (EpSS-L1to-L2_6AA: M69F, M208T, T209N, G294T, Y298C, P313R) and E. peplus Squalene Synthase-like1 heptaswap (EpSS-L1to-L2_7AA: M69F, M208T, T209N, G294T, Y298C, P313R and S173A). Three independent transformants were grown in liquid cultures. Peplusol in cell pellets was quantified by LC-MS. n.d.: not detectable, Error bars: SEM (n = 3 where n is the number of biological replicates). D Squalene levels in cell pellets was quantified by GC-MS from a subset of the -tHMG1 strains shown in panel C. Error bars: SEM (n = 3, where n is the number of biological replicates). Statistically significant (one-sided t-test) differences between control (EV) and candidate genes indicated by asterisks on (C, D) (*: p-value < 0.05, **: p-value < 0.01). Statistically significant (one-sided t-test) differences between strain overexpressing E. peplus Squalene Synthase-like2 (-tHMG1-EpSS-L2) and other strains indicated by daggers on (D) (†: p-value < 0.05, ††: p-value < 0.01). Source data are provided as a Source Data file.

Similar articles

References

    1. Chappell, J. The genetics and molecular genetics of terpene and sterol origami. Curr. Opin. Plant Biol.5, 151–157 (2002). - PubMed
    1. Thimmappa, R., Geisler, K., Louveau, T., O’Maille, P. & Osbourn, A. Triterpene biosynthesis in plants. Annu Rev. Plant Biol.65, 225–257 (2014). - PubMed
    1. Augustin, J. M., Kuzina, V., Andersen, S. B. & Bak, S. Molecular activities, biosynthesis and evolution of triterpenoid saponins. Phytochemistry72, 435–457 (2011). - PubMed
    1. Sawai, S. & Saito, K. Triterpenoid biosynthesis and engineering in plants. Front Plant Sci.2, 25 (2011). - PMC - PubMed
    1. Osbourn, A., Goss, R. J. & Field, R. A. The saponins: polar isoprenoids with important and diverse biological activities. Nat. Prod. Rep.28, 1261–1268 (2011). - PubMed

MeSH terms

LinkOut - more resources