. 2025 Jul 1;16(1):5945.
doi: 10.1038/s41467-025-60882-3.

Spatial profiling of chromatin accessibility in formalin-fixed paraffin-embedded tissues

Affiliations

Spatial profiling of chromatin accessibility in formalin-fixed paraffin-embedded tissues

Pengfei Guo et al. Nat Commun. .

Abstract

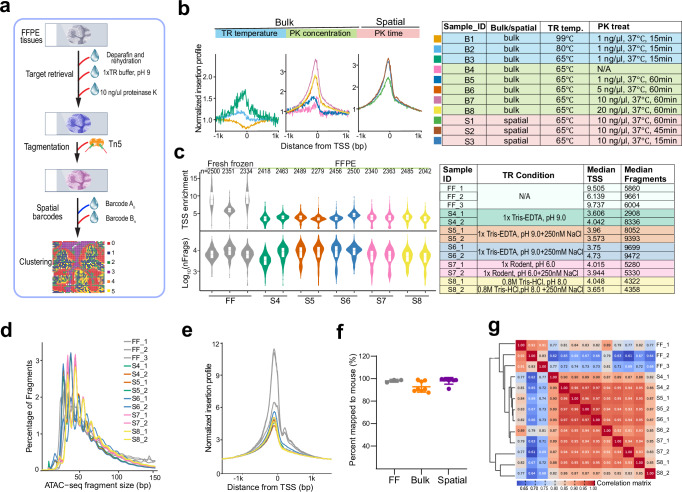
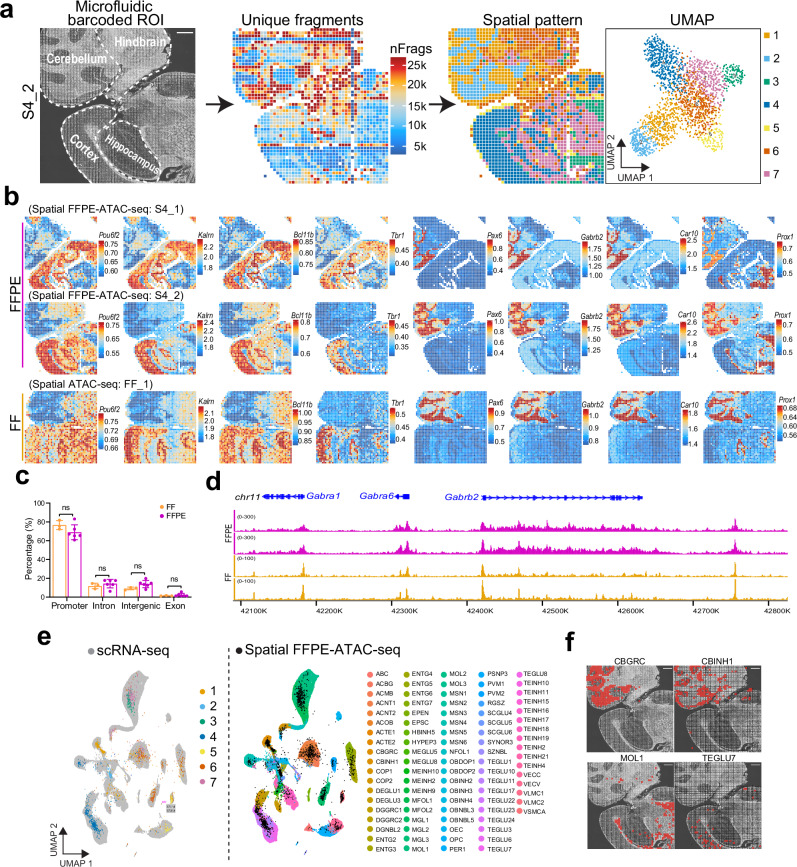
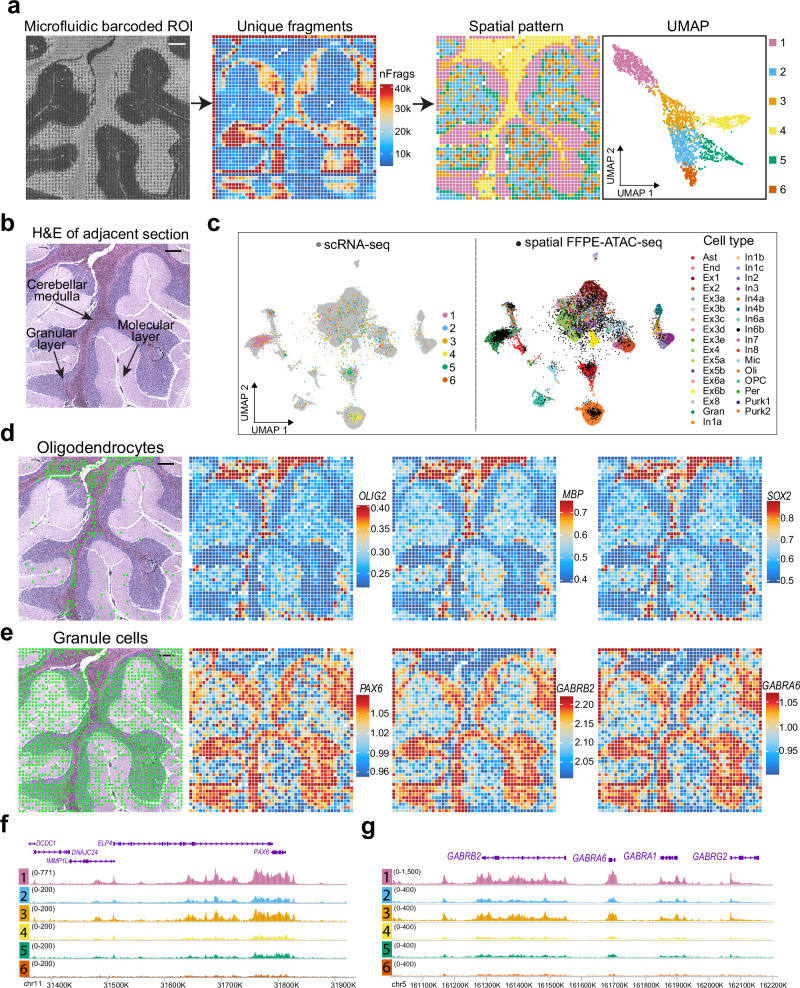
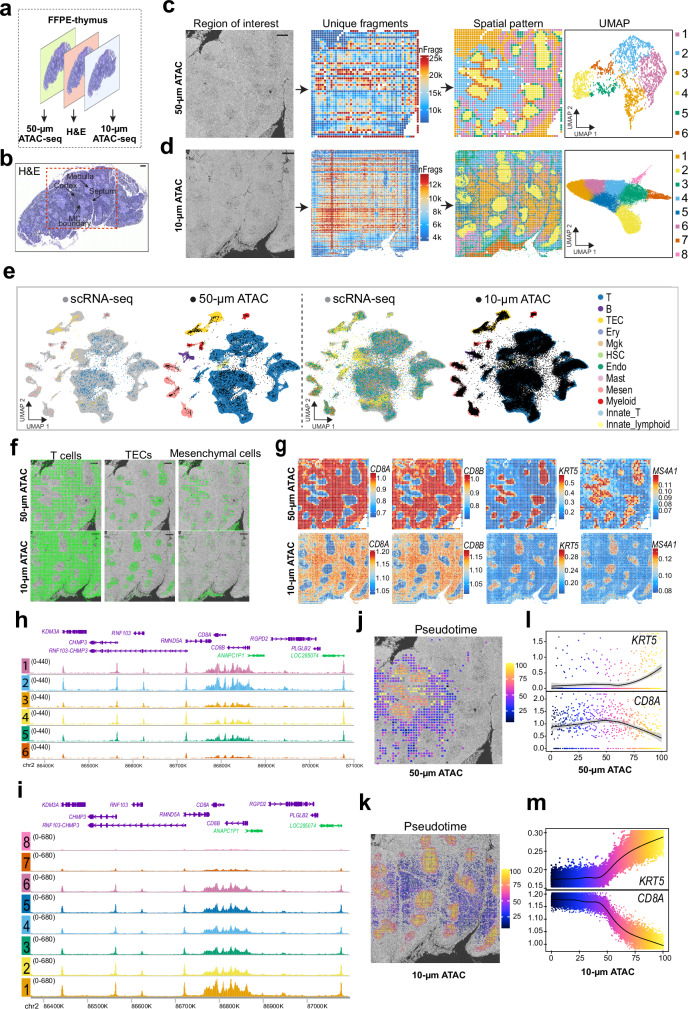
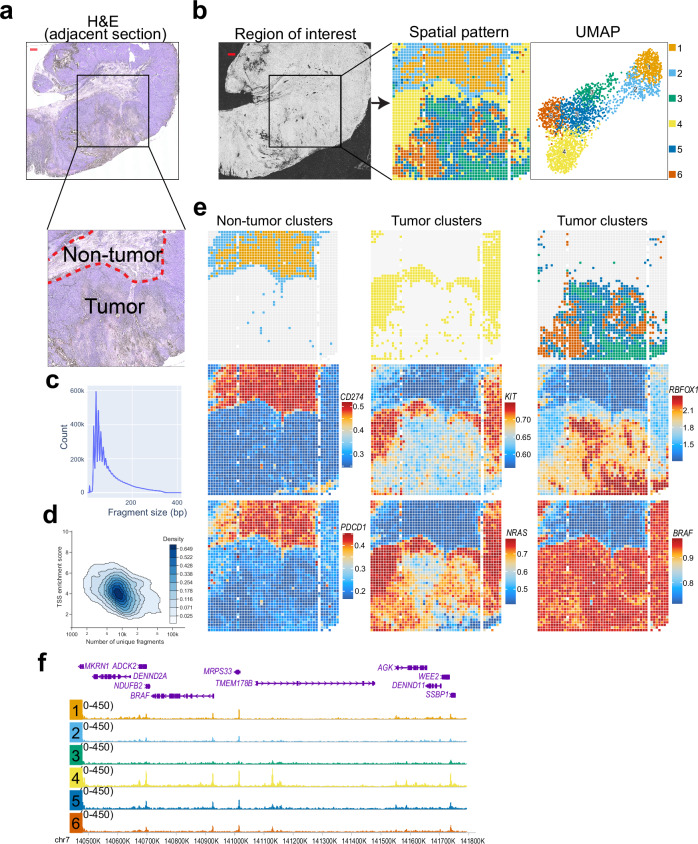
Formalin-fixed paraffin-embedded (FFPE) samples represent a vast, untapped resource for epigenomic research, yet molecular tools for deep analysis of these specimens remain limited. We introduce spatial FFPE-ATAC-seq, an approach for in situ profiling chromatin accessibility within archived tissues. This approach overcomes formalin-induced crosslinking challenges, allowing high-resolution mapping of chromatin landscapes while preserving tissue architecture. Applying spatial FFPE-ATAC-seq to mouse and human tissues, including brain and thymus, reveals intricate spatial organization and distinct cell types in alignment with tissue morphology. Integration with single-cell RNA sequencing validates the precision of our chromatin profiles in identifying key cell types and regulatory elements. We further apply this method to human melanoma, comprehensively characterizing chromatin accessibility across both tumor and non-tumor regions. This method significantly expands the toolkit for epigenomic research, unlocking the potential of an extensive collection of archived FFPE samples for studying gene regulation and disease mechanisms with spatial context.


Conflict of interest statement

Competing interests: Y.D., P.G., and Y.C. have submitted a provisional patent application to the United States Patent and Trademark Office related to the spatial profiling of chromatin accessibility in FFPE tissues described in this work (Application No. 63/675,580). Y.D. is the scientific advisor of AtlasXomics. The remaining authors declare no competing interests.

Figures

Fig. 1
Fig. 1. Spatial-FFPE-ATAC-seq design and data quality.
a Schematic workflow for spatially resolved chromatin accessibility profiling in FFPE tissues using spatial FFPE-ATAC-seq. b Distribution of transcription start site (TSS) enrichment score in different target retrieval (TR) conditions with bulk or 50-µm resolution. PK: proteinase K. c Comparison of TSS enrichment score and number of unique fragments in different TR conditions at 50-µm resolution. Box plots show the median (center line), the first and third quartiles (box limits) and 1.5x interquartile range (whiskers). Fastq files were downscaled to 50 million reads per sample for consistent comparison. d The fragment size distribution for each sample in (c). e The enrichment of ATAC reads around TSS for each sample in (c). f Fragments of samples listed in (b, c) mapping to the mouse genome (FF: n = 3; Bulk: n = 8; Spatial: n = 13). Data are presented as mean ± SD. g Heatmap of all-by-all Spearman correlations between all TR conditions in (c). Correlation was calculated using peak set of each sample. Source data are provided as a Source Data file.
Fig. 2
Fig. 2. Spatial profiling of chromatin accessibility in FFPE mouse brains.
a Spatial-FFPE-ATAC-seq on an FFPE mouse brain section (sample S4_2). Left: tissue scanning after microfluidic device barcoding. Middle: spatial distribution of unique fragments. Right: spatial pattern and UMAP of each cluster. b Spatial mapping of accessibility score of selected marker genes in different clusters for spatial FFPE-ATAC-seq (samples: S4_1 and S4_2) and fresh frozen spatial ATAC-seq (sample: FF_1). c Quantification of ATAC-seq peaks in genomic features extracted from cerebellar region, comparing FF and FFPE samples. (FF: n = 3; FFPE: n = 6; two-tailed Student’s t test). Data are presented as mean ± SD. d Comparison of ATAC-signals of selected genes between FFPE and FF cerebellar clusters. e Integration of scRNA-seq data with spatial-FFPE-ATAC-seq (sample S4_2). f Spatial mapping of selected cell types identified through label transfer. CNINH1: cerebellar inhibitory neuron 1; CBGRC: cerebellar granular cells; MOL1: Mature Oligodendrocyte 1; TEGLU7: telencephalon excitatory neurons 7. Scale bar: 500 μm. ns: not significant. Source data are provided as a Source Data file.
Fig. 3
Fig. 3. Spatial profiling of chromatin accessibility in FFPE human cerebellum.
a Spatial-FFPE-ATAC-seq profiling of a FFPE human cerebellum section (n = 1). Left: tissue scanning after microfluidic device barcoding. Middle: spatial distribution of unique fragments. Right: spatial pattern and UMAP of each cluster. b H&E-stained image of an adjacent tissue section (n = 1). Arrows labeled the molecular layer, cerebellar medulla, and granular layer regions. c Integration of scRNA-seq data with spatial-FFPE-ATAC-seq from human cerebellum. d–f Spatial mapping of selected cell types identified through label transfer: oligodendrocytes (d) and granule cells (e). f, g Genome track visualization of selected marker genes across different clusters. Scale bar: 500 μm.
Fig. 4
Fig. 4. Spatial profiling of chromatin accessibility in FFPE human thymus.
a Schematic illustration of experimental design: 50-μm ATAC (n = 2), 10-μm ATAC (n = 1), and H&E-staining (n = 1). b H&E-stained image of an adjacent tissue section. Dashed circle indicated overlapping area of spatial FFPE-ATAC-seq. Arrows labeled the cortex, septum, medulla, and medulla-cortex (MC) boundary. c, d Spatial FFPE-ATAC-seq profiling of FFPE human thymus sections with different resolutions. Left: tissue scanning before microfluidic device barcoding. Middle: spatial distribution of unique fragments. Right: spatial pattern and UMAP of each cluster. e Integration of scRNA-seq data with spatial-FFPE-ATAC-seq with different resolutions. f Spatial mapping of selected cell types identified through label transfer. TECs: medullary thymic epithelial cells. g, Spatial mapping of gene scores for selected marker genes in different clusters. h–m, 50-μm ATAC (h, j, l) and 10-μm ATAC(i, k, m) data were used for genome track (h, i) and pseudotime analysis (j–m). h–i Genome track visualization of selected marker genes across different clusters. j, k Pseudotemporal reconstruction of T cell development from cortex to medulla region. l, m, Dynamics of gene scores of CD8A and KRT5 along the pseudotime shown in (j, k) respectively. Scale bar: 500 μm.
Fig. 5
Fig. 5. Spatial profiling of chromatin accessibility in FFPE melanoma.
a H&E-stained image of an adjacent tissue section (n = 1). Dashed circle indicated an overlapped area of spatial FFPE-ATAC-seq. Dashed lines indicated the boundary region of tumor and black square labeled the region of interest. b Spatial FFPE-ATAC-seq profiling of FFPE melanoma tissue section (50-μm resolution; n = 1). Left: tissue scanning before microfluidic device barcoding. Right: spatial pattern and UMAP of each cluster. Black square labeled the region of interest. c, d Insert fragments size distribution (c) and TSS enrichment profiles (d) of FFPE melanoma sample. e Spatial mapping of gene scores for selected marker genes in different clusters. f Genome track visualization of selected marker genes across different clusters. Scale bar: 500 μm.

Similar articles

References

    1. Blow, N. Tissue issues. Nature448, 959–960 (2007). - PubMed
    1. Henikoff, S. et al. Epigenomic analysis of formalin-fixed paraffin-embedded samples by CUT&Tag. Nat. Commun.14, 5930 (2023). - PMC - PubMed
    1. Liu, Y., Enninful, A., Deng, Y. & Fan, R. Spatial transcriptome sequencing of FFPE tissues at the cellular level. Preprint at bioRxiv10.1101/2020.10.13.338475 (2020).
    1. Bai, Z. et al. Spatially exploring RNA biology in archival formalin-fixed paraffin-embedded tissues. Cell187, 6760–6779.e6724 (2024). - PMC - PubMed
    1. Gracia Villacampa, E. et al. Genome-wide spatial expression profiling in formalin-fixed tissues. Cell Genomics1, 100065 (2021). - PMC - PubMed

LinkOut - more resources