. 2025 Jul 1;16(1):5755.
doi: 10.1038/s41467-025-60610-x.

An ex vivo uterine system captures implantation, embryogenesis, and trophoblast invasion via maternal-embryonic signaling

Affiliations

An ex vivo uterine system captures implantation, embryogenesis, and trophoblast invasion via maternal-embryonic signaling

Takehiro Hiraoka et al. Nat Commun. .

Abstract

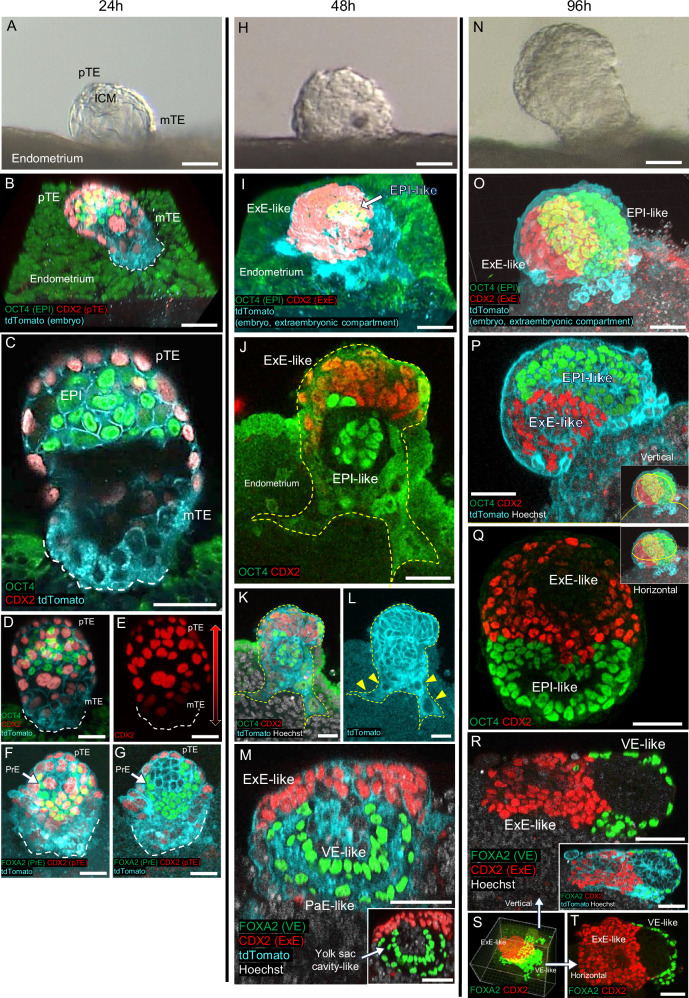
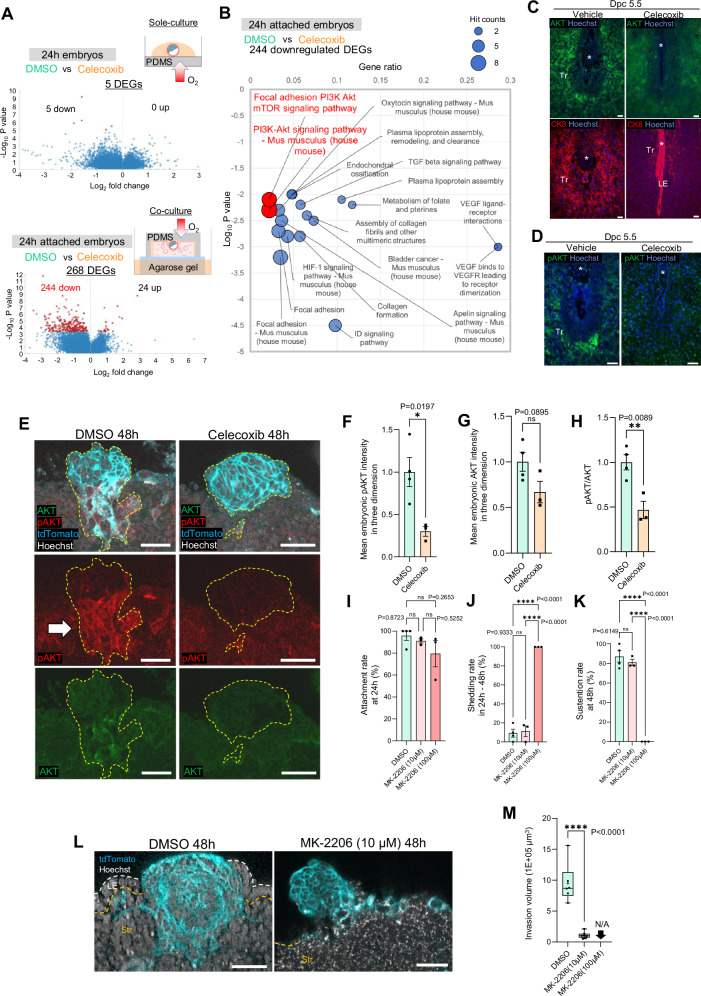
Embryo implantation remains challenging to study because of its inaccessibility in situ despite its essentiality and clinical significance. Although recent studies on long-term culture of authentic and model embryos have provided significant advances in elucidating embryogenesis in vitro, they, without the uterus, cannot genuinely replicate implantation. Here, we have recapitulated bona fide implantation ex vivo at more than 90% efficiency followed by embryogenesis and trophoblast invasion using authentic mouse embryos and uterine tissue. We utilized air-liquid interface culture method with originally developed devices manufactured with polydimethylsiloxane. Notably, the system replicated the robust induction of a maternal implantation regulator COX-2 at the attachment interface, which was accompanied by trophoblastic AKT activation, suggesting a possible signaling that mediates maternal COX-2 and embryonic AKT1 that accelerates implantation. By expanding the ex vivo findings, embryonic AKT1 transduction ameliorated defective implantation of uterine origin by a COX-2 inhibitor in vivo. The system, proposing a potentially standard platform of embryogenesis, offers a concise, reproducible, and scalable screening system, suggesting significant implications for developmental biology and therapeutic strategies for recurrent implantation failure in assisted reproductive technology.


Conflict of interest statement

Competing interests: The authors declare no competing interests.

Figures

Fig. 1
Fig. 1. Establishment of an ex vivo uterine system.
A Isolation of endometrial fragments from dpc 3.75 pregnant recipient mice and E3.75 blastocysts from donor mice. B A stereomicroscopic view of Isolated endometrium and endometrial fragments. Scale bar: 1 mm. C Specification of a PDMS ceiling. D A photograph of the co-culture of embryos and an endometrial fragment on agarose gel covered with a PDMS ceiling. White arrow, an endometrial fragment. E Schematic illustration of ex vivo implantation system. A, C, and E. created with BioRender.com released under a Creative Commons Attribution-NonCommercial-NoDerivs 4.0 International license https://creativecommons.org/licenses/by-nc-nd/4.0/deed.en.
Fig. 2
Fig. 2. Embryogenesis on ex vivo uterus.
Time series observation of attached embryos at 24 h (AG), 48 h (HM), and 96 h (NT). A, H, N. Stereoscopic findings. mTE attachment at 24 h (A), solid cell growth inside the blastocoel at 48 h (H), and embryonic expansion at 96 h (N) were observed on the endometria. n = 5 (A), 4 (H), 7 (N) biologically independent samples. B-G, I-M, O-T. Whole-mount immunofluorescence. B-G. Confocal microscopic images at 24 h. A representative overhead view of a three-dimensionally reconstructed confocal image (B) was dissected in an oblique slice (C), and the front half of the embryo was depicted as overlays (D, E) to visualize CDX2 gradience from pTE to mTE (bilateral arrow). See also Movie S1. F, G. A representative 3D overhead view (F) and a slice (G) of attached embryos stained for CDX2 and a PrE marker FOXA2. White dotted lines indicate the attachment sites (D-G). I-M. Confocal microscopic images at 48 h. A representative 3D image (I) was dissected in an oblique slice (J, K, L), showing the emergence of EPI-/ExE-like compartments (J, K) and nuclear enlargement of invading trophoblasts (arrowheads) (L). Yellow dotted lines indicate the surface of the embryo. See also Movie S2. M. A representative slice from 3D image of whole-mount immunostaining for CDX2 and a VE marker FOXA2. FOXA2-positive undifferentiated PaE-like compartment and yolk sac-like morphology (inset) was identified. See also Movie S3. OT Confocal microscopic images at 96 h. A representative 3D image (O) was dissected in oblique slices (P, Q), showing a more organized form of EPI-/ExE-like compartments than 48 h. See also Movie S4. R-T. Representative slices (R, T) from 3D image (S) of whole-mount immunostaining for CDX2 and FOXA2 show the presence of VE-like compartment. See also Movie S5. ICM, inner cell mass; mTE, mural trophectoderm; pTE, polar trophectoderm; PrE, primitive endoderm; EPI, epiblast; ExE, extraembryonic ectoderm; VE, visceral endoderm; PaE, parietal endoderm; Em, embryo. tdTomato indicates the cell membrane of all embryonic/extraembryonic cell lineages. Scale bars: 50 μm. See also Supplementary Fig. 5 for the efficiencies and the number of independent experiments performed using different recipient animals.
Fig. 3
Fig. 3. Ex vivo uterus harbors genuine cellular components during culture.
AC The UMAP of single-cell RNA-seq of the whole endometria (A) showed similar cell clustering between in vivo and ex vivo. Epithelial cells and stromal cells were further profiled in B, C. Epi, epithelium; Str, stroma; VE, vascular endothelium; VSM, vascular smooth muscle; Mf, macrophages; ILC, innate lymphoid cells; LE_attached, luminal epithelium at embryo-attached sites; LE_unattached, luminal epithelium at embryo-unattached sites; LE_inflam, inflammatory luminal epithelium; GE, glandular epithelium; GE_inflam, inflammatory glandular epithelium; Attached, the stroma of embryo- or PDMS-attached sites (attached stroma); Non_prolif, non-proliferating stroma; Prolif, proliferating stroma; Dec, decidualized stroma; Sub_epi, subepithelial stroma; Sub_VE, subvascular endothelial stroma; Angio, pro-angiogenic fibroblasts; Hypoxy, hypoxic fibroblasts; Inflam, inflammatory fibroblasts.
Fig. 4
Fig. 4. Ex vivo uterus retains uterine components with 3D architecture and captures the features of implantation.
A A representative 3D image of whole-mount immunofluorescence for FOXA2, a marker of uterine glands as well as embryonic PrE. See also Movie S6. B Representative 3D images of whole-mount immunofluorescence for CD45 and F4/80, markers of leukocytes and macrophages, respectively. White arrows indicate the presence of leukocytes and macrophages. See also Movie S7. C Slices from a representative 3D image of whole-mount immunofluorescence for a decidualization marker KLF5. White arrows indicate the induction of KLF5 in the embryo-attached subluminal stroma. Dotted line indicates the boundary between LE and stroma. D Representative 3D images of whole-mount immunofluorescence for FLK-1 and αSMA, markers of VE and VSM, respectively. White dotted areas indicate the avascular region in the vicinity of the embryo attachment site corresponding to in vivo implantation. See also Movie S8. E A slice from representative 3D images of whole-mount immunofluorescence for a proliferation marker Ki67. The cultured ex vivo uterus sustains an appropriate proliferation-differentiation switching (PDS) pattern, an index of uterine receptivity to the embryos. Note the cessation of proliferation in LE essential for ensuing trophoblast invasion. See also Movie S9. Dotted line indicates the boundary between LE and stroma. F Immunofluorescence of CK8 on histological sections at 36 h shows the onset of trophoblast invasion (arrowheads) into the stromal layer of the endometria. G A slice from a representative 3D image of whole-mount immunofluorescence for E-cadherin at 48 h shows the breach and elimination of uterine LE. tdTomato-negative uterine E-cadherin breaks at the boundary with the embryo indicated by white arrows. H H&E staining at 48 h exhibits enlarged nuclei in invading trophoblasts. White and orange dotted lines represent the surface of LE and the boundary between LE and stroma, respectively. PrE, primitive endoderm; Em, embryo; LE, luminal epithelium; GE, glandular epithelium; Str, stroma; Dec, decidua. DsRed2 or tdTomato indicates the mitochondria or cell membrane of all embryonic/extraembryonic cell lineages. Scale bars: 50 μm. Three independent experiments with different recipient animals were performed for all the data.
Fig. 5
Fig. 5. Ex vivo uterus replicates robust induction of COX-2 and mirrors decreased trophoblast invasion by COX-2 inhibition.
A, B Gene ontology analysis of uterine scRNA-seq found enriched lipid metabolic pathways in the attached stroma clustered in Fig. 3C. Modified Fisher’s exact test with P value cutoff   0.05 was used (A). C Attached stroma was detected in in vivo implantation site (IS) and ex vivo inter-implantation site (I-IS) and IS. D Ptgs2 expression in ex vivo attached stroma was highly induced in IS (attached by embryo) compared to I-IS (attached by PDMS), suggesting robust signals from embryos. The P-value was calculated by two-tailed Mann-Whitney’s U-test. E Immunofluorescence of COX-2 on histological sections detects localized expression of COX-2 exclusively at the attachment sites of the endometria both in vivo and ex vivo. F-K. A COX-2 inhibitor celecoxib retards embryonic attachment and trophoblast invasion. Each graph represents the percentage of embryos that attached at 24 h/initially loaded (F), shed between 24 h and 48 h/attached at 24 h (G, H), and sustained on the endometria at 48 h/initially loaded (I). Mean ± SEM (F, G, I). A stereomicroscopic photo (H) shows spontaneously shed embryos at 48 h indicated by arrows. Scale bar: 500 μm. Slices from three-dimensional images show representative trophoblast invasion (J). Examples of higher and lower invasions in each group were presented and the invasion volume was compared (K). The box plot is presented as minimum, lower quartile, median, upper quartile, and maximum. + represents the mean value. White and orange dotted lines represent the surface of LE and the boundary of LE and Str, respectively. Two-tailed unpaired Student’s t-test (F, G, I, K) was used (n = 6 vs 7 (F), 4 vs 5 (G), 4 vs 5 (I), 8 vs 9 (K) biologically independent samples). *, P < 0.05; **, P < 0.01; ***, P < 0.001. White and orange dotted lines represent the surface of LE and the boundary of LE and Str, respectively. DsRed2 or tdTomato indicates the mitochondria or cell membrane of all embryonic/extraembryonic cell lineages. Scale bars: 50 μm. Each plot represents the result per a recipient mouse (F, G, I) or the value for an embryo (K).
Fig. 6
Fig. 6. Ex vivo uterine system suggests a possible signaling that mediates uterine COX-2 and embryonic AKT.
A Bulk RNA-seq of embryos cultured solely and co-cultured with ex vivo uterus for 24 h. The number of DEGs increased in the co-cultured embryos attached to the endometria, suggesting the effect of celecoxib predominantly on the uterus and the signals from the uterus to embryos. DESeq2 Wald test with an adjusted P value cutoff 0.05 using the Benjamini and Hochberg method for multiple testing was performed. The plots were automatically generated by RaNA-seq, and the vertical axis shows the P value before adjustment. B A bobble plot of enrichment analysis on the 244 downregulated DEGs (A) by celecoxib exhibits the suppression of embryonic AKT signaling in ex vivo co-cultured embryos. See also Supplementary Table 1A and B. Accumulative hypergeometric test was used, and all the results involving KEGG Pathway, Reactome Gene Sets, and WikiPathways showing log10 P value less than -2 were plotted. C Representative pictures of immunofluorescence for AKT and CK8 in sequential sections. D Representative pictures of immunofluorescence for pAKT. Asterisks indicate the location of embryos and three independent experiments with different animals were performed (C, D). E Representative slices from three-dimensional images of whole-mount immunofluorescence for AKT and pAKT with celecoxib treatment. Yellow dotted lines indicate the outline of the embryos. The white arrow indicates the activation of AKT in invading trophoblasts. Three-dimensional mean fluorescent intensity values within the surface were computed by Imaris. Each value for AKT (F), pAKT (G), and pAKT/AKT (H) in DMSO group were normalized to 1. Mean ± SEM. I Attachment at 24 h/initially loaded. J. Shedding between 24 h and 48 h/attached at 24 h. K. Sustention on the endometria at 48 h/initially loaded. Mean ± SEM (IK). L Representative slices from three-dimensional images. M. Quantitative data of the invading volumes. The box plot is presented as minimum, lower quartile, median, upper quartile, and maximum. + represents the mean value. LE, luminal epithelium; Str, stroma. Two-tailed unpaired Student’s t-test (F, G, H, M) and ordinary one-way ANOVA with post hoc Tukey’s multiple comparisons test (I, J, K) were used (n = 4 vs 3 (FH), 4 vs 3 vs 3 (IK), 6 vs 7 (M) biologically independent samples). *, P < 0.05; **, P < 0.01; ****, P < 0.0001; ns, not significant. tdTomato indicates the cell membrane of all embryonic/extraembryonic cell lineages. White and orange dotted lines represent the surface of LE and the boundary of LE and Str, respectively. Scale bars: 50 μm. Each plot represents the result per a recipient mouse (IK) or the value for an embryo (FH, M). Scale bars: 50 μm. A. created with BioRender.com released under a Creative Commons Attribution-NonCommercial-NoDerivs 4.0 International license (https://creativecommons.org/licenses/by-nc-nd/4.0/deed.en).
Fig. 7
Fig. 7. Embryonic AKT1 transduction ameliorates invasion defects in the uteri with celecoxib administration ex vivo and in vivo.
AE Ex vivo experiments. A schematic diagram of the ex vivo rescue for celecoxib-induced invasion defect using myr-AKT1-AAV1. AT, acidified Tyrode’s solution. B Attachment at 24 h/initially loaded. C. Sustention on the endometria at 48 h/initially loaded. Mean ± SEM (B, C). D Representative slices from three-dimensional images. E. Quantitative data of the invading volume. The box plot is presented as minimum, lower quartile, median, upper quartile, and maximum. + represents the mean value. FJ In vivo experiments. F A schematic diagram of the in vivo rescue for celecoxib-induced implantation defect using myr-AKT1-AAV1. G The uteri at dpc 5.5 after intravenous injection of blue dye solution. Implantation sites (ISs) are indicated by arrows. H Number of IS per mouse. 16 embryos were transferred to each pseudopregnant mice. Mean ± SEM. I The weight of IS. The box plot is presented as minimum, lower quartile, median, upper quartile, and maximum. + represents the mean value. J Representative photos of immunofluorescence for CK8 on histological sections. Trophoblast invasion was limited in celecoxib+EGFP-AAV1 group compared to vehicle+EGFP-AAV1 and celecoxib+myr-AKT1-AAV1 groups. Yellow arrowheads represent embryos. White dotted line indicates the outer border of invading trophoblasts. GE, glandular epithelium; Str, stroma; Tr, trophoblast. Ordinary one-way ANOVA with post hoc Tukey’s multiple comparisons test (B, C, E, H, I) was used (n = 5 vs 5 vs 5 (B, C), 13 vs 10 vs 8 (E), 4 vs 6 vs 7 (H), 57 vs 16 vs 46 (I) biologically independent samples). *, P < 0.05; **, P < 0.01; ****, P < 0.0001; ns, not significant. tdTomato indicates the cell membrane of all embryonic/extraembryonic cell lineages. Scale bars: 50 μm. K Proposed models of how uterine COX-2 activates embryonic AKT. In model A, PGs bind to PG receptors in TE and activate AKT. In model B, cytokines and growth factors produced downstream of endometrial PG receptors accelerate AKT phosphorylation. Each plot represents the result per a recipient mouse (B, C, H) or the value for an embryo (E, I). A, F, and K created with BioRender.com released under a Creative Commons Attribution-NonCommercial-NoDerivs 4.0 International license (https://creativecommons.org/licenses/by-nc-nd/4.0/deed.en).

References

    1. Glujovsky, D. et al. Cleavage-stage versus blastocyst-stage embryo transfer in assisted reproductive technology. Cochrane Database Syst. Rev.5, CD002118 (2022). - PubMed
    1. Quenby, S. et al. Miscarriage matters: the epidemiological, physical, psychological, and economic costs of early pregnancy loss. Lancet397, 1658–1667 (2021). - PubMed
    1. Shapiro, B. S. et al. Evidence of impaired endometrial receptivity after ovarian stimulation for in vitro fertilization: a prospective randomized trial comparing fresh and frozen-thawed embryo transfer in normal responders. Fertil. Steril.96, 344–348 (2011). - PubMed
    1. Takeda, K. et al. Targeted disruption of the mouse Stat3 gene leads to early embryonic lethality. Proc. Natl Acad. Sci. USA94, 3801–3804 (1997). - PMC - PubMed
    1. Ohtani, T. et al. Dissection of signaling cascades through gp130 in vivo: reciprocal roles for STAT3- and SHP2-mediated signals in immune responses. Immunity12, 95–105 (2000). - PubMed