. 2025 Jul 1;16(1):5616.
doi: 10.1038/s41467-025-60745-x.

Exploitable mechanisms of antibody and CAR mediated macrophage cytotoxicity

Affiliations

Exploitable mechanisms of antibody and CAR mediated macrophage cytotoxicity

Tianyi Liu et al. Nat Commun. .

Abstract

Macrophages infiltrate solid tumors and either support survival or induce cancer cell death through phagocytosis or cytotoxicity. To uncover regulators of macrophage cytotoxicity towards cancer cells, we perform two co-culture CRISPR screens using CAR-macrophages targeting different tumor associated antigens. Both identify ATG9A as an important regulator of this cytotoxic activity. In vitro and in vivo, ATG9A depletion in cancer cells sensitizes them to macrophage-mediated killing. Proteomic and lipidomic analyses reveal that ATG9A deficiency impairs the cancer cell response to macrophage-induced plasma membrane damage through defective lysosomal exocytosis, reduced ceramide production, and disrupted caveolar endocytosis. Depleting non-cytotoxic macrophages using CSF1R inhibition while preventing ATG9A-mediated tumor membrane repair enhances the anti-tumor activity of therapeutic antibodies in mice. Thus, macrophage cytotoxicity plays an important role in tumor elimination during antibody or CAR-macrophage treatment, and inhibiting tumor membrane repair via ATG9A, particularly in combination with cytotoxic macrophage enrichment through CSF1R inhibition, improves tumor-targeting macrophage efficacy.


Conflict of interest statement

Competing interests: F.Y.F. has consulted for Astellas, Bayer, Blue Earth Diagnostics, BMS, EMD Serono, Exact Sciences, Foundation Medicine, Janssen Oncology, Myovant, Roivant, and Varian, and serves on the Scientific Advisory Board for BlueStar Genomics and SerImmune. F.Y.F. has patent applications with Decipher Biosciences, as well as with PFS Genomics/Exact Sciences in breast cancer, all unrelated to this work. L.A.G. has filed patents on CRISPR tools and CRISPR functional genomics, is a co-founder of Chroma Medicine, and a consultant for Chroma Medicine and Arena Bioworks. The remaining authors declare no competing interests.

Figures

Fig. 1
Fig. 1. Co-culture CRISPR screens nominated surface regulators to CAR-macrophage-mediated cytotoxicity.
A Composition of the cell surface-associated CRISPR knockout library, including experimental, essential, non-essential, immune-related, and non-targeting guides. B Schematic showing CAR-M attacking an ovarian cancer cell. C-D Overview of CRISPR co-culture screens using OVCAR-8 cells and either α-EphA2-CAR-Ms (C) or α-CD19-CAR-Ms (D), with cancer-only and co-culture arms. E, F Screen results showing ranked gene-level differential scores for α-EphA2-CAR-M (E) and α-CD19-CAR-M (F) screens, highlighting candidate genes that modulate macrophage-mediated killing. Some elements of this figure were created with BioRender.com and are included under a publication license in accordance with BioRender’s user agreement. Created in BioRender. DeSelm, C. (2025) https://BioRender.com/q45rp4i; BioRender. DeSelm, C. (2025) https://BioRender.com/b4cxqxy.
Fig. 2
Fig. 2. ATG9A protects ovarian cancer cells from CAR-M-induced plasma membrane damage.
A Individual guides KO co-culture experiment to validate top hits of the screen. CD19+ OVCAR-8 cells were cultured alone or with UTD, α-EphA2-CAR or α-CD19-CAR macrophages for 3 days. Live cancer cell % was calculated by normalizing cell counts in the co-cultured group by the cancer-cell-only group at day three (n = 6 biological replicates; mean ± SEM). Box plots showed the median (center line), 25th–75th percentiles (box), and 2.5th–97.5th percentiles (whiskers), with all data plotted. B, C Nuclight Green (NL Green) labeled-OVCAR-8 cells were infected with control guides (sgGAL4); Nuclight Red (NL Red) labeled-cells were infected with test guides. Green cells and red cells were mixed at a one-to-one ratio and were cultured alone or with macrophages for 6 days. n = 3 biological replicates; mean ± SEM). One-way ANOVA followed by Dunnett’s multiple comparisons test was used to determine statistical significance. D sgGAL4 and sgATG9A OVCAR-8 cells were co-cultured with α-EphA2-CAR-Ms in regular 12-well plate or in a 12-well plate with 0.4 μM Transwell inserts for 3 days. (n = 3 biological replicates; mean ± SEM). Statistical significance was determined using two-tailed unpaired Student’s t-tests. E NL Red-labeled sgGAL4 or sgATG9A OVCAR-8 cells and GFP-labeled α-EphA2-CAR-Ms were co-cultured for 2 h. Flow cytometry was used to quantify the percentage of double-positive cells out of total GFP+ macrophages (n = 3 biological replicates; mean ± SEM). Statistical significance was determined using two-tailed unpaired Student’s t-tests. F PI (propidium iodide) PM integrity assay after 2 h co-culture. (n = 3 biological replicates; mean ± SEM). Statistical significance was determined using two-tailed unpaired Student’s t-tests. *P < 0.05; **P < 0.01; ***P < 0.001. Some elements of this figure were created with BioRender.com and are included under a publication license in accordance with BioRender’s user agreement. Created in BioRender. DeSelm, C. (2025) https://BioRender.com/hv2dnxb.
Fig. 3
Fig. 3. ATG9A ablation enhances macrophage-mediated tumor control in vivo.
A, B NSG Mice bearing control (CT) or ATG9A knockout (KO) subcutaneous SKOV3 tumors were treated with IgG (n = 15), or Trastuzumab (n = 25). Tumor volume was monitored over time. Box plots show the median (center line), 25th–75th percentiles (box), and 2.5th–97.5th percentiles (whiskers), with all data plotted. Statistical significance was determined using two-way analysis of variance (ANOVA) followed by Tukey’s post-hoc test. C, D NSG Mice bearing control or KO subcutaneous SKOV3 tumors were treated with IgG (n = 13), or Trastuzumab (n = 14) in combination with clodronate (25 mg/kg) to deplete macrophages. Box plots show the median (center line), 25th–75th percentiles (box), and 2.5th–97.5th percentiles (whiskers), with all data plotted. Statistical significance was determined using two-way analysis of variance (ANOVA) followed by Tukey’s post-hoc test. E, F Schematic and results of an intraperitoneal (IP) SKOV3-luciferase tumor model treated with or without α-EphA2-CAR macrophages (CAR-Ms). Tumor burden was quantified via bioluminescence imaging once weekly (n = 10 for control, n = 15 for CAR-M group). Box plots show the median (center line), 25th–75th percentiles (box), and 2.5th–97.5th percentiles (whiskers), with all data plotted. Representative IVIS images are shown on the right. Statistical significance was determined using two-way analysis of variance (ANOVA) followed by Tukey’s post-hoc test. *P < 0.05; **P < 0.01; ***P < 0.001. Some elements of this figure were created with BioRender.com and are included under a publication license in accordance with BioRender’s user agreement. Created in BioRender. DeSelm, C. (2025) https://BioRender.com/ddmwmhn.
Fig. 4
Fig. 4. ATG9A protects ovarian cancer cells from CAR-macrophage-induced membrane damage and lipid peroxidation.
A Confocal images showing OVCAR-8 cells infected with ATG9A-RFP plasmid and Myr-Palm-GFP plasmid co-cultured alone or with BFP-labeled macrophages. Scale bar = 20 μm. B Quantification of ATG9A-RFP + /Myr-Palm-GFP+ area normalized by ATG9A-RFP+ area in OVCAR-8 cells (n = 30 images, mean ± SEM). Statistical significance was determined using two-tailed unpaired Student’s t-tests. C Control or sgATG9A OVCAR-8 cells were cultured with α-EphA2-CAR-macrophages for 2 h with or without Ca²⁺ (n = 3 biological replicates; mean ± SEM). Statistical significance was determined using two-way ANOVA followed by Tukey’s multiple comparisons test. D, E HaloTag-labeled OVCAR-8 cells were co-cultured with α-EphA2-CAR-macrophages for 2 h with permeable or impermeable ligands (n  = 4 biological replicates; mean ± SEM). Statistical significance was determined using two-way ANOVA followed by Tukey’s multiple comparisons test. F Schematic showing membrane samples isolated from flow-sorted cancer cells were submitted for lipidomics. G Normalized lipid peroxidation was calculated by dividing the abundance of peroxidized lipids by the abundance of lipids prior to transformation (n = 26 lipid species; mean ± SEM). Statistical significance was determined using two-way ANOVA followed by Tukey’s multiple comparisons test. H Lipid peroxidation in control or KO OVCAR-8 cells pre- or post-co-culture was quantified by a lipid peroxidation sensor (n = 35 biological replicates; mean ± SEM). Statistical significance was determined using two-way ANOVA followed by Tukey’s multiple comparisons test. I IncuCyte co-culture experiment with different inhibitors blocking NO or ROS (n = 4 biological replicates; mean ± SEM). Statistical significance was determined using two-way ANOVA followed by Tukey’s multiple comparisons test. *P < 0.05; **P < 0.01; ***P < 0.001. Some elements of this figure were created with BioRender.com and are included under a publication license in accordance with BioRender’s user agreement. Created in BioRender. DeSelm, C. (2025) https://BioRender.com/7iu7qmq.
Fig. 5
Fig. 5. ATG9A loss impairs caveolae structure and sensitizes ovarian cancer cells to CAR-macrophage cytotoxicity.
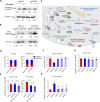
A Surface proteomic profiling comparing control (sgGAL4) and ATG9A knockout (sgATG9A) OVCAR-8 cells revealed significant downregulation of multiple caveolae-associated proteins, including CAVIN1 and CAVIN2 (highlighted with boxes). B Western blot validation confirming reduced expression of CAVIN1 and CAVIN2 upon ATG9A loss. C Quantification of CAVIN2-ATG9A colocalization in OVCAR-8 cells transfected with ATG9A-RFP and CAVIN2-GFP, either cultured alone or co-cultured with CAR macrophages for 24 h (n = 15 biological replicates, mean ± SEM). Statistical significance was determined using two-tailed unpaired Student’s t-tests. D Three-day IncuCyte co-culture experiment using control, ATG9A KO, CAVIN2 KO and CAVIN2 KO OVCAR-8 cells and α-EphA2-CAR macrophages (n = 3 biological replicates; mean ± SEM). Statistical significance was determined using two-tailed unpaired Student’s t-tests. E PI uptake assay measuring plasma membrane permeability OVCAR-8 cells infected with different sgRNAs co-cultured with α-EphA2-CAR macrophages (n = 5 biological replicates; mean ± SEM). Statistical significance was determined using two-tailed unpaired Student’s t-tests. *P < 0.05; **P < 0.01; ***P < 0.001.
Fig. 6
Fig. 6. ATG9A facilitates cancer cell membrane repair after macrophage-induced damage by recruiting ceramide to sites of damage.
A Lipidomics was performed using isolated membrane samples from control and KO OVCAR-8 cells from cancer-only group or sorted from α-EphA2-CAR macrophage co-culture (n = 2 biological replicates). Ceramide species were highlighted in red. B Schematic demonstrating the plasma membrane repair process on cancer cell surface upon macrophage attack. C-D Immunofluorescent staining was performed using anti-ceramide and anti-caveolin-1 antibodies. Scale bar = 20 μm. Ceramide colocalization with caveolin-1 was quantified as Pearson correlation coefficient (n = 12 biological replicates, mean ± SEM). Statistical significance was determined using two-way ANOVA with Tukey’s multiple comparisons test. E Control and KO OVCAR-8 cells were co-cultured with α-EphA2-CAR macrophages or cultured alone; Cancer surface lamp-1 expression was quantified by flow cytometry (n = 4 biological replicates; mean ± SEM). Statistical significance was determined using two-tailed unpaired Student’s t-tests. F Live cell percentage was calculated by the cell count of co-cultured OVCAR-8 cells treated with media, Amitriptyline, or GW4869 normalized by their cancer-only controls (n = 3 biological replicates; mean ± SEM). Statistical significance was determined using two-way ANOVA with Tukey’s multiple comparisons test. G PM integrity assay was performed using control or KO OVCAR-8 cells cultured with α-EphA2-CAR macrophages for 2 h under different treatments (n = 3 biological replicates; mean ± SEM). Statistical significance was determined using two-way ANOVA with Tukey’s multiple comparisons test. H, I sgGAL4 or sgATG9A OVCAR-8 cells were co-cultured with α-EphA2-CAR macrophages with or without recombinant (rb) ASMase (n = 3 biological replicates; mean ± SEM). Statistical significance was determined using two-way ANOVA with Tukey’s multiple comparisons test. *P < 0.05; **P < 0.01; ***P < 0.001. Some elements of this figure were created with BioRender.com and are included under a publication license in accordance with BioRender’s user agreement. Created in BioRender. DeSelm, C. (2025) https://BioRender.com/5ap5yy9.
Fig. 7
Fig. 7. ATG9A-mediated plasma membrane repair after macrophage-induced damage is autophagy-independent.
A Western blot analysis of autophagic flux in control and KO OVCAR-8 cells. Chloroquine was added to prevent autophagosome degradation. B Western blot using control or sgATG9A SKOV-3/OVCAR-8 cells to examine p62 expression. C Overview of different roles of ATG9A. LC3: Microtubule-associated proteins 1 A/1B light chain 3; PE: Phosphatidylethanolamine; SNX18: Sorting Nexin 18; AP-1: Adapter Protein Complex 1; AP-2: Adapter Protein Complex 2; Rab11: Ras-related protein Rab-11A; VAMP7: Vesicle-associated membrane protein 7; Syt VII: Synaptotagmin-7; SNAP-23: Synaptosomal-associated protein, 23 kDa; STX-4: Syntaxin-4; TGN: Trans-Golgi Network; Faa1: Fatty acid amide hydrolase 1; ER: Endoplasmic Reticulum. D Competition assay using regular media or media with Autophinib (n = 3 biological replicates; mean ± SEM). Statistical significance was determined using two-tailed unpaired Student’s t-tests. E CAR-M Co-culture experiments using sgGAL4, sgATG9A OVCAR-8 cells and sgATG9A cells with Autophinib treatment (n = 4 biological replicates; mean ± SEM). Statistical significance was determined using two-way ANOVA with Tukey’s multiple comparisons test. F-G Live cell percentage or relative PI+ number were normalized to the cell count or PI+ cell number in the cancer-only group (n = 4 biological replicates; mean ± SEM). Statistical significance was determined using two-tailed unpaired Student’s t-tests. H Cell proliferation at day 3 normalized to cell number at day 0 (n = 3 biological replicates; mean ± SEM). Statistical significance was determined using two-tailed unpaired Student’s t-tests. *P < 0.05; **P < 0.01; ***P < 0.001. Some elements of this figure were created with BioRender.com and are included under a publication license in accordance with BioRender’s user agreement. Created in BioRender. DeSelm, C. (2025) https://BioRender.com/xrev1ob.
Fig. 8
Fig. 8. ATG9A KO ovarian cancer cells induced inflammatory cytokine secretion in vitro.
A RNA-seq analysis using control and ATG9A KO OVCAR-8 cells. B Gene Set Enrichment Analysis (GSEA) using the Hallmark gene set. CE Cytokine array using conditioned media derived from control or ATG9A KO OVCAR-8 cells (n = 2 biological replicates; mean ± SEM). Statistical significance was determined using unpaired two-sided t-tests for each cytokine. F qRT-PCR confirming upregulation of inflammatory cytokines in sgATG9A OVCAR-8 cells compared to control cells. (n = 4 biological replicates; mean ± SEM). Statistical significance was determined using unpaired two-sided t-tests for each cytokine. *P < 0.05; **P < 0.01; ***P < 0.001.
Fig. 9
Fig. 9. Combination treatment with Trastuzumab and CSF1R inhibitor induces tumor regression in ATG9A KO tumors.
A Trastuzumab-treated sgGAL4 and sgATG9A tumors were processed for single-cell RNA-Seq library preparation (6 tumors from individual sgGAL4 mice were pooled into two samples [three tumors per sample], and the same was done for 6 tumors from sgATG9A mice. 10,000 cells were analyzed per sample). B t-distributed stochastic neighbor embedding (tSNE) plot shows clustering of cells (K-Means = 2). Two major clusters of macrophages were identified. Cytotoxic macrophages, marked by elevated Nos, Cox2, Lcn2, and S100a8 expression; and regulatory macrophages, indicated by increased Cx3cr1, Cd206, Tgf-β, and Il10 expression. C Cell numbers of cytotoxic and regulatory macrophages were quantified for both sgGAL4 and sgATG9A tumors (mean ± SEM). Statistical significance was determined using two-tailed unpaired Student’s t-tests. D Violin plots show Log2 combined cytotoxic or regulatory macrophage markers expression. Violin plots display the distribution of gene expression across cells (via kernel density estimation), with an overlaid box plot showing the median and interquartile range (25th–75th percentiles); whiskers extend to the full data range (minimum and maximum values). E Cells with high csf1r expression were plotted in purple, low-csf1r-cells were shown in gray. FCsf1r high percentage in the regulatory and cytotoxic clusters from ATG9A KO tumors were quantified (mean ± SEM). Statistical significance was determined using two-tailed unpaired Student’s t-tests. scRNA-seq data was obtained from two biological replicates per condition; each replicate consisted of 10,000 cells pooled from 3 mice. While each cell provides an individual measurement, statistical comparisons between conditions should be interpreted with caution due to the limited number of pooled biological replicates (n = 2). G, H Tumor size summary of control or KO tumors under CSF1Ri alone (n = 10 tumors) or combined Trastuzumab + CSF1Ri treatment during 6 weeks (n = 30 tumors). I Summarized sgGAL4 and sgATG9A tumor growth under Trastuzumab alone (n = 25 tumors; mean ± SEM) or Trastuzumab + CSF1Ri (n = 30 tumors; mean ± SEM). Statistical significance was determined using two-way analysis of variance (ANOVA) followed by Tukey’s post-hoc test. *P < 0.05; **P < 0.01; ***P < 0.001. Some elements of this figure were created with BioRender.com and are included under a publication license in accordance with BioRender’s user agreement. Created in BioRender. DeSelm, C. (2025) https://BioRender.com/qqmbp7u.
Fig. 10
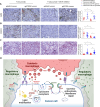
Fig. 10. CSF1R inhibition enhances cytotoxic macrophage recruitment in ATG9A-deficient ovarian tumors.
AC Immunohistochemistry (IHC) staining for F4/80(pan-macrophage marker), CX3CR1 (regulatory macrophage marker), and iNOS (cytotoxic macrophage marker) in sgGAL4 (control) and sgATG9A (KO) tumors treated with either trastuzumab alone or in combination with a CSF1R inhibitor. (n = 15 biological replicates; mean ± SEM). Statistical significance was determined using two-way analysis of variance (ANOVA) followed by Tukey’s post-hoc test. Scale bar = 100 μm. D Normally, macrophage-mediated cancer cytotoxicity is limited because tumor-derived cytokines polarize macrophages towards a pro-tumor regulatory phenotype. Cancer cells resist macrophage cytotoxicity through a plasma membrane repair mechanism characterized by ATG9A-dependent lysosome exocytosis, aSMase-mediated ceramide production, and caveolar endocytosis. ATG9A-mediated lipid mobilization from lipid droplets provides essential lipids for plasma membrane repair. ATG9A ablation in tumor cells skews their cytokine production and polarizes macrophages towards a ROS-producing, cytotoxic phenotype. These cytotoxic macrophages induce plasma membrane damage and lipid peroxidation in cancer cells. Without ATG9A-mediated repair, accumulation of plasma membrane damage ultimately results in cancer cell death. *P < 0.05; **P < 0.01; ***P < 0.001. Some elements of this figure were created with BioRender.com and are included under a publication license in accordance with BioRender’s user agreement. Created in BioRender. DeSelm, C. (2025) https://BioRender.com/pkz1u1k.

References

    1. Barkal, A. A. et al. CD24 signalling through macrophage Siglec-10 is a target for cancer immunotherapy. Nature572, 392–396 (2019). - PMC - PubMed
    1. Majeti, R. et al. CD47 Is an adverse prognostic factor and therapeutic antibody target on human acute myeloid leukemia stem cells. Cell138, 286–299 (2009). - PMC - PubMed
    1. Yang, H., Xun, Y. & You, H. The landscape overview of CD47-based immunotherapy for hematological malignancies. Biomark. Res.11, 15 (2023). - PMC - PubMed
    1. Klichinsky, M. et al. Human chimeric antigen receptor macrophages for cancer immunotherapy. Nat. Biotechnol.38, 947–953 (2020). - PMC - PubMed
    1. Morrissey, M. A. et al. Chimeric antigen receptors that trigger phagocytosis. eLife7, e36688 (2018). - PMC - PubMed

MeSH terms

Substances