. 2025 Jul 1;16(1):6019.
doi: 10.1038/s41467-025-60775-5.

RFC1 regulates the expansion of neural progenitors in the developing zebrafish cerebellum

Affiliations

RFC1 regulates the expansion of neural progenitors in the developing zebrafish cerebellum

Fanny Nobilleau et al. Nat Commun. .

Abstract

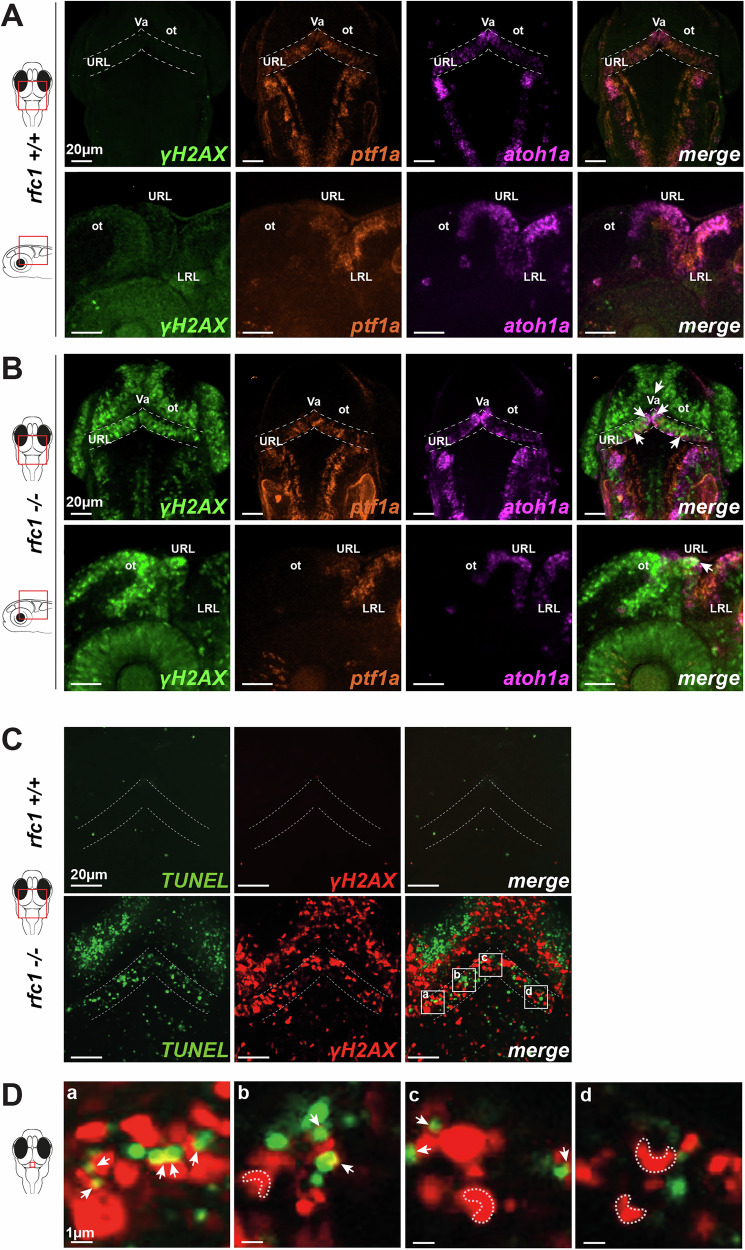
DNA replication and repair are basic yet essential molecular processes for all cells. RFC1 encodes the largest subunit of the Replication Factor C, an essential clamp-loader for DNA replication and repair. Intronic repeat expansion in RFC1 has recently been associated with so-called RFC1-related disorders, which mainly encompass late-onset cerebellar ataxias. However, the mechanisms making certain tissues more susceptible to defects in these universal pathways remain mysterious. Here, we provide the first investigation of RFC1 gene function in vivo using zebrafish. We showed that RFC1 is expressed in neural progenitor cells within the developing cerebellum, where it maintains their genomic integrity during neurogenic maturation. Accordingly, RFC1 loss-of-function leads to a severe cerebellar phenotype due to impaired neurogenesis of both Purkinje and granule cells. Our data point to a specific role of RFC1 in the developing cerebellum, paving the way for a better understanding of the pathogenic mechanisms underlying RFC1-related disorders.


Conflict of interest statement

Competing interests: E.S. is a co-founder of DanioDesign Inc. (QC, Canada) and of Osta Therapeutics (France); N.P. is a co-founder of Neurenati Therapeutics (QC, Canada). These commercial affiliations did not play any role in investigational design, data collection and analysis, the decision to publish or the preparation of the manuscript. The remaining authors declare no competing interests.

Figures

Fig. 1
Fig. 1. RFC1 is expressed in the developing cerebellum.
A Whole-mount in situ hybridization for rfc1 shows specific, though not exclusive, expression in the developing cerebellum of zebrafish embryos at 1 and 2 days post-fertilization (dpf) (arrowheads; n ≥ 10 per stage). BF RNAscope in situ hybridization detecting rfc1, ptf1a, and atoh1a transcripts at 1 dpf (B), 2 dpf (C), and 3 dpf (D); and rfc1, pvalb7, and neurod1 at 4 dpf (E) and 5 dpf (F). ot optic tectum, mhb midbrain-hindbrain boundary, URL upper rhombic lip, LRL lower rhombic lip, Va valvula cerebelli, CCe corpus cerebelli, LCa lobus caudalis cerebelli; n = 5 per stage. GJ Co-immunofluorescence for RFC1 (red) and either PAX6 (granule cell marker, green) or calbindin (Calb, Purkinje cell marker, green) in the developing mouse cerebellum at postnatal day P0 (G), P7 (H), P11 (I), and P60 (J). RFC1 is detected in Purkinje cell progenitors (PCp, arrows in G) but absent from granule cell progenitors (GCp, asterisks and arrowheads in G). From P11 onwards, RFC1 is observed in some migratory granule cells (mGC, arrowheads in I) and in Purkinje cells (PC, arrows in H, I). At P60 (J), RFC1 remains detectable in Purkinje cells (PC, arrows) and in ectopic granule cells located in the molecular layer (eGC, arrowheads). For each stage, images are representative of N = 3 animals for P0, P7, and P60, and N = 4 animals for P11, with n = 6 fields of view per animal. ML molecular layer, PCL Purkinje cell layer, IGL internal granular layer. Scale bars: 50 μm (BF), 20 μm (GJ).
Fig. 2
Fig. 2. Rfc1 loss-of-function leads to premature death, head morphological anomalies and motility defects in zebrafish.
AC Generation of an rfc1 mutant zebrafish line carrying a 20-bp deletion in exon 5, confirmed by Sanger sequencing (B). This deletion induces a frameshift resulting in a premature stop codon at position 182 (p.S182X), upstream of all three conserved RFC1 functional domains: BRCT, ATPase+ AAA-type, and DNA replication domains (C). D RT-qPCR quantification of rfc1 transcript levels showing a significant reduction in heterozygous (rfc1+/−, n = 3) and homozygous mutant (rfc1−/−, n = 3) larvae compared to wild-type (rfc1+/+, n = 2). E Survival curve of zebrafish larvae showing premature lethality of rfc1−/− individuals by 10 days post-fertilization (dpf). F Representative images of larvae at 3 and 5 dpf showing reduced head and eye size in rfc1−/− larvae, but not in heterozygous siblings. G, H Quantification of craniofacial parameters in rfc1 mutant larvae. G Head length at 3 dpf (n = 22 rfc1+/+, 26 rfc1+/–, 26 rfc1–/–) and 5 dpf (n = 16 rfc1+/+, 41 rfc1+/–, 19 rfc1–/–). H Eye diameter at 3 dpf (n = 22 rfc1+/+, 28 rfc1+/–, 26 rfc1–/–) and 5 dpf (n = 16 rfc1+/+, 22 rfc1+/–, 20 rfc1–/–). I Quantification of total distance swum over 1 h (lights off), demonstrating significant hypomotility in rfc1−/− larvae at 5 dpf compared to siblings (N = 3, n = 101 rfc1+/+, 160 rfc1+/−, 107 rfc1−/−). J Representative swimming tracks recorded over 10 min at 5 dpf, illustrating reduced locomotor activity in rfc1−/− larvae. Data in (D, GI) are presented as mean ± SEM; individual dots represent biological replicates. Statistical analysis: one-way ANOVA with multiple comparisons. ns not significant (p > 0.05); * (p ≤ 0.05); ** (p ≤ 0.01); *** (p ≤ 0.001); **** (p ≤ 0.0001).
Fig. 3
Fig. 3. Rfc1−/− zebrafish larvae exhibit severe cerebellar defects.
A Hematoxylin and eosin-stained transverse section of 5 days post-fertilization (dpf) zebrafish larvae at the level of the hindbrain, showing cerebellar hypoplasia in rfc1−/− larvae compared to wild-type (n = 3) and heterozygous (n = 5) siblings. ot optic tectum, cb, cerebellum, hl hypothalamus. BD Immunostaining for cerebellar cell types in wild-type and rfc1−/− larvae at 3, 4, and 5 dpf. B Granule cells labeled with anti-Neurod1 antibody. C Granule cell axonal projections labeled with anti-Vglut1 antibody (at 3 dpf n = 6 rfc1+/+, 8 rfc1−/−; at 4 dpf n = 5 rfc1+/+, 6 rfc1−/−; and at 5 dpf n = 7 rfc1+/+, 17 rfc1−/−). D Purkinje cells labeled with anti-Parvalbumin7 (Pvalb7) antibody. Dotted lines outline the cerebellar structures, highlighting cerebellar loss at 5 dpf in rfc1−/− larvae. Asterisks indicate regions of cell loss. E, F Quantification of Neurod1-positive (E, at 3 dpf N = 2, n = 6 rfc1+/+, 9 rfc1+/−, 11 rfc1−/− and at 5 dpf N = 2, n = 10 rfc1+/+, 10 rfc1+/−, 10 rfc1−/−) and Pvalb7-positive (F, at 3 dpf N = 2, n = 6 rfc1+/+, 9 rfc1+/−, 5 rfc1−/− = 5, and at 5 dpf N = 2, n = 9 rfc1+/+, 10 rfc1+/−, 10 rfc1−/−) cells at 3 and 5 dpf in rfc1+/+, rfc1+/–, and rfc1−/ larvae. G Confocal imaging of transgenic [olig2:GFP] zebrafish larvae injected with Cas9 (control) or CRISPR targeting rfc1 (CRISPant) at 3 and 5 dpf, showing reduced olig2+ cell populations in CRISPants. H Quantification of olig2-positive cells in Cas9 and rfc1 CRISPant larvae (N = 2, at 3 dpf n = 8 Cas9, 9 rfc1 CRISPant and at 5 dpf n = 8 Cas9, 8 rfc1 CRISPant). Data in (E, F, H) are presented as mean ± SEM; individual dots represent biological replicates. Statistical analysis: one-way ANOVA with multiple comparisons (E, F) or unpaired t-test (H). ns, not significant (p > 0.05); * (p ≤ 0.05); ** (p ≤ 0.01); *** (p ≤ 0.001); **** (p ≤ 0.0001). Va valvula cerebelli, CCe corpus cerebelli, LCa lobus caudalis cerebelli, EG eminentia granularis. Scale bars: 50 μm (AG).
Fig. 4
Fig. 4. RFC1 is expressed in early neural progenitors and is required for their proliferation.
A Workflow for single-cell RNA sequencing (scRNA-seq). Microdissected heads (2 dpf) or brains (4 dpf) from rfc1+/+ and rfc1−/− larvae were pooled (three heads at 2 dpf or four brains at 4 dpf), dissociated, and processed for scRNA-seq using 10X Genomics technology. Created in BioRender. Samarut, E. (2025) https://BioRender.com/k7eukl7. B, D Uniform manifold approximation and projection (UMAP) plots of scRNA-seq data from 4 dpf (B) and 2 dpf (D) microdissected brains of rfc1+/+ and rfc1−/− larvae. Clusters of cells have been annotated following Seurat’s standard procedure, based on the accumulation of specific genes within top markers (see Supplementary Fig. S5B, C). C, E Proportions of cells in each identified cluster at 4 dpf (C) and 2 dpf (E), with UMAPs highlighting clusters significantly reduced in rfc1−/− brains. F RT-qPCR quantification of atoh1a, atoh1b, atoh1c, and ptf1a transcript levels in whole larvae at 3 dpf (rfc1+/+, rfc1+/–, and rfc1−/, with n = 5 for each condition). G Whole-mount in situ hybridization for atoh1a, atoh1b, atoh1c, and ptf1a transcripts at 3 dpf in rfc1+/+ and rfc1−/− larvae. Expression in the cerebellum of wild-type larvae is indicated by arrowheads; loss of expression in mutants is marked by asterisks. H RNAscope in situ hybridization for ptf1a and atoh1a at 3 dpf in rfc1+/+ and rfc1−/− larvae. Scale bars: 50 μm. ot optic tectum, Va valvula cerebelli, CCe corpus cerebelli. Data in (F) are presented as mean ± SEM; individual dots represent biological replicates. Statistical analysis: one-way ANOVA with multiple comparisons. ns not significant (p > 0.05); * (p ≤ 0.05); ** (p ≤ 0.01); *** (p ≤ 0.001); **** (p ≤ 0.0001).
Fig. 5
Fig. 5. RFC1 loss-of-function impairs neural progenitor proliferation and induces cell death.
A, B Dot plots showing the expression of genes related to DNA damage sensing, cell cycle checkpoints, proliferation, DNA repair, and apoptosis across individual scRNA-seq clusters at 2 dpf (A) and 4 dpf (B) in rfc1+/+ and rfc1−/− brains (see Supplementary Fig. S4B, C for cluster annotations). Icons are created in BioRender. Samarut, E. (2025) https://BioRender.com/k7eukl7. CE Immunostaining in the developing brain at 3 dpf using: C anti-γH2AX antibody (marker of DNA double-strand breaks), D anti-phospho-Histone H3 (PH3) antibody (mitotic marker), E anti-cleaved caspase-3 (casp3) antibody (apoptosis marker). Dotted lines delineate the developing cerebellum. FH Quantification of γH2AX⁺, PH3⁺, and caspase-3⁺ cells in the whole brain of rfc1+/+, rfc1+/–, and rfc1–/– larvae at 2 and 3 dpf. F γH2AX-positive cells: 2 dpf (n = 10 rfc1+/+, 9 rfc1+/–, 11 rfc1–/–), 3 dpf (n = 10 rfc1+/+, 10 rfc1+/–, 10 rfc1–/–), N = 2. G PH3-positive cells: 2 dpf (n = 9 rfc1+/+, 11 rfc1+/–, 7 rfc1–/–), 3 dpf (n = 8 rfc1+/+, 8 rfc1+/–, 8 rfc1–/–), N = 2. H Casp3-positive cells: 2 dpf (n = 6 rfc1+/+, 10 rfc1+/–, 9 rfc1–/–), 3 dpf (n = 11 rfc1+/+, 15 rfc1+/–, 14 rfc1–/–), N = 3. (I–K) Quantification of γH2AX⁺ (I), PH3⁺ (J), and caspase-3⁺ (K) cells in the cerebellum of rfc1+/+, rfc1+/–, and rfc1–/– larvae at 2 and 3 dpf. I γH2AX-positive cells: 2 dpf (n = 10 rfc1+/+, 10 rfc1+/–, 11 rfc1–/–), 3 dpf (n = 10 rfc1+/+, 10 rfc1+/–, 10 rfc1–/–), N = 2. J PH3-positive cells cells: 2 dpf (n = 8 rfc1+/+, 9 rfc1+/–, 9 rfc1–/–), 3 dpf (n = 8 rfc1+/+, 9 rfc1+/–, 10 rfc1–/–), N = 2. K Casp3-positive cells: 2 and 3 dpf (n = 11 rfc1+/+, 15 rfc1+/–, 14 rfc1–/–), N = 3. Data in (FK) are presented as mean ± SEM; individual dots represent biological replicates. Statistical analysis: one-way ANOVA with multiple comparisons. ns not significant (p > 0.05); * (p ≤ 0.05); ** (p ≤ 0.01); *** (p ≤ 0.001); **** (p ≤ 0.0001). Scale bars: 20 μm (AC), 1 μm (D).
Fig. 6
Fig. 6. Cerebellar neural progenitors accumulate DNA damage and undergo apoptosis in the absence of RFC1.
A, B Combined immunofluorescence and RNAscope in situ hybridization for DNA damage marker γH2AX (green), ptf1a (orange), and atoh1a (magenta) at 2 dpf in rfc1+/+ (A, n = 5) and rfc1−/− (B, n = 5) embryos. Dorsal views (upper panels) and lateral views (lower panels) are shown. Dotted lines outline the upper rhombic lip (URL). ot optic tectum, LRL lower rhombic lip, Va valvula cerebelli. C Confocal images (1-μm optical slice) showing colocalization of apoptotic cells (TUNEL, green) and DNA damage (γH2AX, red) at 2 dpf in rfc1+/+ (n = 5) and rfc1-/- (n = 5) embryos. Dotted lines delineate the cerebellar region. D Higher magnification of selected regions from (C) (a–d), highlighting colocalization of TUNEL and γH2AX signals (white arrows) and characteristic γH2AX apoptotic ring patterns (dotted outlines).

Similar articles

References

    1. Voogd, J. The human cerebellum. J. Chem. Neuroanat.26, 243–252 (2003). - PubMed
    1. Purves, D. et al. Circuits within the Cerebellum (Sinauer Associates, 2001).
    1. Fine, E. J., Ionita, C. C. & Lohr, L. The history of the development of the cerebellar examination. Semin. Neurol.22, 375–384 (2002). - PubMed
    1. Roostaei, T., Nazeri, A., Sahraian, M. A. & Minagar, A. The human cerebellum: a review of physiologic neuroanatomy. Neurol. Clin.32, 859–869 (2014). - PubMed
    1. Manto, M. et al. Consensus paper: roles of the cerebellum in motor control-the diversity of ideas on cerebellar involvement in movement. Cerebellum11, 457–487 (2012). - PMC - PubMed

MeSH terms

LinkOut - more resources