. 2025 Jul 1;16(1):5595.
doi: 10.1038/s41467-025-60721-5.

Interdependence of Pasha and Drosha for localization and function of the Microprocessor in C. elegans

Affiliations

Interdependence of Pasha and Drosha for localization and function of the Microprocessor in C. elegans

Thiago L Knittel et al. Nat Commun. .

Abstract

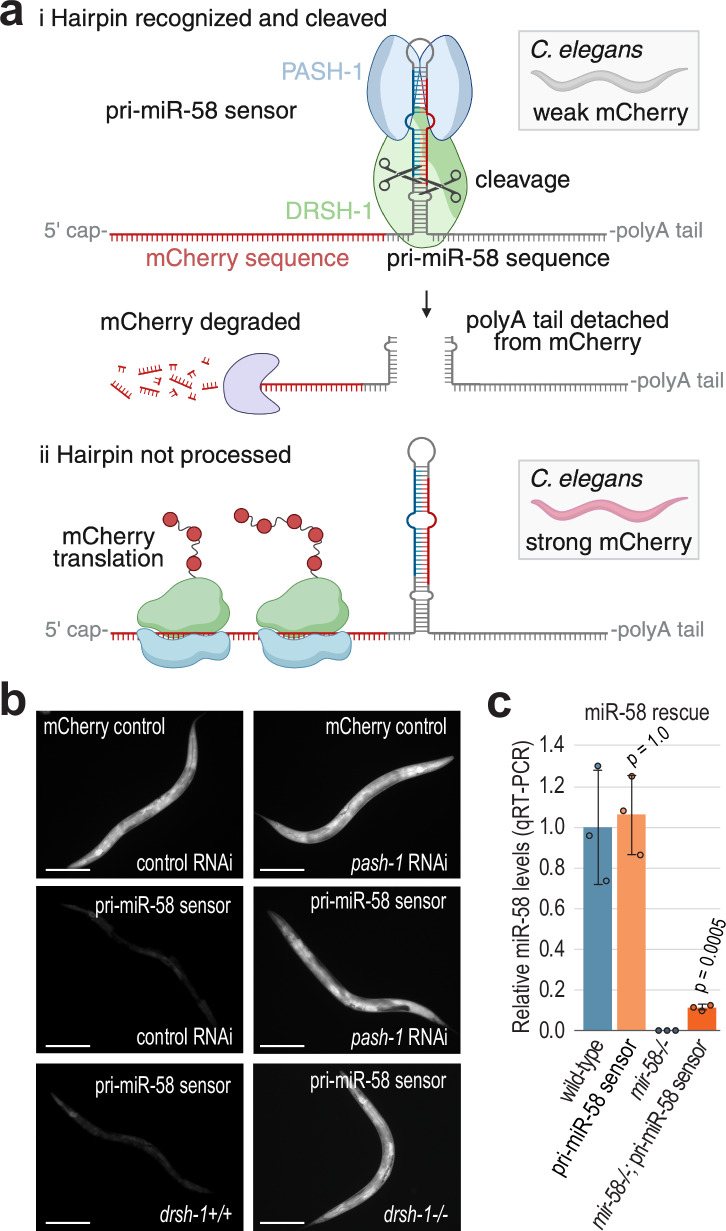
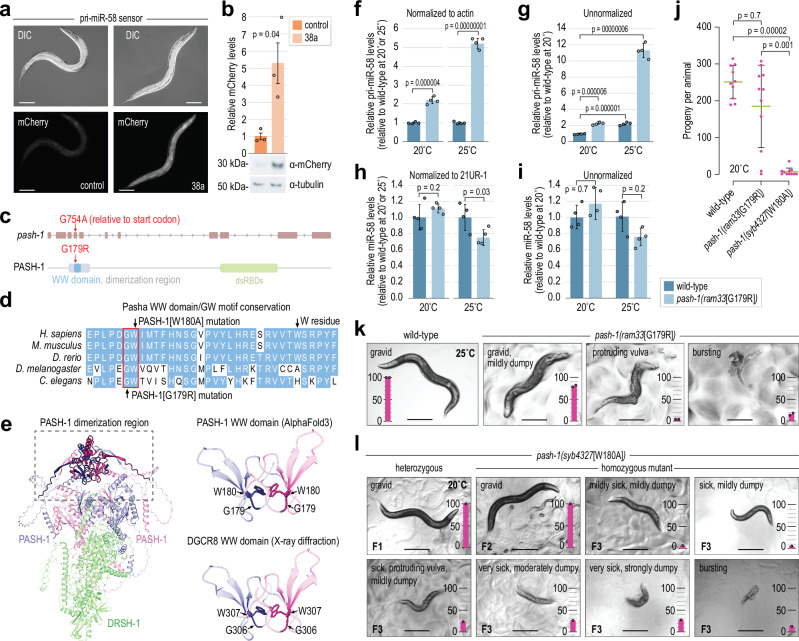
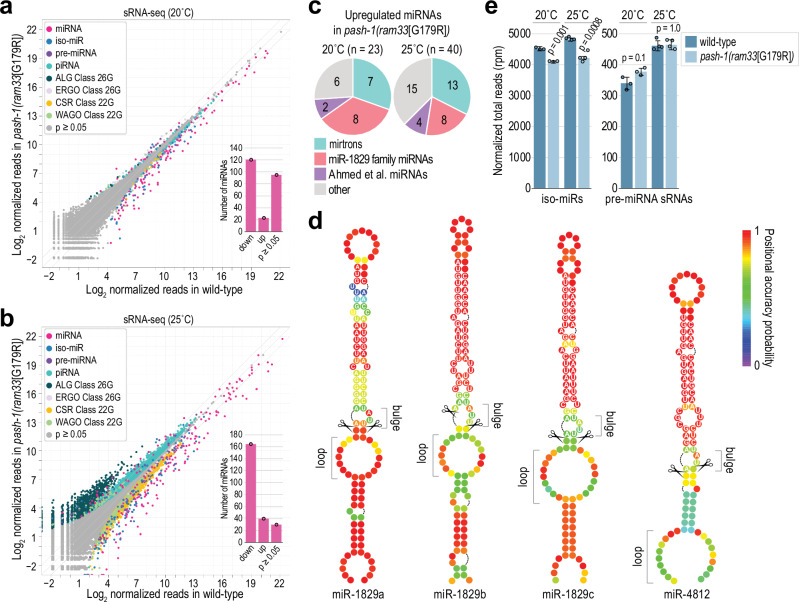
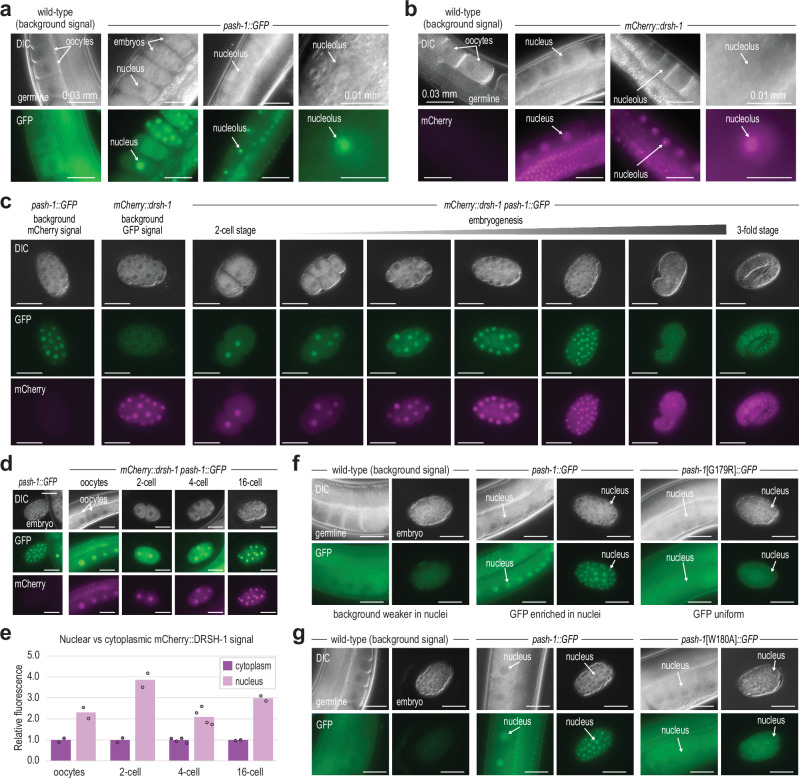
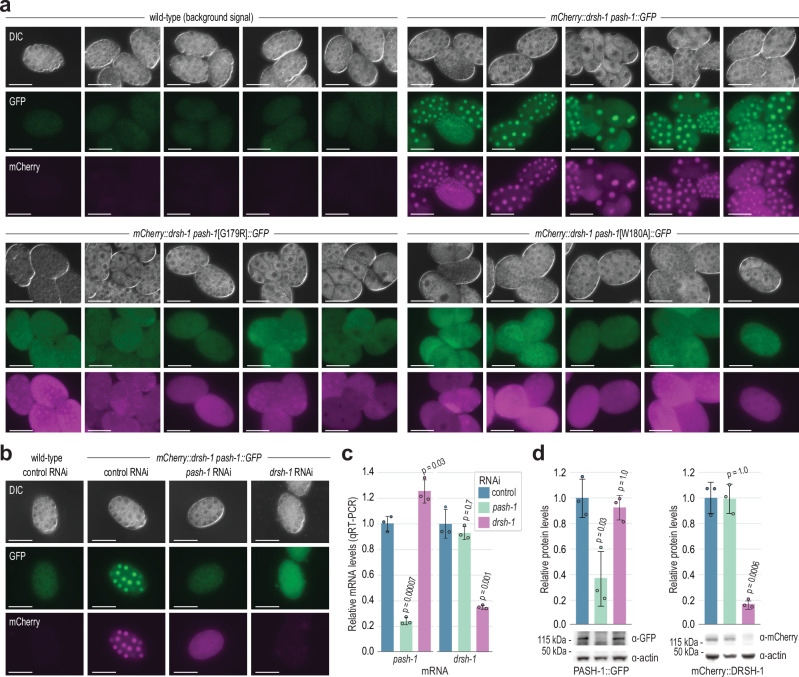
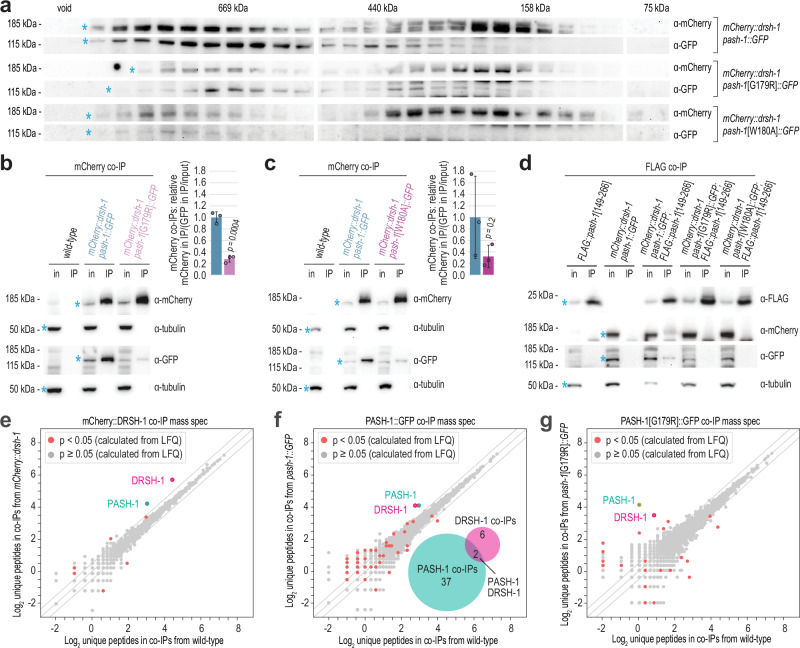
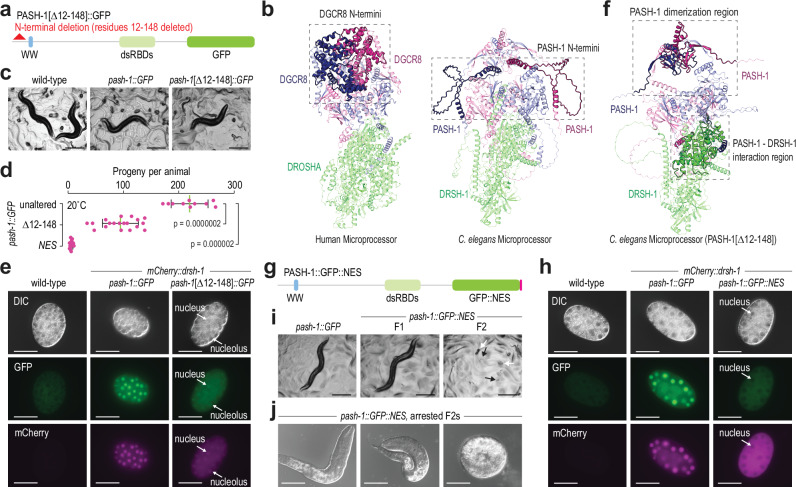
Primary microRNA (pri-miRNA) transcripts are processed by the Microprocessor, containing the ribonuclease Drosha and its RNA-binding partner DGCR8/Pasha. In a forward genetic screen utilizing a fluorescence-based sensor that monitors pri-miRNA processing in live Caenorhabditis elegans, we identify a mutation in the conserved G179 residue adjacent to the namesake W180 of Pasha's WW domain that disrupts pri-miRNA processing. We show that both the G179 and W180 residues are required for Pasha dimerization and Microprocessor assembly. The WW domain also facilitates nuclear localization of Pasha, likely through its role in Microprocessor assembly, which in turn promotes nuclear enrichment of Drosha. Furthermore, depletion of Pasha mislocalizes Drosha to the cytoplasm, and vice versa, while deletion of Pasha's N-terminus causes both proteins to accumulate in nucleoli. Our results reveal a mutual dependency between Pasha and Drosha for their localization in C. elegans and highlight the role of Pasha's WW domain in maintaining Microprocessor integrity.


Conflict of interest statement

Competing interests: The authors declare no competing interests.

Figures

Fig. 1
Fig. 1. A sensor for pri-miRNA recognition and processing in C. elegans.
a pri-miR-58 sensor design. (i) In the presence of a functional pri-miRNA biogenesis pathway, the miR-58 hairpin is cleaved from the mCherry mRNA by the Microprocessor leading to the degradation of mCherry. (ii) If the sensor is not recognized and processed, mCherry is expressed. Created in BioRender. Montgomery, T. (2025) https://BioRender.com/e89g547. b mCherry fluorescence in animals containing the pri-miR-58 sensor or a control construct lacking pri-miR-58 sequence (mCherry control). Animals were treated with either control (empty L4440 vector) or pash-1 RNAi or were segregants for wild-type drsh-1 or the drsh-1 deletion allele drsh-1(ok369). Scale bars = 0.1 mm. At least three representative individuals were imaged for each condition. c Relative levels of mature miR-58 normalized to let-7 in the various strains indicated as determined by TaqMan qRT-PCR. Error bars are standard deviation (SD) from the mean. n = 3 biological replicates. Two-tailed, two-sample Student’s t-tests were used to calculate p-values for comparisons to wild-type. A Bonferroni correction for three comparisons was applied. Source data are provided as a Source Data file.
Fig. 2
Fig. 2. Requirement for PASH-1’s WW domain in pri-miRNA recognition or processing.
a Representative images of control and 38a mutants containing the pri-miR-58 sensor. Scale bars = 0.1 mm. At least ten embryos per condition were imaged. b Quantification of mCherry levels in non-mutant control and 38a mutants by Western blot. One of 3 representative blot images is shown (see Source Data file). Tubulin was used for normalization. Error bars are SD. n = 3 biological replicates. A two-tailed, two-sample Student’s t-test was used for statistical analysis. c Location of the 38a mutation on pash-1 DNA and protein. dsRBDs, double-stranded RNA-binding domains. d WW domain sequence alignment. e AlphaFold3-predicted structure of the C. elegans Microprocessor highlighting the WW domain (residues 174–207) and dimerization region (residues 148-266). Human X-ray diffraction-based structure of the DGCR8 WW domain (PDB: 3LE4) is shown for comparison. f, g Relative endogenous pri-miR-58 levels in wild-type and pash-1(ram33[G179R]) mutants grown at 20 °C or 25 °C as measured by TaqMan qRT-PCR and normalized to act-1 (f) or unnormalized (g). Error bars are SD. n = 4 biological replicates. Two-tailed, two-sample Student’s t-tests were used for statistical analysis. A Bonferroni correction for three comparisons was applied in (g). h, i Relative mature miR-58 levels in wild-type and pash-1(ram33[G179R]) mutants grown at 20 °C or 25 °C as measured by TaqMan qRT-PCR and normalized to 21UR-1 (h) or unnormalized (i). Error bars are SD. n = 4 biological replicates. Two-tailed, two-sample Student’s t-tests were used for statistical analysis. A Bonferroni correction for three comparisons was applied in (i). j Numbers of progeny produced by animals grown at 20 °C. Error bars are SD. n = 10 (wild-type) or 11 (pash-1(ram33[G179R]) and pash-1(syb4327[W180A])) individuals. Two-tailed Mann-Whitney U tests were used for statistical analysis. k, l Images of wild-type and pash-1(ram33[G179R]) (k) or pash-1(syb4327[W180A]) (l) animals grown at 20 °C or 25 °C as indicated. Bar plots show percentages of animals with the indicated phenotypes (n = 100 animals per strain). Images approximate phenotypes scored. Two (k) or 1 (l) independent experiments were done. Scale bar = 0.3 mm. Source data are provided as a Source Data file.
Fig. 3
Fig. 3. Widespread reduction in canonical miRNA levels in pash-1(ram33[G179R]) mutants.
a, b Log2 average geometric-mean normalized sRNA-seq read counts in wild-type (x-axis) and pash-1(ram33[G179R]) (y-axis) animals grown at 20 °C (a) or 25 °C (b). Small RNA features are represented by data points colored by their classification. Diagonal lines show 0-, 2-, and -2-fold enrichments. The Wald test was used for statistical analysis. The inset bar plots show the numbers of miRNAs represented by >20 geometric mean-normalized reads significantly down or upregulated (p < 0.05) or unchanged (p ≥ 0.05) in pash-1(ram33[G179R]) relative to wild-type (no fold-change cutoff was applied). n = 3 (a) or 4 (b) biological replicates per strain. c Classification of miRNAs upregulated (p < 0.05) in pash-1(ram33[G179R]) relative to wild-type animals grown at either 20 °C or 25 °C, as indicated, based on data in (a) and (b). d Secondary structure predictions of miR-1829 family miRNA hairpins. Nucleotide sequences are shown for the miRNA duplex regions. The cleavage sites are indicated with scissors. e Mean reads per million (rpm)-normalized sRNA-seq counts for iso-miRs (offset by ±1–3 nt relative to miRNA 5’ end) and small RNAs derived from pre-miRNAs (pre-miRNA derived reads offset at their 5’ ends by >3 nt relative to mature miRNA 5’ end) in wild-type and pash-1(ram33[G179R]) mutants grown at 20 °C or 25 °C. Data as in (a) and (b). Error bars are SD. n = 3 (20 °C) or 4 (25 °C) biological replicates per strain. Two-tailed, two-sample Student’s t-tests were used to calculate p-values for comparisons to wild-type. A Bonferroni correction for two comparisons was applied to each. Source data are provided as a Source Data file.
Fig. 4
Fig. 4. PASH-1 WW domain-mutant proteins mislocalize to the cytoplasm.
a PASH-1::GFP expression in the adult germline and embryos (in utero). A wild-type animal is shown to highlight the non-specific background signal observed in germline tissue. The scale bars are 0.03 or 0.01 mm as indicated. At least three representative individuals for each strain were imaged. Imaging was repeated in three independent experiments with at least 10 individuals in total for each strain imaged. b mCherry::DRSH-1 expression in the adult germline. A wild-type animal is shown to highlight the lack of non-specific background signal observed in germline tissue. The scale bars are 0.03 or 0.01 mm as indicated. At least three representative individuals for each strain were imaged. c PASH-1::GFP and mCherry::DRSH-1 expression in 2-cell through 3-fold stage embryos. Strains lacking either PASH-1::GFP or mCherry::DRSH-1 are shown as controls for background fluorescence. The scale bars are 0.03 mm. At least three representative embryos for each stage were imaged. d PASH-1::GFP and mCherry::DRSH-1 expression in oocytes and 2, 4, and 16-cell embryos. A PASH-1::GFP embryo lacking mCherry::DRSH-1 is shown to highlight the lack of non-specific background signal observed for mCherry::DRSH-1 in embryos. Note both nuclear and cytoplasmic signal. The scale bars are 0.03 mm. At least two representative embryos or germlines were imaged for each strain. Imaging was repeated three times with at least 10 individuals for each strain in total imaged. e Relative mCherry fluorescence signal in the nucleus or cytoplasm of the embryos in (d). n = 2 (oocytes, 2-cell, and 16-cell) or 4 (4-cell) biological replicates. f, g PASH-1::GFP and PASH-1[G179R]::GFP (f) or PASH-1[W180A]::GFP (g) expression in the adult germline and embryos. Wild-type germlines and embryos are shown to highlight the non-specific background signal. The scale bars are 0.03 mm. At least fourteen representative embryos or germlines for each strain were imaged. Source data are provided as a Source Data file.
Fig. 5
Fig. 5. PASH-1 and DRSH-1 promote each other’s nuclear localization.
a PASH-1::GFP, PASH-1[G179R]::GFP, PASH-1[W180A]::GFP, and mCherry::DRSH-1 expression in embryos. Wild-type embryos show the non-specific background signal. The scale bars are 0.03 mm. At least twenty embryos were imaged for each strain. b PASH-1::GFP and mCherry::DRSH-1 expression in embryos following control (L4440), pash-1, and drsh-1 RNAi. Wild-type embryos show the non-specific background signal. The scale bars are 0.03 mm. In the experiment shown, >100 animals for each condition were monitored, and 1 representative embryo was imaged. The experiment was repeated three times, with a total of at least 23 embryos imaged for each condition. c Relative pash-1 and drsh-1 mRNA levels following control (L4440), pash-1, and drsh-1 RNAi as determined by qRT-PCR. rpl-32 mRNA levels were used for normalization. Error bars are SD. n = 3 biological replicates. Two-tailed, two-sample Student’s t-tests were used to calculate p-values for comparisons to control RNAi. A Bonferroni correction for two comparisons was applied. d Relative PASH-1::GFP and mCherry::DRSH-1 protein levels after pash-1 or drsh-1 RNAi. Actin was used for normalization. Error bars are SD. One of 3 representative blot images is shown (see Source Data file). n = 3 biological replicates. Two-tailed, two-sample Student’s t-tests were used to calculate p-values for comparisons to control RNAi. A Bonferroni correction for two comparisons was applied. Bars are colored as in (c). Source data are provided as a Source Data file.
Fig. 6
Fig. 6. Impaired Microprocessor assembly in PASH-1 WW domain mutants.
a Western blot analysis of wild-type and mutant PASH-1::GFP and wild-type mCherry::DRSH-1 from protein fractions captured with size exclusion chromatography. Masses are approximated based on size markers. The void fractions were determined based on protein elution volumes and confirmed with high molecular weight standards not run in parallel. Asterisks mark expected bands. b, c Western blot analysis of PASH-1::GFP and PASH-1[G179R]::GFP (b) or PASH-1[W180A]::GFP (c) co-IP’d with mCherry::DRSH-1. in, cell lysate input fraction; IP, co-IP fraction. Tubulin is shown as a loading control. Asterisks mark expected bands. The bar plots show the mean ratio of mCherry levels in IP fractions relative to GFP levels in IP fractions normalized to GFP levels in input fractions. Blue bar: mCherry::drsh-1; pash-1::GFP. Red bar: mCherry::drsh-1; pash-1[G179R]::GFP. Values are relative to the mCherry::drsh-1 pash-1::GFP control. Two-tailed, two-sample Student’s t-tests were used to calculate the p-values. Error bars are SD. n = 3 biological replicates. Samples derived from the same experiment and blots were processed in parallel. Blot images for one of 3 replicates are shown (Supplementary Fig. 6a–d). d Western blot analysis of PASH-1::GFP, PASH-1[G179R]::GFP, PASH-1[W180A]::GFP and mCherry::DRSH-1 co-IP’d with FLAG::PASH-1[149-266]. Tubulin is shown as a loading control. Asterisks mark expected bands. Blot images for one of 4 biological replicates from 2 independent experiments are shown (Supplementary Fig. 6e–f). eg Mass spectrometry analysis of mCherry::DRSH-1 (e), PASH-1::GFP (f), and PASH-1[G179R]::GFP (g) complexes from protein co-IPs. Scatter plots display the average log2 unique peptide counts in co-IPs from wild-type and the indicated transgenic strains. n = 4 biological replicates for each strain. Diagonal lines show 0-, 2-, and -2-fold enrichments. p-values were calculated based on label free quantification (LFQ) using a modified t-statistic (see Methods). The inset Venn diagram in (f) shows the overlap between mCherry::DRSH-1 and PASH-1::GFP interactors (p < 0.05). Source data are provided as a Source Data file.
Fig. 7
Fig. 7. Nuclear localization of the Microprocessor is required for development.
a Diagram of the N-terminal PASH-1[Δ12-148]::GFP deletion protein with the WW domain (WW), double-stranded RNA-binding domains (dsRBDs), and GFP indicated. b AlphaFold3-predicted structures of the Microprocessor from humans (with only DROSHA and DGCR8) and C. elegans. The N-termini of human DGCR8 (residues 1-275) and C. elegans PASH-1 (residues 12-148) are highlighted. c Representative images of wild-type, mCherry::drsh-1 pash-1::GFP, and mCherry::drsh-1 pash-1[Δ12-148]::GFP animals. 1–2 gravid adults, larvae, and eggs are visible. The scale bars are 0.3 mm. At least four representative adults for each strain were imaged. d Numbers of progeny produced by pash-1::GFP (unaltered), pash-1[Δ12-148]::GFP (Δ12-148), and pash-1::GFP::NES (NES) animals grown at 20 °C. Error bars are SD. n = 10 (unaltered), 19 (Δ12-148), or 14 (NES) animals. p-values were calculated using two-tailed Mann-Whitney U tests. e PASH-1::GFP, PASH-1[Δ12-148]::GFP, and mCherry::DRSH-1 expression in embryos. A wild-type embryo is shown as a control. The scale bars are 0.03 mm. At least 6 representative embryos for each strain were imaged. f AlphaFold3-predicted structure of the C. elegans Microprocessor containing PASH-1[Δ12-148]. PASH-1’s dimerization region (residues 148-266) and the PASH-1-DRSH-1 interacting region (PASH-1 helix [residues 497-513], DRSH-1 RIIIDa [residues 683-803], and DRSH-1 RIIIDb [residues 830-981]) are highlighted. g Diagram of the PASH-1::GFP protein fused to a nuclear export signal (NES, pink) with the WW domain (WW), dsRBDs, and GFP indicated. h PASH-1::GFP, PASH-1::GFP::NES, and mCherry::DRSH-1 expression in embryos. A wild-type embryo lacking GFP is shown as a control. The scale bars are 0.03 mm. At least six representative embryos for each strain were imaged. i Representative images of pash-1::GFP (control) and pash-1::GFP::NES animals. F1 animals are first-generation segregates from a heterozygous parent. F2 are descended from a homozygous parent. White arrows point to arrested embryos, and black arrows point to arrested larvae. The scale bars are 0.3 mm. At least 2 representative individuals for each strain were imaged. j Arrested pash-1::GFP::NES larvae and embryos. The scale bars are 0.03 mm. Three representative individuals were imaged. Source data are provided as a Source Data file.

Similar articles

References

    1. Bartel, D. P. Metazoan MicroRNAs. Cell173, 20–51 (2018). - PMC - PubMed
    1. Ha, M. & Kim, V. N. Regulation of microRNA biogenesis. Nat. Rev. Mol. Cell Biol. 15, 509–524 (2014). - PubMed
    1. Lee, Y. et al. The nuclear RNase III Drosha initiates microRNA processing. Nature425, 415–419 (2003). - PubMed
    1. Gregory, R. I. et al. The Microprocessor complex mediates the genesis of microRNAs. Nature432, 235–240 (2004). - PubMed
    1. Denli, A. M., Tops, B. B., Plasterk, R. H., Ketting, R. F. & Hannon, G. J. Processing of primary microRNAs by the microprocessor complex. Nature432, 231–235 (2004). - PubMed

MeSH terms

LinkOut - more resources