. 2025 Jul 1;16(1):5637.
doi: 10.1038/s41467-025-60782-6.

In-host evolution of Yersinia enterocolitica during a chronic human infection

Affiliations

In-host evolution of Yersinia enterocolitica during a chronic human infection

Cyril Savin et al. Nat Commun. .

Abstract

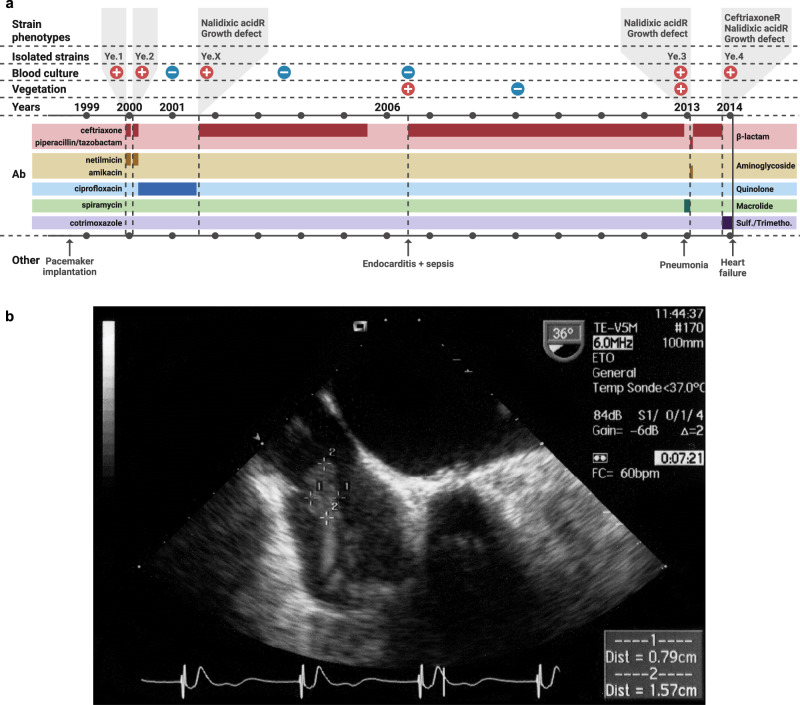
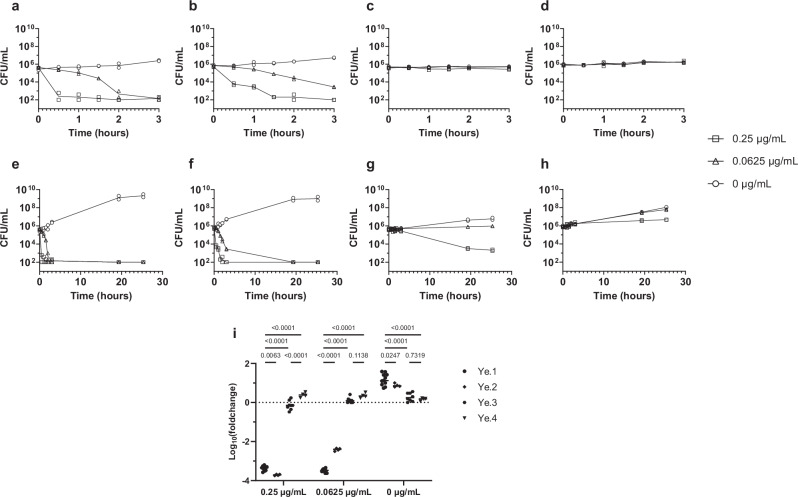
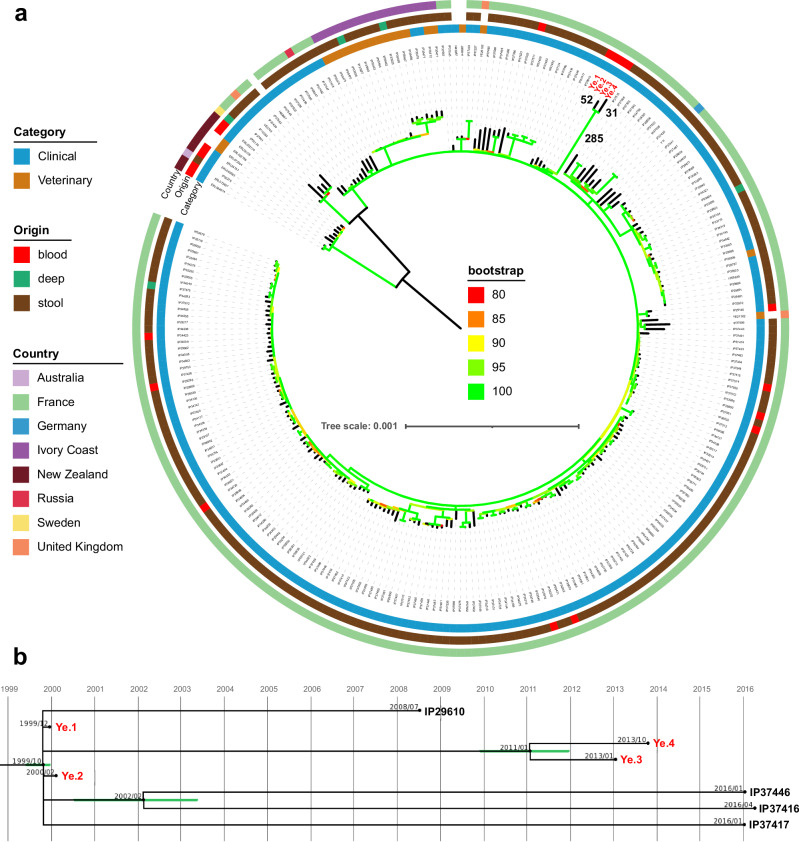
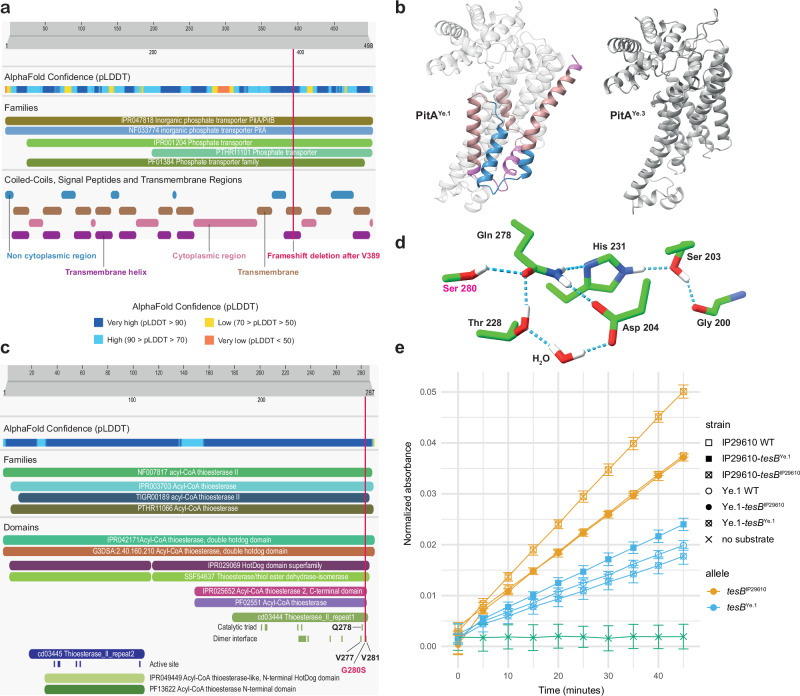
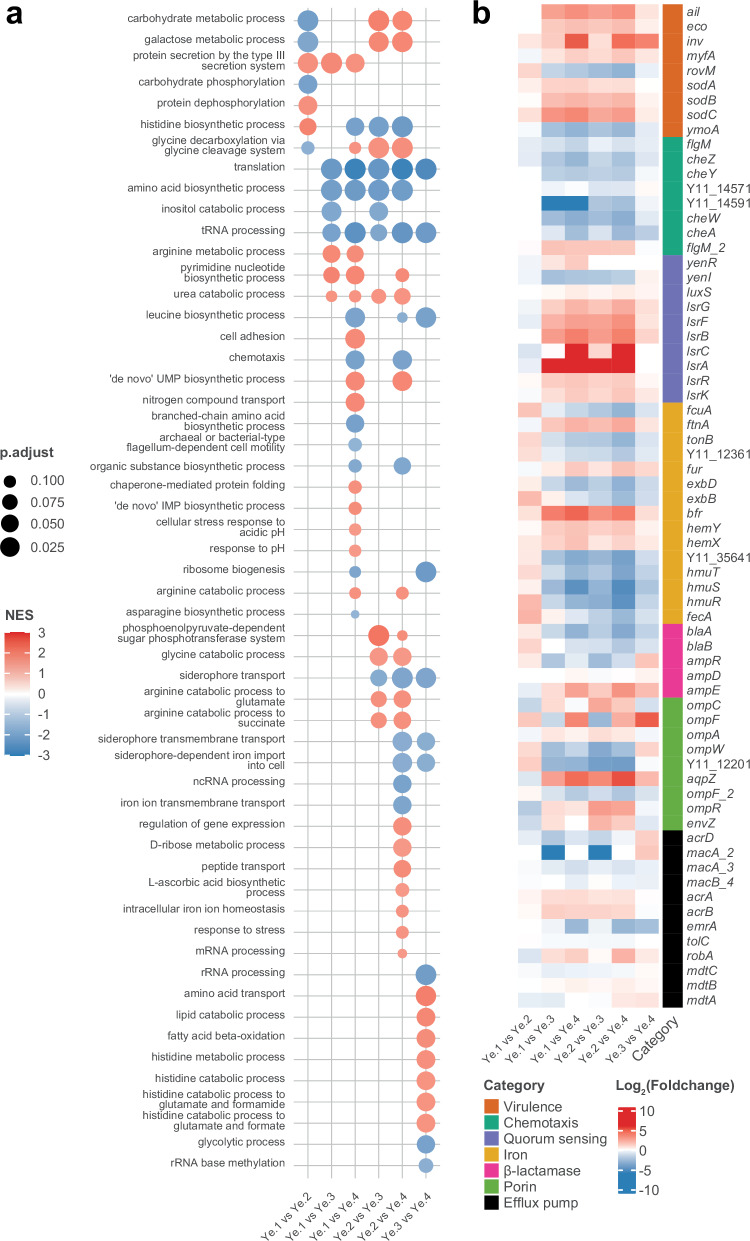
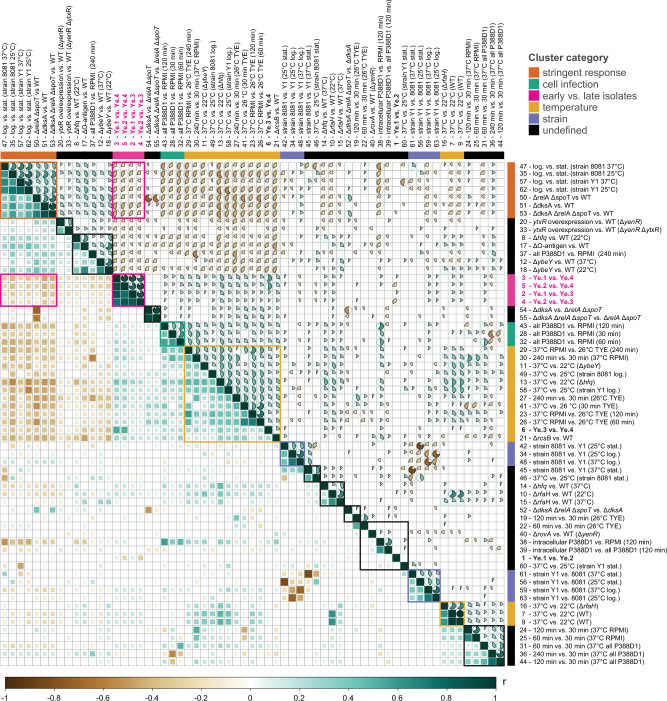
Bacteria exhibit remarkable adaptability in response to selective pressures encountered during infection and antibiotic treatment. We characterize four Yersinia enterocolitica clonal isolates from successive bacteremia episodes that evolved within an elderly patient over 14 years. Their common evolution is characterized by a genome size reduction resulting in the loss of about a hundred genes and a so far undescribed deletion in the DNA gyrase gene gyrA conferring quinolone resistance. Third-generation cephalosporin resistance of the last isolate correlates with a truncation of OmpF in synergy with an increased production of BlaA and AmpC β-lactamases. A strong proteome remodeling of the isolates reveals a perturbed stringent response, as well as impaired metabolism which substantiate their severe growth defects in vitro, accounting for antibiotics tolerance and possibly therapeutic failure. This study documents previously unreported genetic and phenotypic changes associated with in-host adaptation of a pathogenic Yersinia species under antibiotic pressure.


Conflict of interest statement

Competing interests: The authors declare no competing interests. Inclusion & Ethics Statement: All collaborators of this study have fulfilled the criteria for authorship required by Nature Portfolio journals. Roles and responsibilities were agreed among collaborators ahead of the research. This research was not severely restricted or prohibited in the setting of the researchers, and does not result in stigmatization, incrimination, discrimination, or personal risk to participants. The ethical committee of the University Hospital of Tours was informed about the study. The study is registered under the number 2025-032.

Figures

Fig. 1
Fig. 1. Clinical case description.
a Clinical case description of Ye chronic infection. Positive and negative symbols reflect the blood culture results, or the observation of vegetations on the pacemaker atrial lead. Periods of antibiotics treatment are shown in a darker color on the chronograph, with the associated treatment names on the left and antibiotic classes on the right. Ab: antibiotics. CeftriaxoneR: resistant to ceftriaxone. Nalidixic acidR: resistant to nalidixic acid. Sulf: sulfonamide. Trimetho: Trimethoprim. Created in BioRender. Lê-bury, P. (2025) https://BioRender.com/7nptf49b Vegetation on pacemaker lead. Transesophageal echocardiography performed July 27th, 2006, showing large vegetations on the pacemaker lead in the right atrium. Vegetations formed a sheath around the electrode, measuring 1.6 cm by 0.8 cm.
Fig. 2
Fig. 2. Ye survival curves during ciprofloxacin exposure.
Survival curve until: a–d 3 h; e–h 25 h for: a, e Ye.1; b, f Ye.2; c, g Ye.3; d, h Ye.4 exposed to various concentration of ciprofloxacin at 37 °C in LB. The individual values of n = 2 replicated wells are plotted and the line represents the geometric mean. The limit of detection is at 100 colony forming units (CFU)/mL. A duplicate experiment can be found in Supplementary Fig. 2. i Survival of the four isolates after 3 h of incubation. Plotted are log10(foldchange) of CFUs at 3 h compared to inoculum. Data comes from n = 11 replicated wells from 4 independent experiments (Ye.1), n = 4 replicated wells from 2 independent experiments (Ye.2), n = 8 replicated wells from 3 independent experiments (Ye.3), and n = 4 replicated wells from 2 independent experiments (Ye.4). Statistics are computed by two-way ANOVA with Tukey multiple comparisons test (non-directional) on the log10(foldchange) and only selected p value are plotted for clarity. Source data are provided as a Source Data file.
Fig. 3
Fig. 3. Phylogenetic reconstruction.
a Maximum likelihood phylogeny reconstructed with IQ-TREE2 under TIMEe+ASC model as defined by “ModelFinder” with 100 bootstraps based on 4,738 SNPs identified in 262 strains. The genome of the Y11 strain (NC_017564) was used as reference for variant calling. Numbers close to the branches indicate SNPs numbers. The tree was rooted at midpoint. Branches are colored according to bootstrap values. Metadata (category, origin, and country) are plotted on 3 colored outer rings. b Estimation of the date of internal nodes using least-squares dating (https://lsdating.pasteur.fr) among the 4 strains isolated from the patient. Green bars represent the standard deviation of the estimated date.
Fig. 4
Fig. 4. Structure and phenotypical analysis of PitA and TesB mutation.
a, c Domain analysis of Y11 PitA and TesB proteins respectively, as found on InterPro on 2025.02.12. Mutation position is shown by a vertical magenta line and residues from the catalytic triad or dimer interface close to the TesB mutation are annotated. Domains are annotated with entry numbers for InterPro (IPR), NCBIfam (NF or TIGR), PANTHER (PTHR) Pfam (PF), CATH-Gene3D (G3DSA), SUPERFAMILY (SSF) or CDD (cd). Non cytoplasmic, cytoplasmic and transmembrane regions are annotated via Phobius and Transmembrane Helix are annotated via TMHMM. AlphaFold confidence (pLDDT) is colored from very low confidence (orange) to very high confidence (dark blue). b AlphaFold prediction structure for PitAYe.1 (left) and PitAYe.3 (right). Truncated residues are displayed with the same color code as the regions in panel (a). d Structure of the TesB active site of E. coli with a G280S mutation, annotated in magenta, showing an additional interfering hydrogen bond from the serine side chain. Carbon atoms are shown in green, oxygen atoms in red, nitrogen atoms in blue and hydrogen atoms in white. e Thioesterase II activity of IP29610 and Ye.1 mutant harboring different tesB alleles (IP29610 allele in orange and Ye.1 allele in blue), measured by the CoA release from decanoyl-CoA. Each point shows the mean and standard deviation of n = 3 replicated wells in one experiment. The green curve represents the negative control without substrate. Source data are provided as a Source Data file.
Fig. 5
Fig. 5. Ye proteomic analysis.
a Gene set enrichment analysis (GSEA) of biological process gene ontology terms across pairwise comparisons of Ye proteomes. Positive normalized enrichment scores (NES) calculated by GSEA algorithm are shown in red and correspond to enriched terms in the first isolate in the comparison, while negative NES are shown in blue and correspond to enriched term in the second isolate in the comparison. The nominal p-value is calculated according to GSEA algorithm. Multiple testing is adjusted by the Benjamini-Hochberg procedure (p.adjust). b Heatmap for all pairwise comparisons of protein differential abundance between the 4 clinical isolates, with the corresponding genes displayed on the right. Proteins are grouped in categories with different colors based on Y11 RefSeq and Uniprot annotations, and bibliography. Log2(foldchange) shown in red corresponds to a protein more abundant in the first isolate in the comparison, while log2(foldchange) shown in blue corresponds to a protein more abundant in the second isolate in the comparison. In each category, proteins are ordered by Y11 locus order. Source data are provided as a Source Data file.
Fig. 6
Fig. 6. Heatmap of omics comparison correlations.
Spearman correlation of 63 Ye omic experiment comparisons, clustered by hierarchical clustering and showing 15 clusters (squares). Color code of manually annotated clusters is shown on the top and right of the heatmap, and cluster squares are colored accordingly. Ye.1-Ye.4 isolate proteome comparisons are in bold, with early versus late isolate comparisons colored in magenta and their correlations with the stringent response cluster highlighted by two magenta rectangles. Upper part of the heatmap is a pie representation (the correlation coefficient is represented by color and filling of the pie) and lower part is a square representation (the correlation coefficient is represented by color and size of the square). Only correlation coefficient with a p-value < 0.001 are shown. Coefficient (r) color scale is shown at the bottom. log.: logarithmic phase. stat.: stationary phase. vs.: versus. Source data are provided as a Source Data file.

Similar articles

References

    1. Didelot, X., Walker, A. S., Peto, T. E., Crook, D. W. & Wilson, D. J. Within-host evolution of bacterial pathogens. Nat. Rev. Microbiol14, 150–162 (2016). - PMC - PubMed
    1. Grote, A. & Earl, A. M. Within-host evolution of bacterial pathogens during persistent infection of humans. Curr. Opin. Microbiol70, 102197 (2022). - PMC - PubMed
    1. Dekker, J. P. Within-host evolution of bacterial pathogens in acute and chronic infection. Annu Rev. Pathol.19, 203–226 (2024). - PubMed
    1. Shepherd, M. J. et al. Ecological and evolutionary mechanisms driving within-patient emergence of antimicrobial resistance. Nat. Rev. Microbiol22, 650–665 (2024). - PubMed
    1. Levin-Reisman, I. et al. Antibiotic tolerance facilitates the evolution of resistance. Science355, 826–830 (2017). - PubMed

MeSH terms

LinkOut - more resources