. 2025 Jul 1;16(1):5877.
doi: 10.1038/s41467-025-60908-w.

Biohybrid-based pyroelectric bio-denitrification driven by temperature fluctuations

Affiliations

Biohybrid-based pyroelectric bio-denitrification driven by temperature fluctuations

Jie Ye et al. Nat Commun. .

Abstract

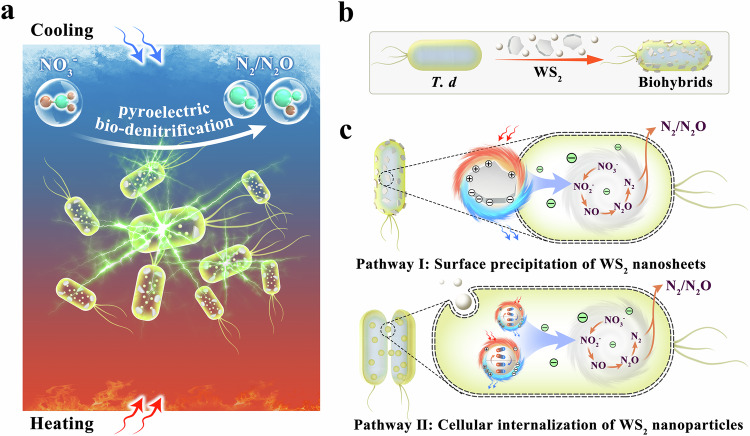
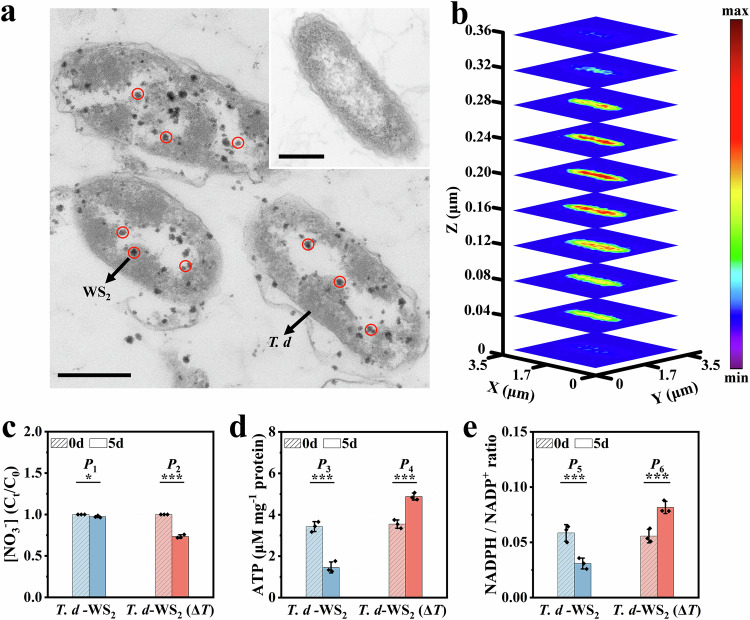
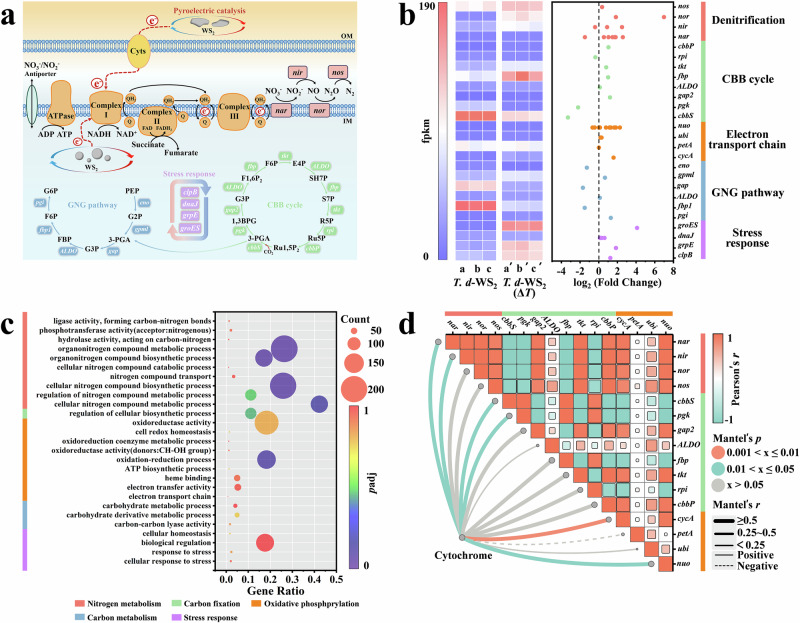
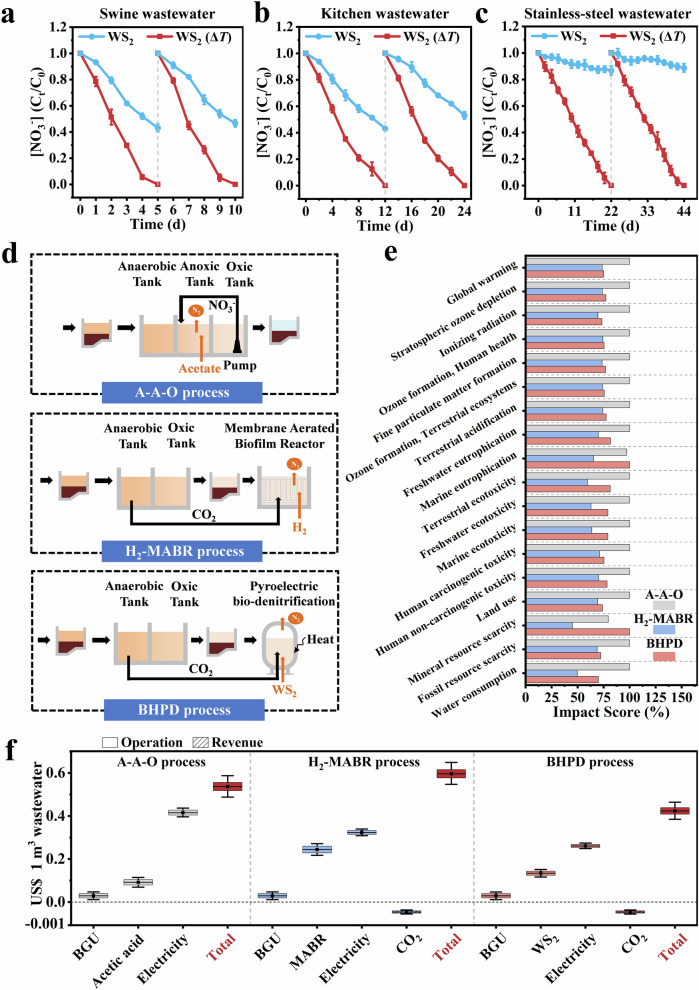
Bio-denitrification is vital in wastewater treatment plants (WWTPs), yet its integration with naturally abundant thermal energy remains unexplored. Here, we introduce a biohybrid-based pyroelectric bio-denitrification (BHPD) process that harnesses thermoelectric energy from ambient temperature fluctuations. By integrating Thiobacillus denitrificans with tungsten disulfide (WS2), we develop a biohybrid system that achieves complete denitrification over three 5-day cycles under 5 °C temperature fluctuations. WS2 either precipitates on the cellular surface or is internalized by cells, generating pyroelectric charges that serve as reducing equivalents to drive bio-denitrification. In real wastewater, the BHPD process enhances nitrate removal by up to 8.09-fold under natural temperature fluctuations compared to stable-temperature conditions. Life-cycle assessment demonstrates that the BHPD process has significantly lower environmental impacts than the conventional anaerobic-anoxic-oxic process, and cost analysis confirms its economic feasibility. Our findings highlight the potential of the pyroelectric effect in enhancing bio-denitrification, offering valuable insights for a paradigm shift in WWTPs.


Conflict of interest statement

Competing interests: The authors declare no competing interests.

Figures

Fig. 1
Fig. 1. Schematic diagram of T. d-WS2 biohybrids.
a Depiction of T. d-WS2, proceeding pyroelectric bio-denitrification via temperature fluctuations during heating-cooling cycle. b Construction of T. d-WS2 biohybrids. c Proposed pathways for pyroelectric bio-denitrification by T. d-WS2. The electrons generated from both intracellular and extracellular WS2 under temperature variation were utilized by T. d for NO3 reduction to N2/N2O.
Fig. 2
Fig. 2. Pyroelectric bio-denitrification performance with T. d-WS2.
a Schematic illustration for the pyroelectric bio-denitrification process by T. d-WS2 via heating-cooling cycling (3/30 min). b NO3 reduction by T. d-WS2 and deletional controls. c Typical time course of NO3 reduction by T. d-WS2 over three successive 5-day cycles. d Labeled 15N-KNO3 reduction by T. d-WS2. Signal intensity is presented in arbitrary units (arb. units). e, f ToF-SIMS imaging of 15N (e) and 13C (f) in T. d-WS2 (the inset images show T. d-WS2 without temperature variation); representative of 10 images. g Variation of the cell biomass in T. d-WS2 over three successive 5-day cycles. h CLSM images of T. d-WS2 (Red and green colors represent the dead and live cells, respectively); representative of 10 images. Data are presented as mean values ± SD derived from n = 3 independent experiments. Scale bars: 50 μm in (e, f) 50 μm in the insert images, and 20 μm in (h). Source data are provided as a Source Data file.
Fig. 3
Fig. 3. Characterization of the structural and pyroelectric properties of T. d-WS2.
a SEM image of T. d-WS2 (the inset image shows bare T. d); representative of 10 images. b, c Temperature (b) and potential (c) distribution in WS2 via finite element analysis with COMSOL. d SECM topographic images of WS2; representative of 10 images. e I-t curves under a heating/cooling cycle (30/30 s). f Correlation analysis of pyro-current intensity with temperature variation rate and WS2 dosage. Data are presented as mean values ± SD derived from n = 3 independent experiments. Statistical analysis was conducted with paired two-tailed t test. Scale bars: 2 μm in a, and 1 μm in the insert image. Source data are provided as a Source Data file.
Fig. 4
Fig. 4. Cellular uptake of the WS2 by T. d and its catalytic denitrification performance.
a Representative TEM images of cross-section slices of the WS2-fed cells, where the dark clusters in the solid-line circles are assigned to the accumulated WS2 nanoparticles (the inset image shows bare T. d)); representative of 10 images. b Stacked confocal images of T. d cells at different heights Z show the distribution of WS2 throughout the cell; representative of 10 images. ce Variation of NO3 reduction rate (P1 = 0.0269, P2 = 3.5738 × 10−9) (c), ATP concentration (P3 = 4.7999 × 10−6, P4 = 8.6249 × 10−5) (d), and NADPH/NADP+ ratio (P5 = 0.0005, P6 = 0.0008) (e) in T. d-WS2. Data are presented as mean values ± SD derived from n = 3 independent experiments. Statistical analysis was conducted with paired two-tailed t test: *P ≤ 0.05, **P ≤ 0.01, ***P ≤ 0.001. Scale bars: 300 nm in (a), and 300 nm in the insert images. Source data are provided as a Source Data file.
Fig. 5
Fig. 5. Transcriptomic analyses.
a Schematic illustration for the metabolic response circuits of T. d for selective energy transfer under temperature fluctuations. The purple section represents the stress response process, the pink section represents denitrification process, the orange section represents electron transport chain (ETC), the green section represents Calvin-Benson-Bassham (CBB) cycle, and the blue section represents gluconeogenesis (GNG) pathway. The full names of the genes and products involved in the corresponding processes can be found in Supplementary Data 1. OM and IM denote the outer and inner membranes, respectively. b Heat maps for the expression levels of key genes with T. d-WS2 under temperature fluctuations and control (n = 3), and the log2 (Fold Change) values of genes with T. d-WS2 under temperature fluctuations. c Gene Ontology (GO) functional enrichment analysis of the key processes with T. d-WS2 during pyroelectric bio-denitrification. The size of the dots indicates the amount of the functionally enriched genes, and the color of the dots indicates the significance of the enriched genes. Statistical analysis was conducted with paired two-tailed t test and DESeq2 (1.20.0), with P-values adjusted using the Benjamini-Hochberg method. d Correlation analysis of gene expression by Pearson method and correlation analysis of cytochrome with other key genes by Mantel test analysis. The line color represents the value of the Mantel’s p, and the line thickness represents the value of Mantel’s r. Source data are provided as a Source Data file.
Fig. 6
Fig. 6. Potential of pyroelectric bio-denitrification for actual wastewater treatment.
ac Typical time course of NO3 reduction in swine wastewater (a), kitchen wastewater (b), and stainless-steel wastewater (c) over two successive cycles. d Schematic diagram of the A-A-O, H2-MABR, and BHPD processes. e, f Impact scores of all environmentally relevant descriptors, as assessed through the LCA (e), and economic cost (f) of these three routes with a membrane life of 15 years in H2-MABR process. Data are presented as box-and-whisker plots derived from 10,000 Monte Carlo simulation trials. In each plot, the central line within the box represents the median, while individual data points indicate the mean. The upper and lower edges of the box correspond to the 90th and 10th percentiles, respectively, and the whiskers indicate the minimum and maximum values. Source data are provided as a Source Data file.

Similar articles

References

    1. Ward, B. et al. Denitrification as the dominant nitrogen loss process in the Arabian sea. Nature461, 78–81 (2009). - PubMed
    1. Qu, J. et al. Emerging trends and prospects for municipal wastewater management in China. ACS Est. Eng.2, 323–336 (2022).
    1. Lu, L. et al. Wastewater treatment for carbon capture and utilization. Nat. Sustain.1, 750–758 (2018).
    1. Bian, J. et al. Synergy of cyano groups and cobalt single atoms in graphitic carbon nitride for enhanced bio-denitrification. Water Res.218, 118465 (2022). - PubMed
    1. Ye, J. et al. Wastewater denitrification driven by mechanical energy through cellular piezo-sensitization. Nat. Water2, 531–540 (2024).

LinkOut - more resources