. 2025 Jul 1;16(1):5496.
doi: 10.1038/s41467-025-60723-3.

Mammalian tRNA acetylation determines translation efficiency and tRNA quality control

Affiliations

Mammalian tRNA acetylation determines translation efficiency and tRNA quality control

Na Liu et al. Nat Commun. .

Abstract

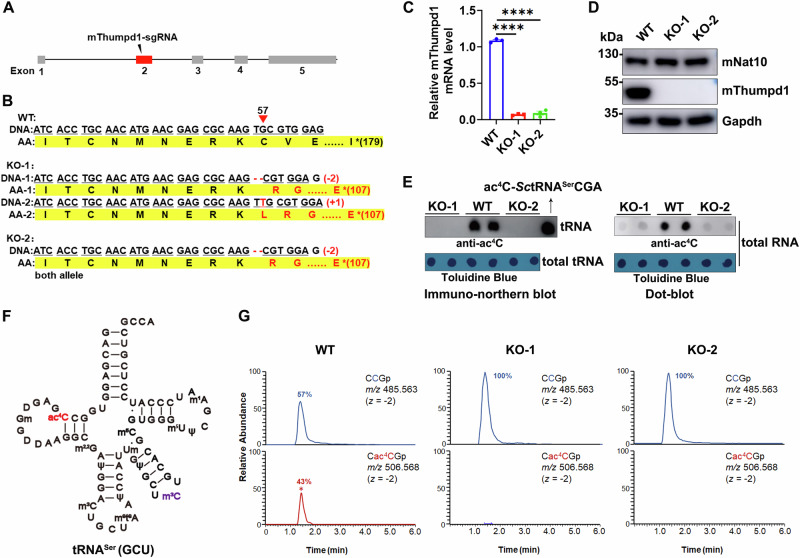
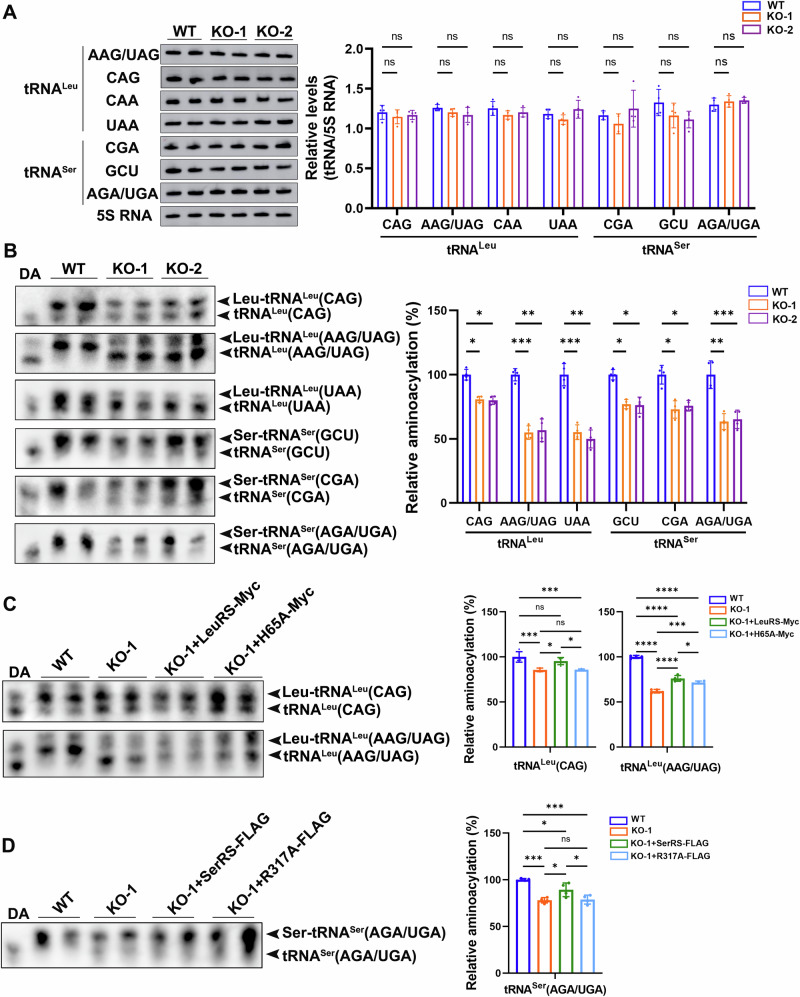
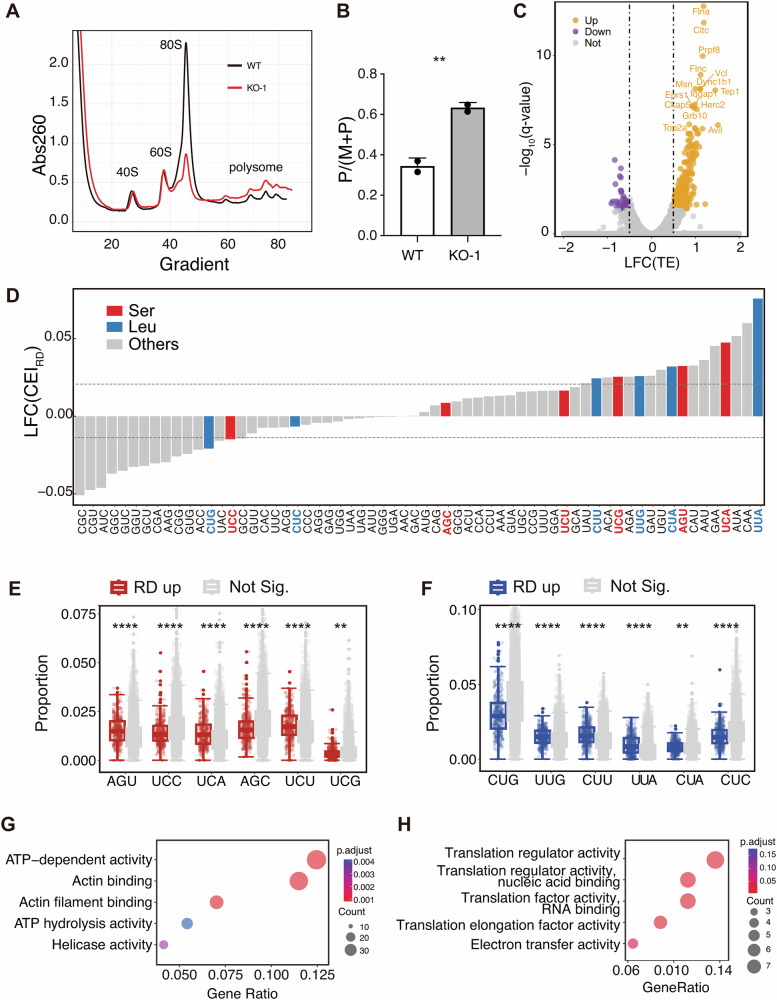
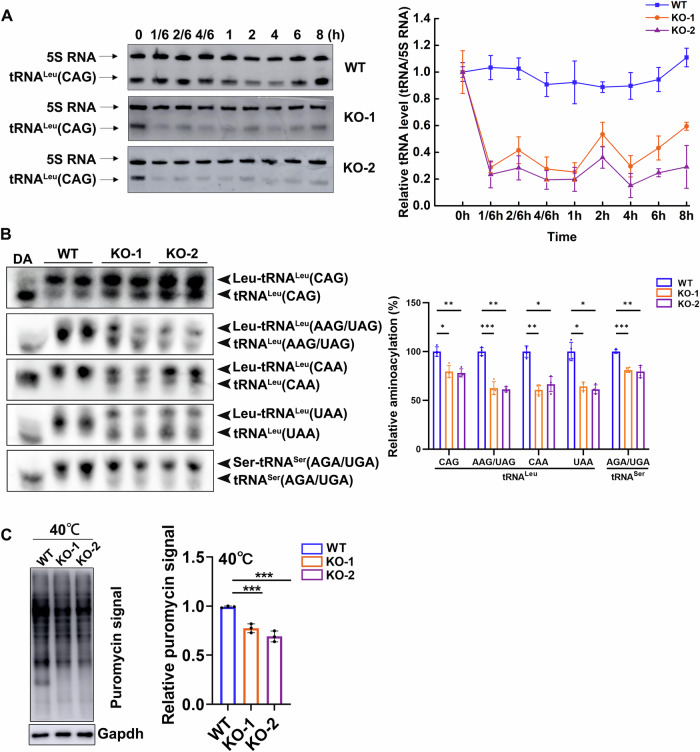
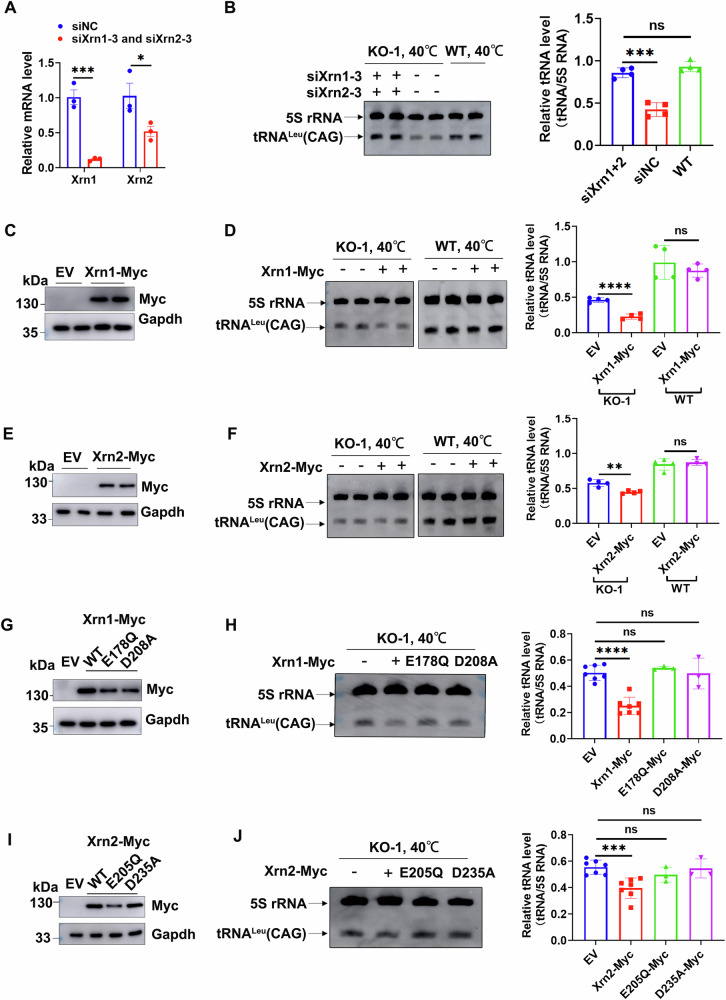
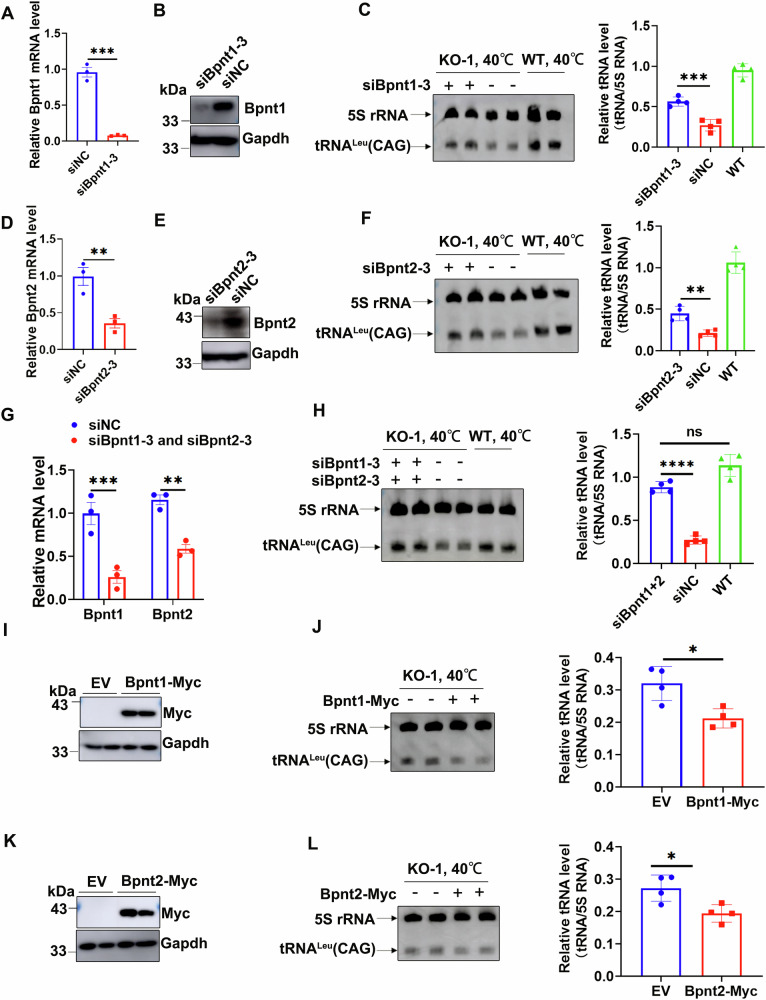
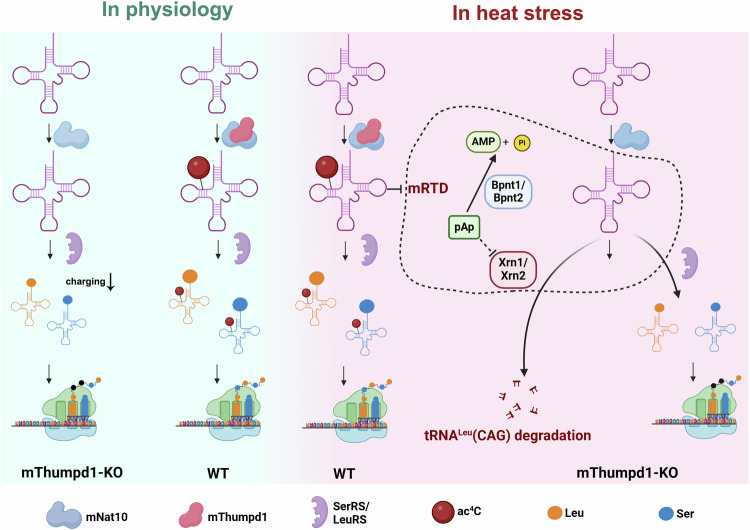
Acetylation is a conserved and pivotal RNA modification. Acetylation of tRNA occurs at C12 (ac4C12) in eukaryotic tRNAs. Yeast ac4C12 prevents tRNASer from rapid tRNA decay (RTD) at higher temperatures. However, the biological function of ac4C12 in higher eukaryotes remains unexplored. Moreover, whether mammalian cells contain an RTD pathway is unclear. Here, we deleted Thumpd1, the indispensable factor for ac4C12 biogenesis, in NIH/3T3 cells. Loss of ac4C12 significantly reduced tRNA aminoacylation and translational efficiency physiologically, in particular, of those enriched with Ser/Leu codons with two U/A nucleotides. Remarkably, ac4C12 hypomodification selectively generated rapid tRNALeu(CAG) turnover under heat stress. We demonstrated that tRNALeu(CAG) was degraded by a mammalian RTD (mRTD) mechanism, consisting of Xrn1/Xrn2-mediated 5'-3' exonuclease digestion and intracellular pAp level control by Bpnt1/Bpnt2. Our results reveal both the pivotal roles of ac4C12 in translation and a mRTD pathway for tRNA quality control under heat stress in mammalian cells.


Conflict of interest statement

Competing interests: The authors declare no competing interests.

Figures

Fig. 1
Fig. 1. Deletion of mThumpd1 leads to tRNA ac4C hypomodification.
A Scheme showing the target site of mThumpd1-sgRNA for mThumpd1 deletion by CRISPR/Cas9. B Genotypes of the KO-1 and KO-2 mThumpd1 knockout NIH/3T3 cell lines. RT-qPCR (C) and western blotting (D) analyses of wild-type (WT), KO-1, and KO-2 cell lines. n = 3, P values are based on the ordinary one-way ANOVA analysis. Error bars, mean ± SEM, ⋆⋆⋆⋆P  <  0.0001 (WT vs. KO-1); ⋆⋆⋆⋆P  < 0.0001 (WT vs. KO-2). E ac4C level in total tRNAs or total RNAs determined by immuno-northern blot (left) or dot blot (right), respectively (representative of three independent experiments). Sample loading was controlled by toluidine blue staining of total RNAs. Pre-formed yeast ac4C-tRNASer(CGA) was included as a marker for positioning the localization of tRNAs after gel separation in immuno-northern blot. F Secondary structure of rat tRNASer(GCU) with all modifications. ac4C12 and m3C47d were highlighted in red and purple, respectively. G Intensity fractions (%) of modified or unmodified 11CCG13 fragment in WT and two KO cell lines. Source data are provided as a Source Data file.
Fig. 2
Fig. 2. Hypomodification of ac4C decreases tRNA aminoacylation level under physiological conditions.
A Northern blotting analyses (left) and quantification (right) of steady-state abundance of tRNALeu and tRNASer isoacceptors in WT, KO-1, and KO-2 cell lines. n = 4, P values are based on the two-way ANOVA analysis. Error bars, mean ± SEM, tRNALeu(CAG): n.s. P  =  0.6993 (WT vs. KO-1), n.s. P  =  0.8357 (WT vs. KO-2); tRNALeu(AAG/UAG): n.s. P  =  0.2566 (WT vs. KO-1), n.s. P  =  0.1076 (WT vs. KO-2); tRNALeu(CAA): n.s. P  =  0.2382 (WT vs. KO-1), n.s. P  =  0.4858 (WT vs. KO-2); tRNALeu(UAA): n.s. P  =  0.273 (WT vs. KO-1), n.s. P  =  0.6953 (WT vs. KO-2); tRNASer(CGA): n.s. P   =  0.3492 (WT vs. KO-1), n.s. P  =  0.7573 (WT vs. KO-2); tRNASer(GCU): n.s. P  =  0.5482 (WT vs. KO-1), n.s. P  =  0.0588 (WT vs. KO-2); tRNASer(AGA/UGA): n.s. P  =  0.0851 (WT vs. KO-1), n.s. P  =  0.6076 (WT vs. KO-2). B Acidic northern blotting analyses (left) and quantification (right) of charging levels of tRNALeu and tRNASer isoacceptors in WT, KO-1, and KO-2 cell lines. DA, deacylated sample from WT cells. n = 4. P-values are based on the two-way ANOVA analysis. Error bars, mean ± SEM, tRNALeu(CAG): P  =  0.0159 (WT vs. KO-1), P  =  0.0174 (WT vs. KO-2); tRNALeu(AAG/UAG): ⋆⋆⋆P  =  0.0009 (WT vs. KO-1), ⋆⋆P  =  0.0023 (WT vs. KO-2); tRNALeu(UAA): ⋆⋆⋆P  =  0.0003 (WT vs. KO-1), ⋆⋆P  =  0.0018 (WT vs. KO-2); tRNASer(GCU): P  =  0.0108 (WT vs. KO-1), P  =  0.018 (WT vs. KO-2); tRNASer(CGA): P  =  0.0385 (WT vs. KO-1), P  =  0.0291 (WT vs. KO-2); tRNASer(AGA/UGA): ⋆⋆P  =  0.0039 (WT vs. KO-1), ⋆⋆⋆P  =  0.0008 (WT vs. KO-2). C Acidic northern blotting analyses (left) and quantification (right) of charging level of tRNALeu(CAG) and tRNALeu(AAG/UAG) in WT, KO-1, LeuRS-Myc, or LeuRS-H65A-Myc overexpressing KO-1 cells. n = 4. P-values are based on the ordinary one-way ANOVA analysis. Error bars, mean ± SEM, tRNALeu(CAG): ⋆⋆⋆P  =  0.0007 (WT vs. KO-1), n.s. P   = 0.3231 (WT vs. KO-1+LeuRS-Myc); ⋆⋆⋆P  =  0.0007 (WT vs. KO-1+LeuRS-H65A-Myc); P  =  0.0132 (KO-1 vs. KO-1+LeuRS-Myc); n.s. P   = 0.9999 (KO-1 vs. KO-1+LeuRS-H65A-Myc); P  =  0.015 (KO-1+LeuRS-Myc vs. KO-1+LeuRS-H65A-Myc). tRNALeu(AAG/UAG): ⋆⋆⋆⋆P  <  0.0001 (WT vs. KO-1), ⋆⋆⋆⋆P  <  0.0001 (WT vs. KO-1+LeuRS-Myc); ⋆⋆⋆⋆P  <  0.0001 (WT vs. KO-1+LeuRS-H65A-Myc); ⋆⋆⋆⋆P  <  0.0001 (KO-1 vs. KO-1+LeuRS-Myc); ⋆⋆⋆P  = 0.0002 (KO-1 vs. KO-1+LeuRS-H65A-Myc); P  = 0.0496 (KO-1+LeuRS-Myc vs. KO-1+LeuRS-H65A-Myc). D Acidic northern blotting analyses (left) and quantification (right) of charging level of tRNASer(AGA/UGA) in WT, KO-1, SerRS-FLAG, or SerRS-R317A-FLAG overexpressing KO-1 cells. n = 4. P-values are based on the ordinary one-way ANOVA analysis. Error bars, mean ± SEM, tRNASer(AGA/UGA): ⋆⋆⋆P  =  0.0001 (WT vs. KO-1), P  =  0.0304 (WT vs. KO-1+SerRS-FLAG); ⋆⋆⋆P  =  0.0002 (WT vs. KO-1+SerRS-R317A-FLAG); P  =  0.0236 (KO-1 vs. KO-1+SerRS-FLAG); n.s. P   = 0.9959 (KO-1 vs. KO-1+SerRS-R317A-FLAG); P  =  0.0349 (KO-1+SerRS-FLAG vs. KO-1+SerRS-R317A-FLAG). Source data are provided as a Source Data file.
Fig. 3
Fig. 3. Loss of ac4C modification impairs translation efficiency at Ser and Leu codons.
A Ribosome profiling showing the translation profile of WT NIH/3T3 (black line) and KO-1 (red line) cells. The curve represents the average of two biological replicates. B Abs260 ratio of the polysome to the sum of the polysome and monosome (∗∗P = 0.0096, n = 2, two-tailed Student’s t test). C Volcano plot of ribosome density (RD, ribosome occupancy normalized by mRNA expression) of WT and KO-1 cells. Orange dots represent differentially up-regulated genes defined as at least one fold change (LFC ≥ 0.5) and adjusted P < 0.05. Purple dots represent differentially down-regulated genes defined as at least one fold change (LFC ≤ –0.5) and adjusted P < 0.05. LFC denotes log2(fold change). Two biological replicates were examined for each type of library. D Fold-changes in CEIRD of KO-1 cells compared with WT NIH3T3 cells. Ser and Leu codons are colored red and blue, respectively. The dashed lines indicate the median of LFC(CEIRD). Proportion of Ser (E) and Leu (F) cognate codons in RD up-regulated (colored) and background genes (gray). Ser-AGU: ⋆⋆⋆⋆P = 6.4*10-15; Ser-UCC: ⋆⋆⋆⋆P = 5.4*10–9; Ser-UCA: ⋆⋆⋆⋆P = 2.2*10–12; Ser-AGC: ⋆⋆⋆⋆P = 6.0*10-8; Ser-UCU: ⋆⋆⋆⋆P = 1.7*10–12; Ser-UCG: ⋆⋆P = 0.0016; Leu-CUG: ⋆⋆⋆⋆P < 2*10–16; Leu-UUG: ⋆⋆⋆⋆P = 6.7*10–10; Leu-CUU; ⋆⋆⋆⋆P < 2*10–16; Leu-UUA: ⋆⋆⋆⋆P < 2*10–16; Leu-CUA; ⋆⋆P = 0.0023; Leu-CUC; ⋆⋆⋆⋆P = 2.7*10–13, Wilcoxon test, two sided. Molecular function enrichment analysis of RD up-regulated (G) and down-regulated (H) genes (|LFC | ≥ 0.5, and adjusted P < 0.05). The top five terms are shown. E, F Center line: median; box limits: upper and lower quartiles; whiskers:1.5X interquartile range; points: outliers. Source data are provided as a Source Data file.
Fig. 4
Fig. 4. Lack of ac4C leads to selective degradation of tRNALeu(CAG) during heat stress.
A Northern blotting analyses (left) and quantification (right) of abundance of tRNALeu(CAG) in WT, KO-1, and KO-2 cells under heat stress (40 °C) for various time intervals. 5S rRNA was detected in the same samples and gels for accurate quantification. n = 3. Error bars, mean ± SEM. BAcidic northern blotting analyses (left) and quantification (right) of charging levels of tRNALeu isoacceptors and tRNASer(AGA/UGA) in WT, KO-1, and KO-2 cells during heat shock (40 °C, 20 min). DA, deacylated samples from WT cells. n = 4. P-values are based on the two-way ANOVA analysis. Error bars, mean ± SEM, tRNALeu(CAG): P  =  0.0388 (WT vs. KO-1), ⋆⋆P  =  0.01 (WT vs. KO-2); tRNALeu(AAG/UAG): ⋆⋆⋆P  =  0.0004 (WT vs. KO-1), ⋆⋆P  =  0.0012 (WT vs. KO-2); tRNALeu(CAA): ⋆⋆P  =  0.0081 (WT vs. KO-1), P  =  0.0147 (WT vs. KO-2); tRNALeu(UAA): P  =  0.0188 (WT vs. KO-1), P  =  0.0175 (WT vs. KO-2); tRNASer(AGA/UGA): ⋆⋆⋆P  =  0.0004 (WT vs. KO-1), ⋆⋆P  =  0.0057 (WT vs. KO-2). C De novo protein synthesis measured by puromycin incorporation in WT, KO-1, and KO-2 cells during heat shock (40 °C, 20 min) (left). Puromycin-labeled proteins were detected by immunoblotting (right). n = 3. P values are based on the ordinary one-way ANOVA analysis. Error bars, mean ± SEM, ⋆⋆⋆P  =  0.0009 (WT vs. KO-1), ⋆⋆⋆P  =  0.0002 (WT vs. KO-2). Source data are provided as a Source Data file.
Fig. 5
Fig. 5. Xrn1 and Xrn2 mediate rapid decay of ac4C-hypomodified tRNALeu(CAG) under heat shock via exonuclease activity.
A RT-qPCR analyses of Xrn1 and Xrn2 mRNA levels in KO-1 cells upon cotransfection of siXrn1-3 and siXrn2-3. Gapdh was included in RT-qPCR for normalization. siNC, a non-specific siRNA, n = 3. P-values are based on the two-way ANOVA analysis. Error bars, mean ± SEM, ⋆⋆⋆P  =  0.0009 (Xrn1, left, siXrn1-3 and siXrn2-3 vs. siNC), P  =  0.0226 (Xrn2, right, siXrn1-3 and siXrn2-3 vs. siNC). B Northern blotting analyses (left) and quantification (right) of abundance of tRNALeu(CAG) in KO-1 and Xrn1/Xrn2 double-knock down KO-1 cells during heat stress (40 °C, 20 min), n = 4. P-values are based on the ordinary one-way ANOVA analysis. Error bars, mean ± SEM, ⋆⋆⋆P  < 0.001 (siXrn1 + 2 vs. siNC), n.s. P  =  0.2742 (siXrn1 + 2 vs. WT). C Overexpression of Xrn1-Myc in KO-1 cells. D Northern blotting analyses (left) and quantification (right) of abundance of tRNALeu(CAG) in KO-1 or WT cells in the absence or presence of Xrn1-Myc overexpression during heat stress (40 °C, 20 min), n = 4. P values are based on the unpaired t test. Error bars, mean ± SEM, ⋆⋆⋆⋆P  < 0.0001 (KO-1, left, EV vs. Xrn1-Myc), n.s. P  =  0.4103 (WT, right, EV vs. Xrn1-Myc). E Overexpression of Xrn2-Myc in KO-1 cells. F Northern blotting analyses (left) and quantification (right) of the abundance of tRNALeu(CAG) in KO-1 or WT cells in the absence or presence of Xrn2-Myc overexpression during heat stress (40 °C, 20 min), n = 4. P values are based on the unpaired t test. Error bars, mean ± SEM, ⋆⋆P  = 0.0027 (KO-1, left, EV vs. Xrn2-Myc), n.s. P  =  0.5734 (WT, right, EV vs. Xrn2-Myc). G Overexpression of Xrn1-Myc, Xrn1-E178Q-Myc and Xrn1-D208A-Myc in KO-1 cells. H Northern blotting analyses (left) and quantification (right) of the abundance of tRNALeu(CAG) in KO-1 cells in the absence or presence of Xrn1-Myc (n = 7), Xrn1-E178Q-Myc, Xrn1-D208A-Myc overexpression (n = 3) during heat stress (40 °C, 20 min). P values are based on the unpaired t test. Error bars, mean ± SEM, ⋆⋆⋆⋆P  < 0.0001 (EV vs. Xrn1-Myc), n.s. P  =  0.3139 (EV vs. E178Q-Myc), n.s. P  =  0.9148 (EV vs. D208A-Myc). I Overexpression of Xrn2-Myc, Xrn2-E205Q-Myc, and Xrn2-D235A-Myc in KO-1 cells. J Northern blotting analyses (left) and quantification (right) of the abundance of tRNALeu(CAG) in KO-1 cells in the absence or presence of Xrn2-Myc (n = 7), Xrn2-E205Q-Myc, and Xrn2-D235A-Myc overexpression (n = 3) during heat stress (40 °C, 20 min). P values are based on the unpaired t test. Error bars, mean ± SEM, ⋆⋆⋆P  = 0.0008 (EV vs. Xrn2-Myc), n.s. P  =  0.1686 (EV vs. E205Q-Myc), n.s. P  =  0.8243 (EV vs. D235A-Myc). Source data are provided as a Source Data file.
Fig. 6
Fig. 6. Bpnt1 and Bpnt2 regulate the rapid decay of ac4C-hypomodified tRNALeu(CAG) under heat shock.
A RT-qPCR analyses of Bpnt1 mRNA level in KO-1 cells upon transfection of siBpnt1-3. Gapdh was included for normalization. n = 3. P values are based on the unpaired t test. Error bars, mean ± SEM, ⋆⋆⋆P  = 0.0002 (siNC vs. siBpnt1-3). Here and in panels (D) and (G), siNC denotes a non-specific siRNA. B Western blot analysis confirming a reduced level of Bpnt1 after knockdown by siBpnt1-3. C Northern blotting analyses (left) and quantification (right) of the abundance of tRNALeu(CAG) in KO-1 and Bpnt1-knock down KO-1 cells under heat stress (40 °C, 20 min). n = 4. P-values are based on the unpaired t test. Error bars, mean ± SEM, ⋆⋆⋆P  = 0.0007 (siBpnt1-3 vs. siNC). (D) RT-qPCR analyses of Bpnt2 mRNA level in KO-1 cells upon transfection of siBpnt2-3. Gapdh was included for normalization. n = 3. P-values are based on the unpaired t test. Error bars, mean ± SEM, ⋆⋆P  = 0.0098 (siNC vs. siBpnt2-3). E Western blot analysis confirming a reduced level of Bpnt2 after knockdown by siBpnt2-3. F Northern blotting analyses (left) and quantification (right) of the abundance of tRNALeu(CAG) in KO-1 and Bpnt2-knock down KO-1 cells under heat stress (40 °C, 20 min). n = 4. P values are based on the unpaired t test. Error bars, mean ± SEM, ⋆⋆P  = 0.0026 (siBpnt2-3 vs. siNC). G RT-qPCR analyses of Bpnt1 and Bpnt2 mRNA levels in KO-1 cells upon cotransfection of siBpnt1-3 and siBpnt2-3. Gapdh was included for normalization. n = 3. P-values are based on the two-way ANOVA analysis. Error bars, mean ± SEM, ⋆⋆⋆P  = 0.0005 (Bpnt1, left, siBpnt1-3 and siBpnt2-3 vs. siNC), ⋆⋆P  = 0.0026 (Bpnt2, right, siBpnt1-3 and siBpnt2-3 vs. siNC). H Northern blotting analyses (left) and quantification (right) of the abundance of tRNALeu(CAG) in KO-1 and Bpnt1/ Bpnt2 double-knock down KO-1 cells under heat stress (40 °C, 20 min). n = 4. P-values are based on the unpaired t test. Error bars, mean ± SEM, ⋆⋆⋆⋆P  < 0.0001 (siBpnt1 + 2 vs. siNC), n.s. P  =  0.0507 (siBpnt1 + 2 vs. WT). I Overexpression of Bpnt1-Myc in KO-1 cells. J Northern blotting analyses (left) and quantification (right) of the abundance of tRNALeu(CAG) in KO-1 and Bpnt1-Myc overexpressing KO-1 cells under heat stress (40 °C, 20 min). n = 4. P values are based on the unpaired t test. Error bars, mean ± SEM, P  = 0.0117 (EV vs. Bpnt1-Myc). K Overexpression of Bpnt2-Myc in KO-1 cells. L Northern blotting analyses (left) and quantification (right) of the abundance of tRNALeu(CAG) in KO-1 and Bpnt2-Myc overexpressing KO-1 cells under heat stress (40 °C, 20 min). n = 4. P-values are based on the unpaired t test. Error bars, mean ± SEM, P  = 0.019 (EV vs. Bpnt2-Myc). Source data are provided as a Source Data file.
Fig. 7
Fig. 7. Schematic model of functions of mThumpd1-mediated RNA acetylation in physiology and heat stress.
Under physiological conditions, in WT cells, mNat10 and mThumpd1 mediate ac4C12 biogenesis in tRNALeu and tRNASer, which are then charged by cytoplasmic LeuRS and SerRS, respectively. The generated Leu-tRNALeu and Ser-tRNASer ensure translational efficiency of ribosomal protein synthesis. Deletion of mThumpd1 leads to ac4C12-hypomodification of both tRNAs and reduced charging level of tRNASer and tRNALeu. The decoding efficiency of Leu and Ser codons, particularly those with two U-A base pairs in mRNA-tRNA interaction, is significantly impaired. Under heat stress, reduced charging level of tRNAsLeu and tRNAsSer is also observed. tRNALeu(CAG) is selectively decayed by the mRTD quality control pathway, mediated by Xrn1 and Xrn2, which is likely regulated by cellular pAp concentration balanced by Bpnt1 and Bpnt2. Created in BioRender. Chu, B. (2025) https://BioRender.com/nnq716s.

Similar articles

References

    1. Delaunay, S., Helm, M. & Frye, M. RNA modifications in physiology and disease: towards clinical applications. Nat. Rev. Genet25, 104–122 (2024). - PubMed
    1. Cappannini, A. et al. MODOMICS: A database of RNA modifications and related information. 2023 update. Nucleic Acids Res52, D239–D244 (2024). - PMC - PubMed
    1. Zhao, B. S., Roundtree, I. A. & He, C. Post-transcriptional gene regulation by mRNA modifications. Nat. Rev. Mol. Cell Biol.18, 31–42 (2017). - PMC - PubMed
    1. Kong, Y., Yu, J., Ge, S. & Fan, X. Novel insight into RNA modifications in tumor immunity: Promising targets to prevent tumor immune escape. Innovation4, 100452 (2023). - PMC - PubMed
    1. Suzuki, T. The expanding world of tRNA modifications and their disease relevance. Nat. Rev. Mol. Cell Biol.22, 375–392 (2021). - PubMed

LinkOut - more resources