. 2025 Jul 1;16(1):5834.
doi: 10.1038/s41467-025-60904-0.

BMAL1 and ARNT enable circadian HIF2α responses in clear cell renal cell carcinoma

Affiliations

BMAL1 and ARNT enable circadian HIF2α responses in clear cell renal cell carcinoma

Rebecca M Mello et al. Nat Commun. .

Abstract

Circadian disruption enhances cancer risk, and many tumors exhibit disordered circadian gene expression. We show rhythmic gene expression is unexpectedly robust in clear cell renal cell carcinoma (ccRCC). The core circadian transcription factor BMAL1 is closely related to ARNT, and we show that BMAL1-HIF2α regulates a subset of HIF2α target genes in ccRCC cells. Depletion of BMAL1 selectively reduces HIF2α chromatin association and target gene expression and reduces ccRCC growth in culture and in xenografts. Analysis of pre-existing data reveals higher BMAL1 in patient-derived xenografts that are sensitive to growth suppression by a HIF2α antagonist (PT2399). BMAL1-HIF2α is more sensitive than ARNT-HIF2α is to suppression by PT2399, and the effectiveness of PT2399 for suppressing xenograft tumor growth in vivo depends on the time of day at which it is delivered. Together, these findings indicate that an alternate HIF2α heterodimer containing the circadian partner BMAL1 influences HIF2α activity, growth, and sensitivity to HIF2α antagonist drugs in ccRCC cells.


Conflict of interest statement

Competing interests: The authors declare no competing interests.

Figures
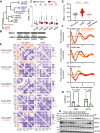
Fig. 1
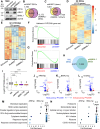
Fig. 1. BMAL1 is elevated and active in ccRCC.
A Phylogenetic tree for bHLH-PAS proteins. B Percent sequence identity for bHLH and PAS domains in BMAL1 and ARNT. C Detection of BMAL1 (transcripts per million, TPM) in RNA sequencing data from tumors and adjacent normal tissues in cancer genome atlas projects: colorectal adenocarcinoma (COAD, n = 82 non-tumor, n = 962 tumor), lung adenocarcinoma (LUAD, n = 59 non-tumor, n = 539 tumor), breast cancer (BRCA, n = 113 non-tumor, n = 1111 tumor), kidney clear cell renal cell carcinoma (KIRC, n = 72 non-tumor, n = 541 tumor), and renal papillary carcinoma (KIRP, n = 100 non-tumor, n = 872 tumor). D Nuclear BMAL1 protein detected in human kidney biopsy samples from ccRCC (n = 138), other renal cancers (n = 42), and non-tumor kidney tissue (n = 30). E Clock correlation distance (CCD) heatmaps calculated from RNA sequencing data from tumors and adjacent normal tissues in the Cancer Genome Atlas projects. In (E) one-sided p-values for non-tumor vs. tumor samples are calculated from permutation testing as described in detail in ref. . F Luminescence detected in cells expressing destabilized luciferase under the control of the PER2 promoter in 786O, A498, or RCC4 cell lines in which circadian rhythms were synchronized by treatment with dexamethasone (red) or horse serum (orange). G Quantitation of the rhythmic amplitude for data as in (F) for 786 O (n = 3 biological replicates per condition) or RCC4 (n = 4 biological replicates per condition) cells expressing Per2-Luciferase with (green) or without (black) concomitant expression of VHL and synchronized with dexamethasone. Error bars represent s.d. P values calculated by two-sided t-tests. H Detection of the indicated proteins by immunoblot in cell lysates prepared from 786O cells at the indicated times after treatment with dexamethasone or without synchronization (ns) or expressing VHL. Data represent one of two independent experiments with similar results. The samples derive from the same experiment but one gel for BMAL1, HIF2α, and ACTIN, and another for ARNT and ACTIN were processed in parallel. In (C), boxplots depict the median and interquartile range (IQR), whiskers extend either to the minimum or maximum data point or 1.5 × IQR beyond the box, whichever is shorter. Outliers (values beyond the whisker) are shown as dots. In (C,D) **P = 0.00149, ****P < 0.0001 by two-way ANOVA. Source data are provided as a Source Data file.
Fig. 2
Fig. 2. BMAL1 promotes growth and survival in ccRCC cells.
Dependency (CHRONOS) scores (A) and correlations thereof (B) for bHLH-PAS members in n = 37 RCC cell lines from DepMap,. Boxplots depict the median and interquartile range (IQR), whiskers extend either to the minimum or maximum data point or 1.5 × IQR beyond the box, whichever is shorter. In (A), p values calculated from multiple paired t tests with HPRT1 as the reference group, adjusted for multiple comparisons using the Holm method, were: BMAL1: 0.001, BMAL2: 0.007, EPAS1: 0.006, HIF1A: 1.47e−6. Representative images (C) and quantification (D,E) of colonies stained with crystal violet 10–16 days after plating 250 cells expressing the indicated plasmids per well. Data represent the mean ± s.d. for four (D) or three (E) independent experiments, each of which used three wells per condition. *P < 0.05, **P < 0.01, ***P < 0.001 by two-way ANOVA with Tukey’s correction for multiple hypothesis testing. F Volume of xenograft tumors grown in flanks of male or female NIH-III Nude mice from implanted 786O or A498 cells expressing indicated shRNAs. n = 10 xenografts were initiated for each group; up to two xenografts that failed to establish were excluded from analysis for each group. Weekly measurements of individual tumor volumes are shown. ****P < 0.0001 for shBMAL1 vs shControl by linear regression. Details of linear regression statistics: 786 O male: F = 30.13, DFn = 1, DFd = 75; 786O female: F = 41.58, DFn = 1, DFd = 78; A498 male: F = 26.01, DFn = 1, DFd = 96; A498 female: F = 27.02, DFn = 1, DFd = 96. Source data are provided as a Source Data file.
Fig. 3
Fig. 3. BMAL1 and HIF2α form an active heterodimer.
A Heparin chromatography elution of BMAL1 and HIF2α co-expressed in insect cells. SDS-PAGE analysis shows a co-eluted stoichiometric complex of BMAL1-HIF2α from one of two independent experiments with similar results. B Mass photometry of purified BMAL1-HIF2α complex. A minor peak centered at 91 kDa corresponds to the molecular weight of HIF2α, suggesting that it is in slight excess. The major peak, centered at 157 kDa, is consistent with the calculated molecular weight for the BMAL1-HIF2α heterodimer. C Detection of endogenous HIF2α and CLOCK and of ectopically expressed FLAG-tagged class I bHLH-PAS proteins by immunoblot of lysates (input) or complexes purified with an anti-FLAG antibody from 786O cells expressing the indicated plasmids. The data represent one of three independent experiments with similar results. D Relative luminescence units detected in HEK293T cells expressing luciferase under the control of a hypoxia-responsive element with the indicated additional plasmids. ****P < 0.0001 by one-way ANOVA with Tukey’s correction for multiple comparisons. Data in (D) depict the mean ± s.d. for n = 5 biological replicates from one of three independent experiments with similar results. Source data are provided as a Source Data file.
Fig. 4
Fig. 4. Endogenous BMAL1 contributes to HIF2α target gene expression in RCC cells.
A Detection of HIF2α, ARNT, BMAL1, and ACTIN by immunoblot in 786O cells expressing the indicated shRNAs. The samples derive from the same experiment but one gel for BMAL1, HIF2α, and ACTIN, and another for ARNT and ACTIN were processed in parallel. Data from one of two independent experiments with similar results. Venn diagrams (B, C) and heatmaps (D, E) depicting all differentially expressed genes (DEGs) (B, significantly downregulated genes (C, D) or downregulated genes in the Hallmark HYPOXIA gene set (E) in 786O cells expressing the indicated shRNAs (n = 3 distinct samples for each condition). DEGs were identified using DESeq2 with a false discovery rate (FDR) cutoff of 0.1. Enrichment plots showing the impact of shARNT (F) or shBMAL1 (G) on genes in the Hallmark HYPOXIA gene set. H Venn diagram depicting overlap of DEGs in 786O cells expressing VHL (WT8 cells) or expressing shBMAL1. I Boxplot depicting changes in gene expression in PDXs treated with PT2399 (data from ref. including sensitive PDXs only, n = 12 biological replicate PDX tumors per condition) for genes grouped by whether their expression in 786 O cells is decreased by shARNT and not by shBMAL1 (ARNTsp, yellow, n = 1069 genes), by shBMAL1 and not by shARNT (BMAL1sp, purple, n = 1707 genes), by either shARNT or shBMAL1 (Overlap, salmon, n = 1273 genes), or neither (NA, gray, n = 15,584 genes). **** P = 3.27e−10 by two-way ANOVA with Tukey’s correction. Boxes depict the median and interquartile range (IQR), whiskers extend either to the minimum or maximum data point or 1.5 × IQR beyond the box, whichever is shorter. Outliers (values beyond the whisker) are shown as dots. J–L Volcano plots depicting expression changes for individual genes in groups depicted in (I). Genes with padj <0.05 are colored in red (fold change >1.5) or blue (fold change <0.67). padj is calculated in DESeq2 using p-values attained by the Wald test and corrected for multiple testing using the Benjamini and Hochberg method. Top non-redundant GOBP (M) or KEGG (N) pathways with ≥15 genes, FDR < 0.05, fold enrichment ≥2 enriched among ARNT-specific or BMAL1-specific target genes in 786O cells. Source data are provided as a Source Data file.
Fig. 5
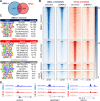
Fig. 5. BMAL1 influences recruitment of HIF2α to a subset of target genes.
A Venn diagram depicting the numbers of genomic sites (“peaks”) identified in chromatin fragments isolated by CUT&RUN procedure from 786O cells using antibodies recognizing BMAL1 (blue) or HIF2α (red). n = 3 samples per condition. B Chromatin binding profiles of BMAL1 and HIF2α in CUT&RUN samples (n = 3 per condition) prepared from 786O cells expressing the indicated shRNAs. Peaks are depicted in four clusters: BMAL1 peaks in 786O cells expressing shControl (top cluster: 1813 peaks), HIF2α peaks in 786 O cells expressing shControl (second cluster: 1207 peaks), peaks associated with both BMAL1 and HIF2α in 786 O cells expressing shControl (third cluster: 336 peaks), or HIF2α peaks identified only in 786 O cells expressing shBMAL1 (bottom cluster: 393 peaks). C Transcription factor binding motifs enriched in chromatin associated with BMAL1 (blue), HIF2α (red), or both (common, gray) in shControl cells. p-values were calculated in HOMER based on the hypergeometric distribution as described in ref. . D Representative genome browser tracks for BMAL1 and HIF2α CUT&RUN in 786 O cells expressing shControl or shBMAL1, showing peaks in VEGFA, SERPINE1, and NR1D1 loci. Data represent merged read counts for triplicate samples for each condition. Source data are provided as a Source Data file.
Fig. 6
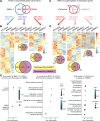
Fig. 6. BMAL1 chromatin occupancy correlates with BMAL1-dependent expression.
A, C Venn diagrams depicting the numbers of genomic sites (“peaks”) identified in chromatin fragments isolated by CUT&RUN procedure from 786O cells using antibodies recognizing BMAL1 (blue) or HIF2α (red, pink) that are associated with genes that were detected in RNA prepared from 786O cells expressing shRNA targeting a control sequence (shControl) or BMAL1 (shBMAL1). B, D Heatmaps depicting differentially expressed genes (DEGs) associated with the chromatin binding sites bound by BMAL1 and/or HIF2α depicted in (A, B) as indicated. (FDR < 0.1 by DESeq2 for shControl vs. shARNT or shControl vs. shBMAL1). E Pathway enrichment in HIF2a-occupied genes grouped by BMAL1 occupancy and impact of shBMAL1. The x-axis represents the Enrichment Ratio, and the y-axis represents enriched GOBP pathways for genes associated with HIF2α peaks in 786O cells expressing shControl with at least 5 genes, FDR < 0.05, and fold enrichment >2. Expression of these genes was increased or decreased in 786O cells expressing shBMAL1 compared to 786O cells expressing shControl. Source data are provided as a Source Data file.
Fig. 7
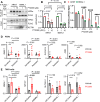
Fig. 7. BMAL1-HIF2α heterodimers are sensitive to disruption by PT2399.
A Detection of HA-tagged stabilized HIF2α and FLAG-tagged class I bHLH-PAS proteins by immunoblot of lysates (input) or complexes purified with an anti-FLAG antibody from HEK 293 cells expressing the indicated plasmids and treated with the indicated concentrations of PT2399 for 1 h. B Quantitation of data like that shown in (A), normalized to 0 μM control groups. Data represent the mean ± s.d. for n = 3 biological replicates. C Relative luminescence units detected in HEK293T cells expressing luciferase under the control of a hypoxia-responsive element with overexpressed stabilized HIF2α and ARNT (salmon) or BMAL1 (green) and treated with the indicated concentrations of PT2399. Data show mean ± s.d. for n = 5 biological replicates from one of three experiments with similar results. **** P < 1e−6. D, E Detection of BMAL1, NR1D1, SLC2A14, and DDIT4 transcripts in patient-derived xenograft tumors collected from mice treated with PT2399 (red) or vehicle control (black) grouped by whether tumor growth was reduced by PT2399 (sensitive) or not (resistant) (D) or in 786O cells expressing the indicated shRNAs and treated with 10 μM PT2399 (red) or vehicle control (black) for 6 h (E). Data represent transcripts per million detected by sequencing RNA collected from 11 resistant or 12 sensitive PDX tumors (D) or the mean ± s.e.m. for relative expression normalized to RPLP0 by quantitative RT-PCR for three biological replicates each measured in triplicate (E). *P < 0.05, **P < 0.01, ***P < 0.001, ****P < 0.0001 by two-way ANOVA or mixed effects analysis with Tukey’s correction for multiple hypothesis testing. Source data are provided as a Source Data file.
Fig. 8
Fig. 8. BMAL1 promotes ccRCC xenograft growth and sensitivity to PT2399 in vivo.
A–F Volume of xenograft tumors grown from 786O cells implanted in flanks of female NIH-III Nude mice treated with 10 mg/kg of PT2399 unless otherwise indicated or vehicle control three times weekly by oral gavage between ZT0 and ZT2 (AE) or at ZT0 (open symbols) or ZT12 (filled symbols) (F). In (AD) dark and light green symbols represent xenografts grown from 786O cells expressing wildtype (dark green) or D144A mutant (light green) BMAL1; filled and open symbols represent tumors in mice treated with vehicle control or with PT2399, respectively. In (E, F) black and red symbols represent xenografts grown in mice treated with vehicle control or with PT2399, respectively. **P < 0.01, ****P < 0.0001 by simple linear regression. In (A, E), P values represent comparison to 786O and to 30 mg/kg, respectively. In (AE), n = 5 animals per group. In (F), n = 3 for the group treated with PT2399 at ZT12 because two mice died before the completion of the study. Data represent mean ± s.e.m. Source data are provided as a Source Data file.

Update of

Similar articles

References

    1. Shilts, J., Chen, G. & Hughey, J. J. Evidence for widespread dysregulation of circadian clock progression in human cancer. PeerJ6, e4327 (2018). - PMC - PubMed
    1. Papagiannakopoulos, T. et al. Circadian rhythm disruption promotes lung tumorigenesis. Cell Metab. 10.1016/j.cmet.2016.07.001 (2016). - PMC - PubMed
    1. Chun, S. K. et al. Disruption of the circadian clock drives Apc loss of heterozygosity to accelerate colorectal cancer. Sci. Adv.8, eabo2389 (2022). - PMC - PubMed
    1. Dong, Z. et al. Targeting glioblastoma stem cells through disruption of the circadian clock. Cancer Discov.9, 1556–1573 (2019). - PMC - PubMed
    1. Linehan, W. M. & Ricketts, C. J. The Cancer Genome Atlas of renal cell carcinoma: findings and clinical implications. Nat. Rev. Urol.16, 539–552 (2019). - PubMed

MeSH terms

Substances

LinkOut - more resources