. 2025 Jul 1;16(1):5901.
doi: 10.1038/s41467-025-61157-7.

DNA methylation protects cancer cells against senescence

Affiliations

DNA methylation protects cancer cells against senescence

Xiaoying Chen et al. Nat Commun. .

Abstract

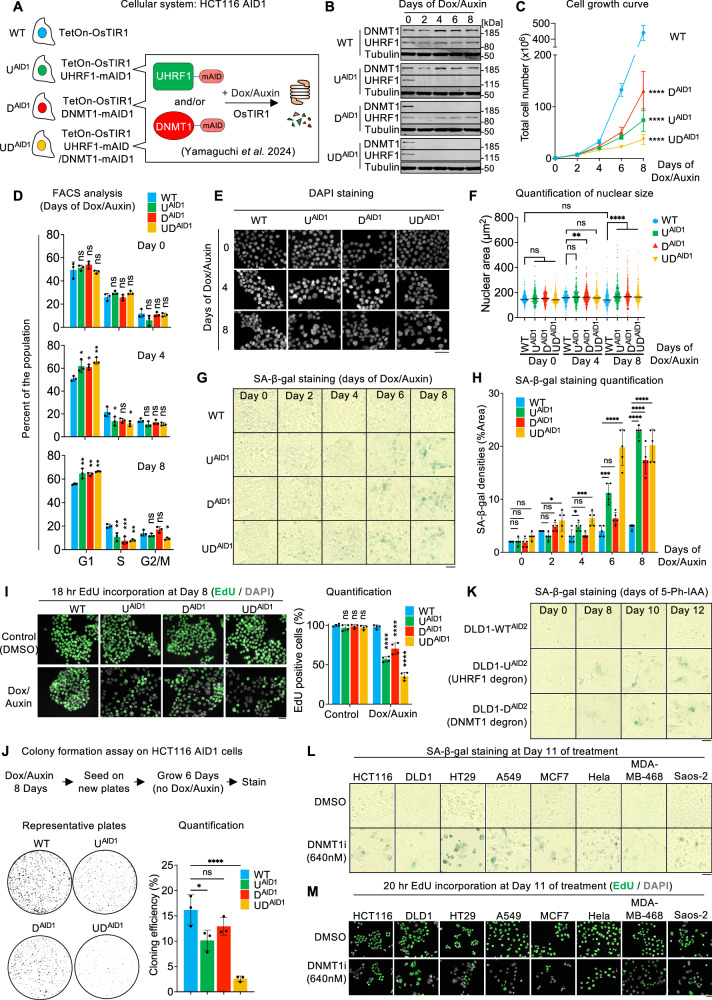
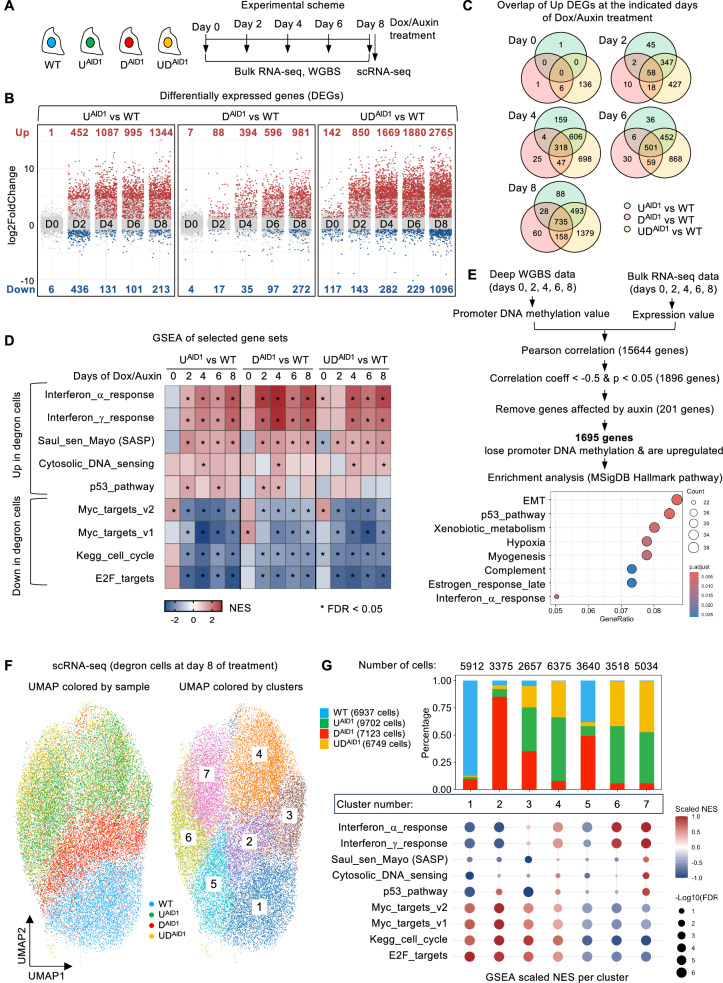
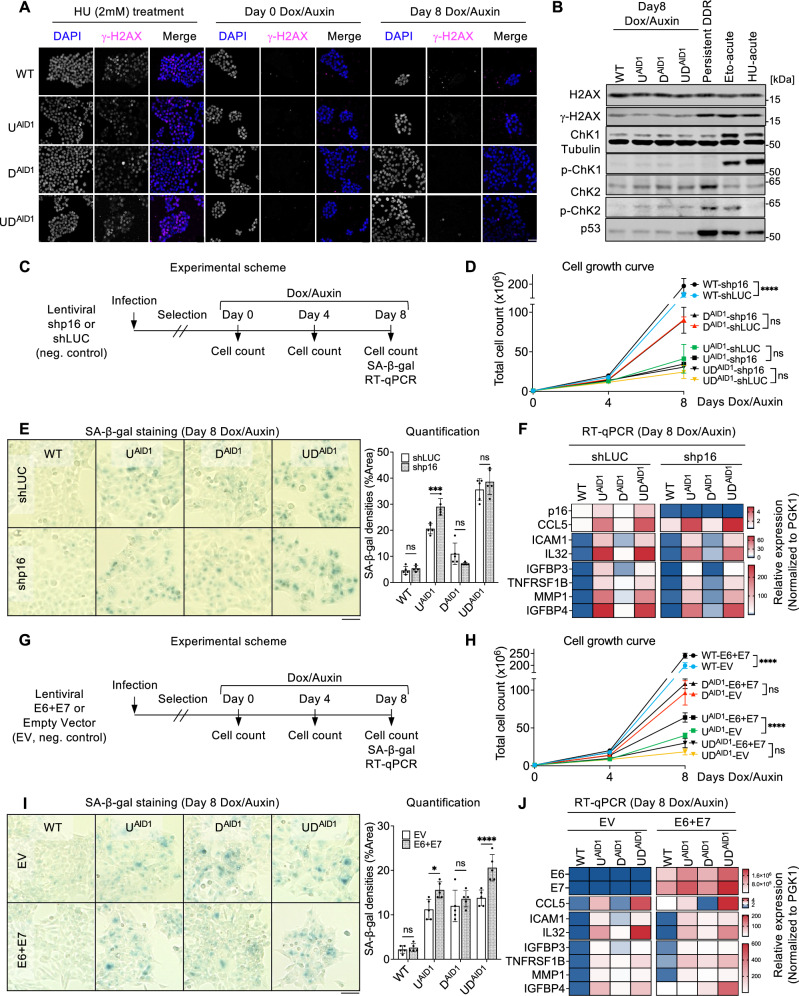
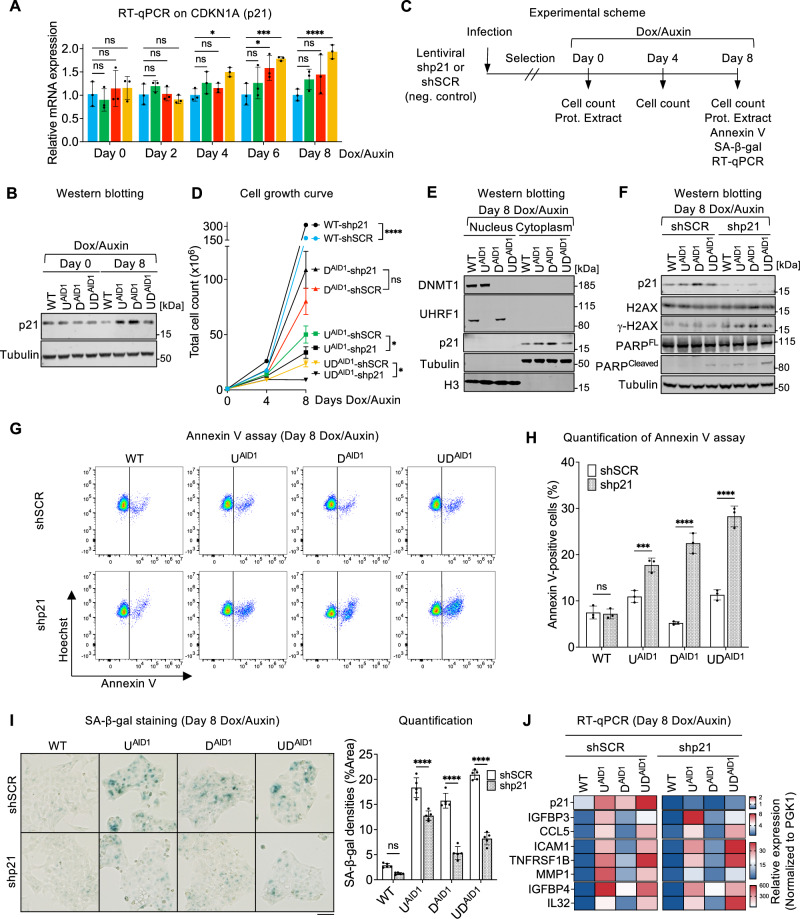
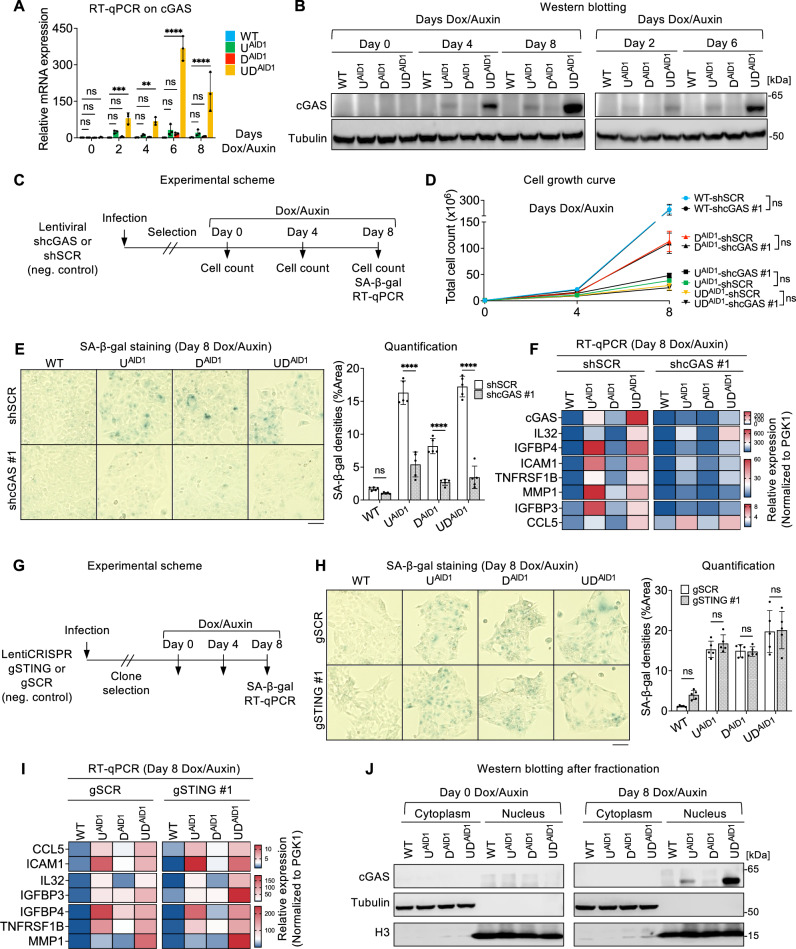
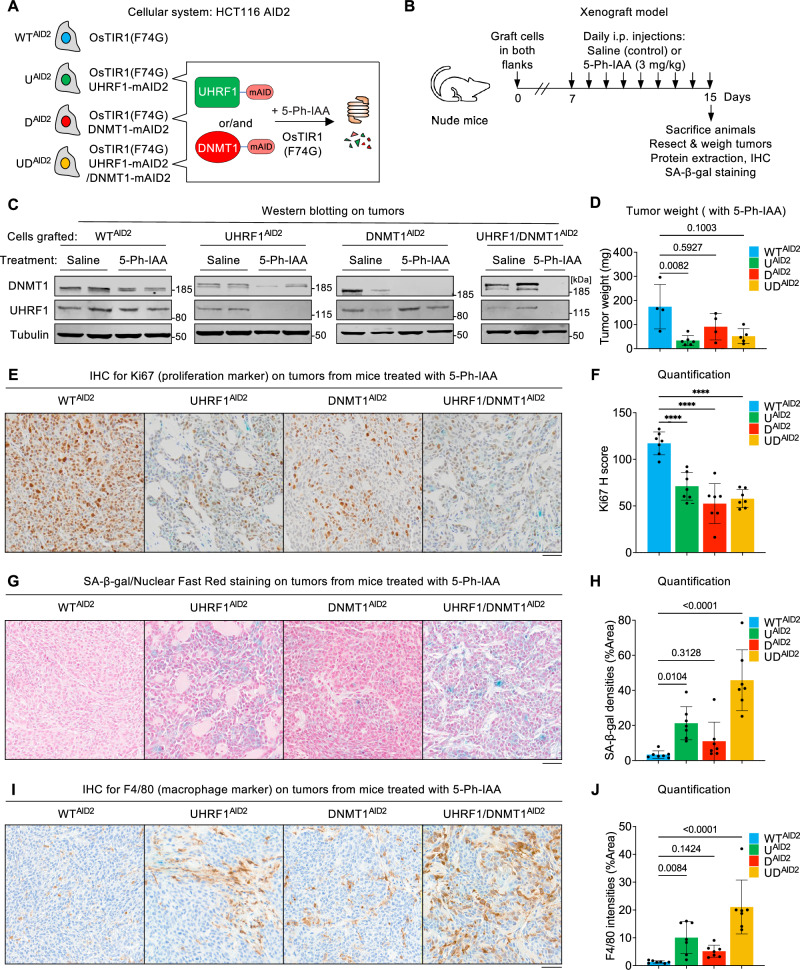
Inhibitors of DNA methylation such as 5-aza-deoxycytidine are widely used in experimental and clinical settings. However, their mechanism of action is such that DNA damage inevitably co-occurs with loss of DNA methylation, making it challenging to discern their respective effects. Here we deconvolute the effects of decreased DNA methylation and DNA damage on cancer cells, by using degron alleles of key DNA methylation regulators. We report that cancer cells with decreased DNA methylation-but no DNA damage-enter cellular senescence, with G1 arrest, SASP expression, and SA-β-gal positivity. This senescence is independent of p53 and Rb, but involves p21, which is cytoplasmic and inhibits apoptosis, and cGAS, playing a STING-independent role in the nucleus. Xenograft experiments show that tumor cells can be made senescent in vivo by decreasing DNA methylation. These findings reveal the intrinsic effects of loss of DNA methylation in cancer cells and have practical implications for future therapeutic approaches.


Conflict of interest statement

Competing interests: The authors declare no competing interests.

Figures

Fig. 1
Fig. 1. Prolonged UHRF1 or DNMT1 depletion triggers senescence in cancer cells.
A The auxin degron system in HCT116 cells conditionally expressing OsTIR1. B Western blot validating the degradation of UHRF1 and/or DNMT1 upon Dox/Auxin treatment. C Cell growth curve. N = 3 biological replicates. D Cell-cycle analysis by FACS with BrdU and PI staining. N = 3 biological replicates. E Representative images of DAPI staining in the indicated lines. F Nuclear area determination by DAPI staining. N  =  441, 441, 393, 583, 326, 300, 459, 500, 325, 326, 339 and 356 nuclei, respectively. G Representative images of SA-β-gal staining after Dox/Auxin treatment. H Quantification of SA-β-gal staining. N = 5 fields of view. I Visualization and quantification of EdU incorporation by the indicated cells during an 18-h pulse. N = 4 fields of view. J Colony-forming assay on the indicated degron cells. N = 3 biological replicates. K Representative images of SA-β-gal staining after 5-Ph-IAA (1 µM) treatment with the indicated DLD1 degron cells constitutively expressing OsTIR1 (F74G). L Representative images of SA-β-gal staining after treatment of the indicated cells with DMSO or DNMT1 inhibitor GSK-3685032 (640 nM). M Visualization of EdU incorporation by the indicated cells during a 20-h pulse. All scale bars are 50 µm. Data of C, D, HJ are presented as mean ± SD and analyzed by one-way ANOVA test with Dunnett’s multiple comparisons test. Data of F are presented as median and analyzed by Kruskal–Wallis test with Dunn’s multiple comparisons test. In all figures, we use the following convention: *p < 0.05, **p < 0.01, ***p < 0.001, **** p < 0.0001, ns non-significant. Source data are provided as a Source Data file.
Fig. 2
Fig. 2. Senescence caused by loss of DNA methylation is accompanied by an interferon response and a SASP signature.
A Experimental scheme of sample collection for bulk RNA sequencing (RNA-seq), whole-genome bisulfite sequencing (WGBS) and single cell RNA sequencing (scRNA-seq). B Number of differentially expressed genes (DEGs) at the indicated days of Dox/Auxin treatment. DEGs were identified using DESeq2 tool. P values were calculated using a two-sided Wald test and adjusted for multiple comparisons via the Benjamini-Hochberg (BH) method. Up-regulated genes (red): adjusted p value < 0.05 and log2 FoldChange > 1. Down-regulated genes (blue): adjusted p value < 0.05 and log2 FoldChange < −1. Light gray dots: no significant change. C Venn diagram of significantly up-regulated DEGs. D Gene set enrichment analysis (GSEA) of selected gene sets from the Molecular Signatures Database (MSigDB). The heatmap represents the normalized enrichment score (NES) in each comparison at the indicated days. Significantly enriched gene sets are shown in red; significantly depleted gene sets are displayed in blue. Conditions with an asterisk are significant with a false discovery rate (FDR)  <  0.05. E Combined analysis of the WGBS and bulk RNA-seq data identifies genes for which loss of promoter DNA methylation correlates with gene activation. The promoter region is defined from −1200 bp to 300 bp relative to the transcription start site (TSS). Enrichment analysis was performed using clusterProfiler package. Significantly enriched terms were identified by a one-sided Fisher’s exact test. Enriched Hallmark pathways (MSigDB) for these genes are shown with dot plot indicating gene ratio and BH-adjusted FDR. F UMAP visualization of scRNA-seq data from degron cells at day 8 of treatment. Left: colored by sample; right: colored by clusters. G Analysis of the corresponding Leiden clusters. Top: bar plot showing the number and proportion of cells per cluster from each sample. Bottom: GSEA analysis of selected gene sets per cluster. Dot size represents significance (–log10 FDR), and color indicates scaled NES. Source data are provided as a Source Data file.
Fig. 3
Fig. 3. Senescence caused by loss of DNA methylation is independent of p53 and p16/Rb.
A γ-H2AX immunofluorescence in HCT116 lines upon hydroxyurea treatment (HU, 2 mM, 4 h) or upon Dox/Auxin treatment. B Immunoblots for total H2AX, γ-H2AX, Chk1, phospho-Chk1 (Ser317), Chk2, phospho-Chk2 (Thr68), and p53 after 8-day Dox/Auxin treatment. HCT116 cells were used as positive controls: Persistent DNA damage response (DDR): Etoposide (10 µM, 24 h), then plain medium for 5 days; Eto-acute: Etoposide, 10 µM, 4 h; HU-acute: hydroxyurea, 2 mM, 4 h. C Scheme of p16 depletion experiments. D Total cell numbers at the indicated days of Dox/Auxin treatment. N = 3 technical replicates. E SA-β-gal staining and quantification of indicated lines. N = 5 fields of view. F RT-qPCR results of p16 (CDKN2A) and selected SASP genes. G Scheme of E6 + E7 expression experiments. H Total cell numbers at the indicated days of Dox/Auxin treatment. N = 3 technical replicates. I SA-β-gal staining and quantification of indicated lines. N = 5 fields of view. J RT-qPCR results of E6, E7, and selected SASP genes. All scale bars are 50 µm. Data of D, E, H, I are presented as mean ± SD and analyzed by two-way ANOVA with Sidak’s multiple comparisons test. Heatmap data of F, J are presented as mean from three technical replicates. In all figures we use the following convention: *p < 0.05, ***p < 0.001, ****p < 0.0001, ns non-significant. Source data are provided as a Source Data file.
Fig. 4
Fig. 4. p21 contributes to resistance against apoptosis during senescence caused by decreased DNA methylation.
A RT-qPCR analysis of CDKN1A (p21) mRNA levels across indicated days of Dox/Auxin treatment. N = 3 biological replicates. B Immunoblots for p21 in the indicated condition. C Experimental scheme of p21 depletion and assessment. D Total cell numbers at the indicated days of Dox/Auxin. N = 3 technical replicates. E Immunoblots for DNMT1, UHRF1, and p21 in the nuclear and cytoplasmic fractions of indicated lines at Day 8 of Dox/Auxin treatment. F Immunoblots of p21, H2AX, γ-H2AX, full-length (FL) PARP, and cleaved PARP in the indicated lines at Day 8 of Dox/Auxin treatment. G Representative results of Annexin V/Hoechst 33342 double staining in the indicated conditions. H Quantification of Annexin V-positive cells at Day 8 of Dox/Auxin treatment. N = 3 technical replicates. I SA-β-gal staining (left panel) and quantification (right panel) of indicated lines. N = 5 fields of view. Scale bar is 50 µm. J RT-qPCR on CDKN1A (p21) and selected SASP genes in indicated conditions. Data of (A) are presented as mean ± SD and analyzed by one-way ANOVA with Dunnett’s multiple comparisons test. Data of D, H, I are presented as mean ± SD and analyzed by two-way ANOVA with Sidak’s multiple comparisons test. Heatmap data of J are presented as mean from three technical replicates. We use the following convention: *p < 0.05, ****p < 0.001, ****p < 0.0001, ns non-significant. Source data are provided as a Source Data file.
Fig. 5
Fig. 5. cGAS is necessary for SA-β-gal positivity and SASP expression during senescence caused by loss of DNA methylation, and it acts independently of STING.
A RT-qPCR on cGAS in HCT116 lines upon Dox/Auxin treatment. N = 3 biological replicates. B Western blotting of cGAS protein in HCT116 lines at the indicated days upon Dox/Auxin treatment. C Scheme of cGAS knockdown experiments. D Total cell numbers at the indicated days upon Dox/Auxin treatment. N = 3 technical replicates. E SA-β-gal staining (left panel) and quantification (right panel) of the indicated lines. N = 5 fields of view. F RT-qPCR results of cGAS and selected SASP genes. G Scheme of STING knockout experiments. H SA-β-gal staining (left panel) and quantification (right panel). N = 5 fields of view. I RT-qPCR results of selected SASP genes. J Western blotting of cGAS in cytoplasmic and nuclear fractions of HCT116 lines at the indicated days upon Dox/Auxin treatment. All scale bars are 50 µm. Data of A, D, E, H are presented as mean ± SD. Data of A are analyzed by one-way ANOVA with Dunnett’s multiple comparisons test. Data of D, E, H are analyzed by two-way ANOVA with Sidak’s multiple comparisons test. Heatmap data of F, I are presented as mean from three technical replicates. In all figures, we use the following convention: **p < 0.01, ***p < 0.001, ****p < 0.0001, ns: non-significant. Source data are provided as a Source Data file.
Fig. 6
Fig. 6. Senescence caused by loss of DNA methylation also occurs in vivo.
A The auxin degron system in HCT116 cells constitutively expressing OsTIR1(F74G). B Scheme of the xenograft experiments. C Western blot validating the degradation of UHRF1 and/or DNMT1 upon 5-Ph-IAA treatment of mice. D Tumor weight in mice treated with 5-Ph-IAA. N = 4 tumors for WTAID2, 6 tumors for UADI2, 4 tumors for DAID2, and 5 tumors for UDAID2. E Immunohistochemistry (IHC) staining of Ki67 in indicated tumors. F Quantification of Ki67 IHC using H score. N = 7 fields of view at 400× original magnification. G Representative images of SA-β-gal staining in indicated tumors. Nuclear Fast Red (NFR) was used for counterstaining. H Quantification of SA-β-gal staining. N = 7 fields of view at 300× original magnification. I IHC staining of F4/80 in indicated tumors. J Quantification of F4/80 IHC. N = 7 fields of view at 400× original magnification. All scale bars are 50 µm. All data are presented as mean ± SD. Data of D, H, J are analyzed by Kruskal–Wallis test and Dunn’s multiple comparison test. Data of F are analyzed by one-way ANOVA and Dunnett’s multiple comparisons test. We use the following convention: ****p < 0.0001. Source data are provided as a Source Data file.

Similar articles

References

    1. Luo, C., Hajkova, P. & Ecker, J. R. Dynamic DNA methylation: In the right place at the right time. Science361, 1336–1340 (2018). - PMC - PubMed
    1. Smith, Z. D., Hetzel, S. & Meissner, A. DNA methylation in mammalian development and disease. Nat. Rev. Genet. 10.1038/s41576-024-00760-8 (2024). - PubMed
    1. Wu, X. & Zhang, Y. TET-mediated active DNA demethylation: mechanism, function and beyond. Nat. Rev. Genet.18, 517–534 (2017). - PubMed
    1. Petryk, N., Bultmann, S., Bartke, T. & Defossez, P.-A. Staying true to yourself: mechanisms of DNA methylation maintenance in mammals. Nucleic Acids Res.49, 3020–3032 (2021). - PMC - PubMed
    1. Laisné, M., Gupta, N., Kirsh, O., Pradhan, S. & Defossez, P.-A. Mechanisms of DNA methyltransferase recruitment in mammals. Genes9, 617 (2018). - PMC - PubMed

MeSH terms

Substances