. 2025 Jul 1;16(1):5996.
doi: 10.1038/s41467-025-60933-9.

The loss of OPA1 accelerates intervertebral disc degeneration and osteoarthritis in aged mice

Affiliations

The loss of OPA1 accelerates intervertebral disc degeneration and osteoarthritis in aged mice

Vedavathi Madhu et al. Nat Commun. .

Abstract

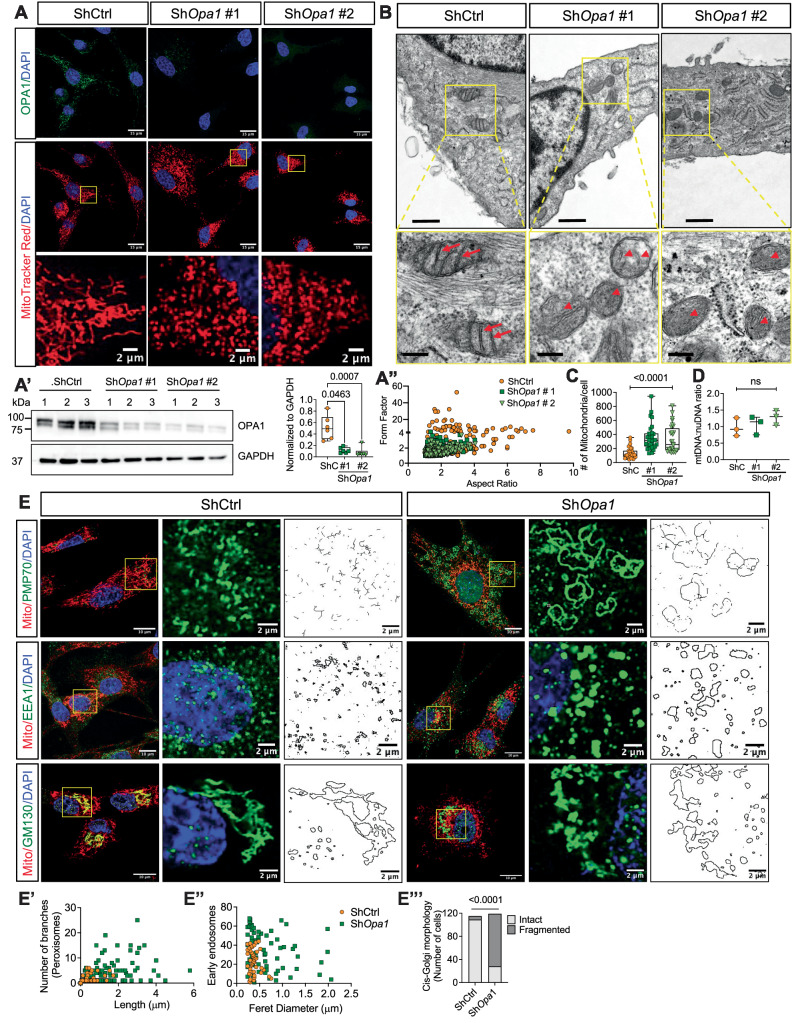
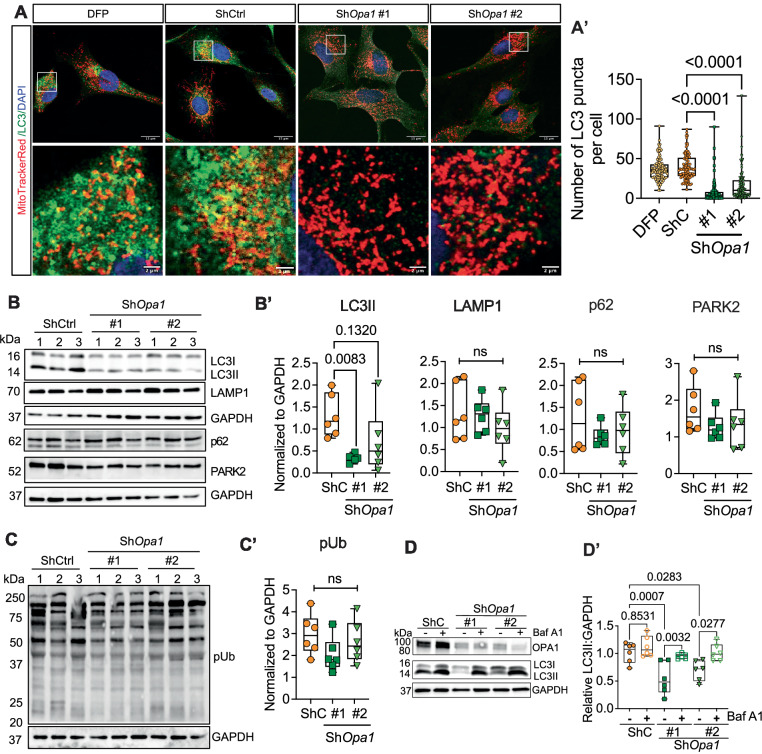
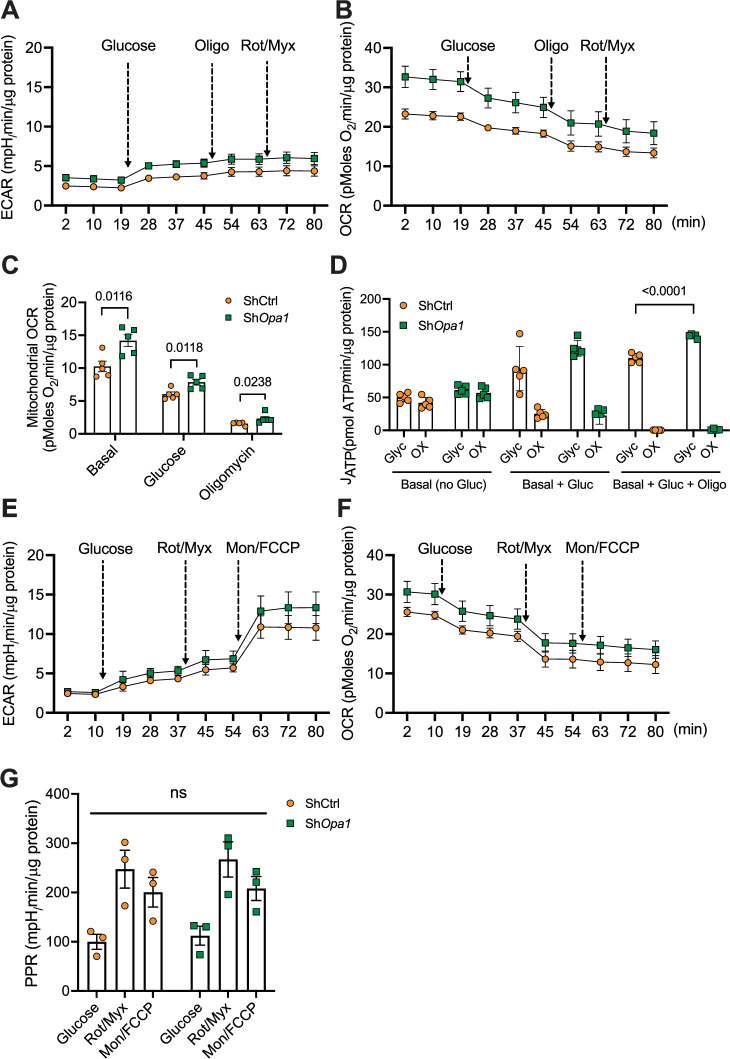
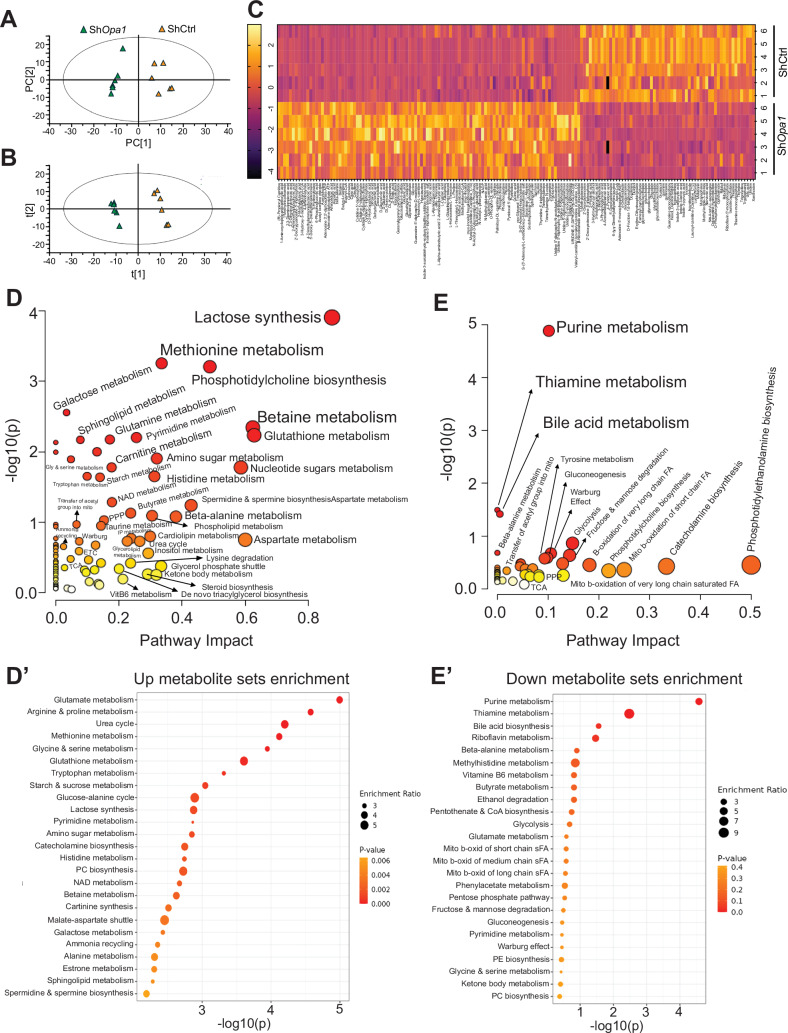
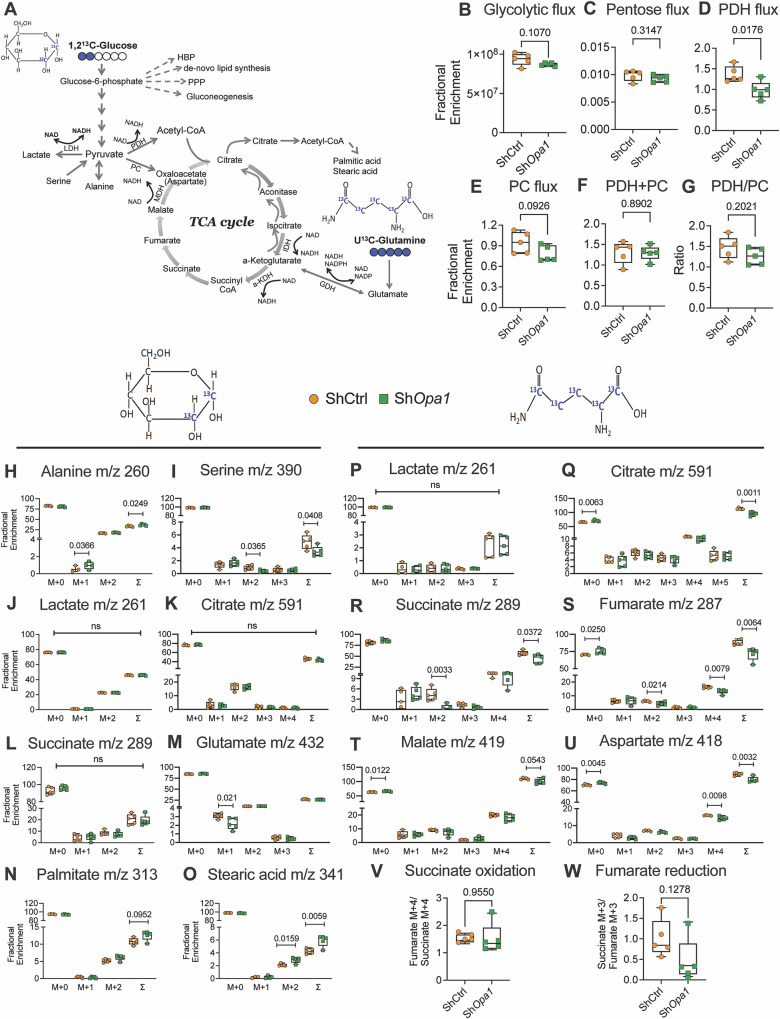
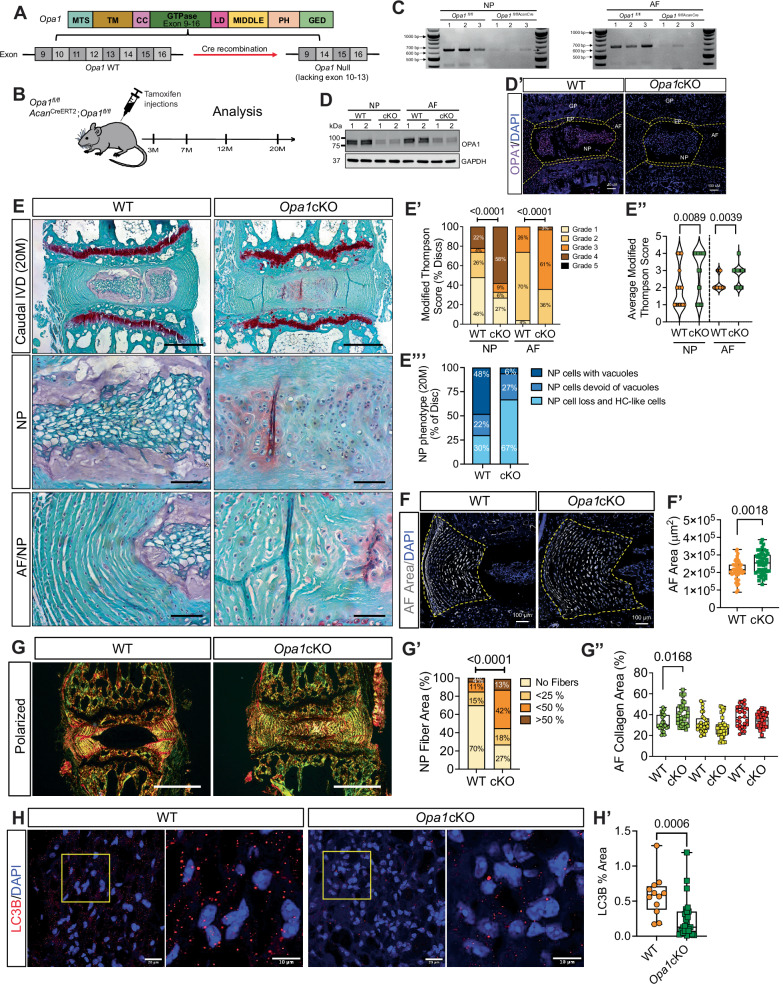
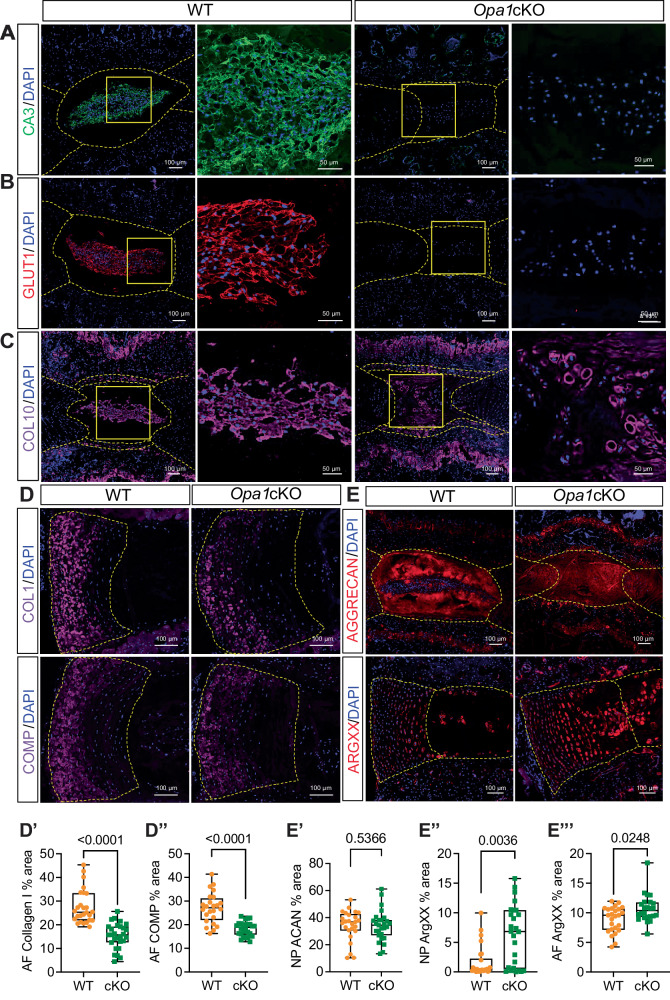
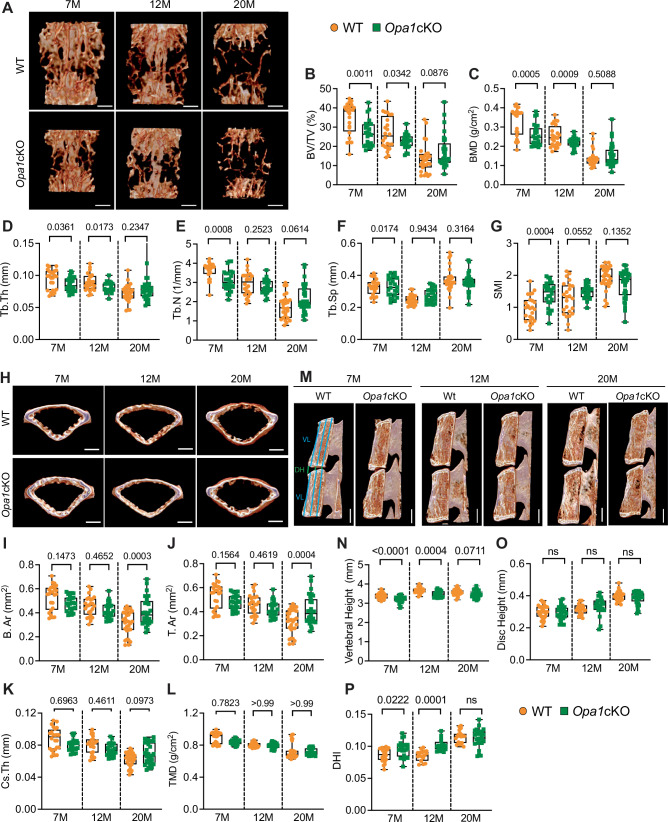
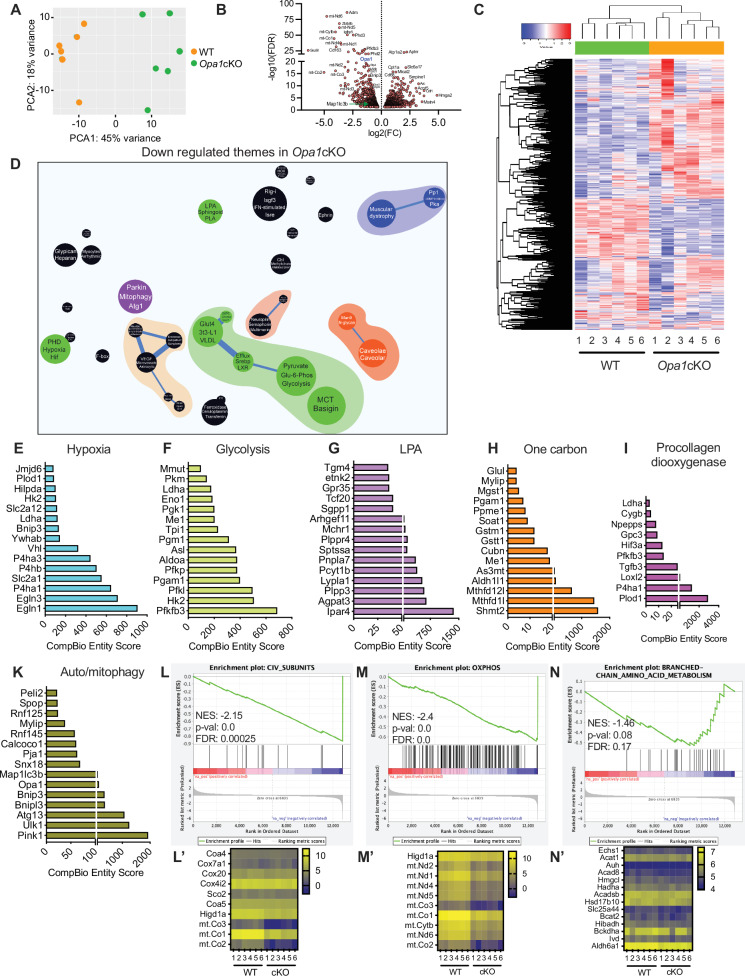
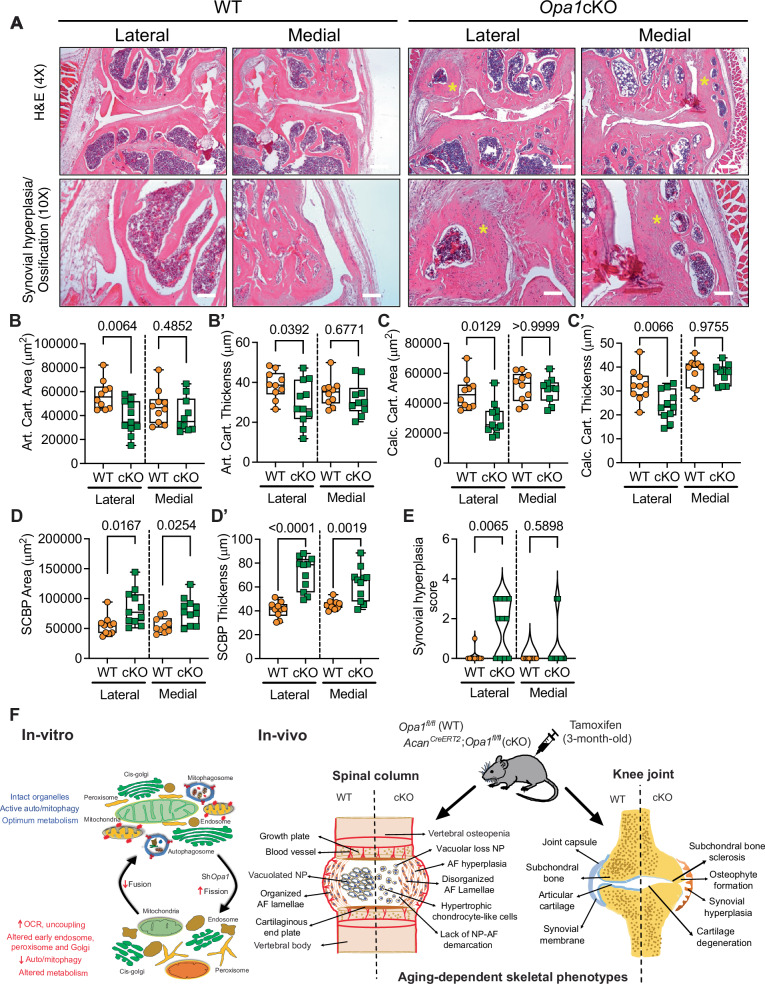
Recent studies have highlighted the importance of mitochondria in NP cells and articular chondrocyte health. Since the understanding of mechanisms governing mitochondrial dynamics in these tissues is lacking, we investigated the role of OPA1, a mitochondrial fusion protein, in their homeostasis. OPA1 knockdown in NP cells altered mitochondrial size and cristae shape and increased the oxygen consumption rate. OPA1 governed the morphology of multiple organelles, including peroxisomes, early endosomes and cis-Golgi and loss resulted in the dysregulation of autophagy. Metabolic profiling and 13C-flux analyses revealed TCA cycle anaplerosis and altered metabolism in OPA1-deficient NP cells. Noteworthy, Opa1AcanCreERT2 mice showed age-dependent disc degeneration, osteoarthritis, and vertebral osteopenia. RNA-Sequencing of Opa1cKO NP tissue revealed dysregulation of metabolism, autophagy, cytoskeletal reorganization, and extracellular matrix and shared strong thematic similarities with a subset of human degenerative NP samples. Our findings underscore that maintenance of mitochondrial dynamics and multi-organelle cross-talk is critical in preserving metabolic homeostasis of disc and cartilage.


Conflict of interest statement

Competing interests: The authors declare no competing interests.

Figures

Fig. 1
Fig. 1. OPA1 maintains mitochondrial and multiple organelle morphology in NP cells.
A Immunofluorescence staining for OPA1 and MitoTracker Red in primary NP cells transduced with lentivirally delivered control (ShCtrl) and Opa1 (ShOpa1 #1 and ShOpa1 #2) ShRNAs. The staining experiment was performed 2 times independently. Scale bar: Top rows- 15 μm, bottom row- 2 μm. A’ Western blot to confirm OPA1 knockdown in NP cells. A” Mitochondrial morphology and network analysis. B TEM images of ShCtrl and ShOpa1 transduced cells. Scale bar: Top row − 600 nm, bottom row − 200 nm C Mitochondrial number measurements from OPA1-deficient NP cells; 28-30 cells were measured from two independent experiments. D The mtDNA content in control and OPA1-deficient cells. Data are represented as box and whisker plots showing all data points with median and interquartile range and maximum and minimum values. Statistical significance was performed using One-way ANOVA or Kruskal-Wallis test with Sidak’s multiple comparisons test as appropriate (A’, C, D). E Staining for peroxisome marker PMP70, early endosome marker EEA1, and cis-Golgi marker GM130. Scale bar: 10 and 2 μm E’, E” Morphology analysis of PMP70, EEA1 shows altered morphology of peroxisomes and early endosomes in ShOpa1 cells. E”’ Quantification shows increased fragmented cis-Golgi in ShOpa1 transduced cells. 100-110 cells were measured for each of the organelle markers. Statistical significance was measured with a two-sided chi-square test. Source data are provided as a Source Data file.
Fig. 2
Fig. 2. OPA1 deficiency disrupts NP cell autophagy.
A Immunofluorescence staining of LC3B; OPA1-deficient NP cells shows a stark absence of LC3B puncta. Scale bar: Top Row-15, Bottom Row - 2 μm. Staining was performed 3 times independently. B, B’ Representative Western blot showing data from 3 experiments and densitometric analysis of autophagy/mitophagy pathway markers LC3II, p62, LAMP1, and PARK2 in NP cells shOpa1. C, C’ Representative Western blot and densitometry of phospho-ubiquitin after OPA1 deletion. n = 6 independent experiments. D, D’ Western blot analysis of LC3B in ShCtrl and ShOpa1 transduced cells cultured under hypoxia with or without bafilomycin A1 (n = 4 experiments). Quantitative data represented as box and whisker plots showing all data points with median and interquartile range and maximum and minimum values. Statistical significance was performed using One-way ANOVA or Kruskal Wallis test with Sidaks’s multiple comparisons test as appropriate. Source data are provided as a Source Data file.
Fig. 3
Fig. 3. OPA1-deficient NP cells show dysregulated bioenergetics.
A, B ECAR and oxygen OCR traces from NP cells transduced with ShCtrl and ShOpa1 in the absence of exogenous glucose and after sequential addition of 10 mM glucose followed by oligomycin and rotenone plus myxothiazol. C Mitochodrial OCR measurement between ShCtrl and ShOpa1 under basal, glucose, and oligomycin addition (D) ATP production rate from glycolytic and oxidative metabolism calculated from traces shown in (A) and (B). E, F ECAR and OCR traces in the absence of exogenous glucose and after sequential addition of 10 mM glucose, followed by rotenone plus myxothiazol, and finally monensin plus FCCP. G Proton production rate (PPR) of NP cells calculated from traces shown in (D) and (E). Data represent 3-4 independent experiments, each with four replicates/group. Data is shown mean ± SEM. t-test or Mann–Whitney two-tailed test or one-way ANOVA was used as appropriate (C, D, G). Source data are provided as a Source Data file.
Fig. 4
Fig. 4. OPA1 is an important regulator of hypoxic NP cell metabolism.
A Unsupervised PCA and B Supervised PLS-DA model of widely targeted small metabolites from NP cells transduced with ShCtrl and ShOpa1. n = 6 independent experiments C Heat map of normalized concentration of metabolites differentially present between ShCtrl and ShOpa1, FDR ≤ 0.05%. D, E Metabolic pathway analysis (MetPA) showing pathway impact and p-value of significantly upregulated and downregulated metabolites. D’, E’ Metabolite set enrichment analysis (MSEA) showing enrichment ratio with p-value of upregulated and downregulated metabolites (FDR < 0.05) from ShOpa1 vs ShCtrl transduced cells. Statistical significance was tested using a t-test or a Mann-Whitney two-tailed test as appropriate. Source data are provided as a Source Data file.
Fig. 5
Fig. 5. OPA1-deficient NP cells evidence altered glucose and glutamine metabolism.
A Summation of flux results through glycolysis, pentose, and TCA cycle using [1,2]-13C-glucose and U13C-glutamine. B–G [1,2]-13C-glucose enrichment in the culture media from NP cells transduced with ShCtrl and ShOpa1 and cultured under hypoxia for 24 h. B Glycolysis flux as measured by enrichment of M2 lactate m/z 91, C Pentose cycle flux as measured by lactate (M1/M2)/ (3 + M1/M2) D PDH flux as measured glutamate m/z 103, E PC flux measured as glutamate m/z 104 F PC + PDH flux measured as glutamate m/z 131, G PDH/PC flux as measured by glutamate m/z 103-M1/104-M2. HO [1,2]-13C-glucose tracing measured from the cell pellets into metabolites (H) alanine m/z 260, I serine m/z 390, J lactate m/z 261, K citrate m/z 591, L succinate m/z 289, M glutamate m/z 432, N palmitate (C16:0) m/z 313, O stearic acid (C18:0) m/z 341. P–W U13C-glutamine tracing measured from NP cells transduced with ShCtrl and ShOpa1 and cultured under hypoxia for 24 h P lactate m/z 261, Q citrate m/z 591, R succinate m/z 289, S fumarate m/z 287, T malate m/z 419, U aspartate m/z 418, V succinate oxidation and W fumarate reduction. Quantitative data are represented as box and whisker plots showing all data points with median and interquartile range and maximum and minimum values. Data points with negative values (undetectable ∑ mn) are not included. Statistical significance was computed using t-test or Mann-Whitney two-tailed test as appropriate. Source data are provided as a Source Data file.
Fig. 6
Fig. 6. Conditional deletion of Opa1 in IVD accelerates age-associated degeneration.
A Schematic showing tamoxifen induced AcanCreERT2 mediated deletion of exons 10-13 of Opa1 to generate Opa1 null allele. B Tamoxifen treatment and analysis timeline of WT (Opa1fl/fl) and Opa1AcanERT2 (Opa1cKO) mice. C RT-PCR analysis shows Opa1 deletion in NP and AF tissues of Opa1cKO mice (n = 3 mice/genotype). D, D’ Western blotting and IHC of OPA1 from NP and AF tissues (n = 2 mice/genotype). E Representative Safranin O/Fast Green/Hematoxylin staining of 20-month-old WT and Opa1cKO caudal disc sections. Scale bar: Top row-500 μm, Bottom rows - 100 μm. E’, E” Modified Thompson Scores of NP and AF compartment of WT and Opa1cKO caudal discs. E”’ Distribution graph showing NP cell phenotype at 20-months. n = 9 WT (4 F, 5 M), 11 Opa1cKO (6 F, 5 M) mice; 3 caudal discs/animal, 27-33 discs/genotype. F, F’ AF tissue hyperplasia in Opa1cKO caudal discs, dotted lines demarcate AF compartment. scale bar = 100 μm. G Representative Picrosirius red stained polarized light images of caudal discs from 20-month-old mice showing NP fibrosis. Scale bar = 500 μm (G’) The distribution of discs based on %NP area occupied by collagen fibers. G” Thin, intermediate, and thick AF collagen fibril fraction. n = 9-11 mice/genotype; 3 caudal discs/animal, 27-33 discs/genotype. H, H’ Representative images of LC3B immunohistology and quantification of LC3B-stained autophagosomes. Scale bar = 10 μm, insert panels 2 and 4 = 20 μm, n = 6-9 mice/genotype: 1-3 caudal discs/animal, 12-24 discs/genotype. Significance for E’, E”’, G’ was determined using a two-sided chi-square test. The significance of the fiber percentage of AF collagen area (G”) was determined using Kruskal-Wallis with Dunn’s test. Quantitative Data represents violin (E”) or box and whiskers (F’, G”, H’) plot showing all data points with median and interquartile range and maximum and minimum values. Significance was determined using an unpaired t-test (F’) or Mann-Whitney two-tailed test (H’). Source data are provided as a Source Data file.
Fig. 7
Fig. 7. The OPA1-deletion affects NP cell phenotype and alters the IVD matrix composition in mice.
Immunohistological staining of 20-month WT and Opa1cKO caudal discs for A carbonic anhydrase 3 (CA3); B glucose transporter 1 (GLUT1) and C collagen 10 (COLX). Scale bar = 100 and 50 μm. Immunohistological staining for D, D’ collagen 1 (COL1); D, D” cartilage oligomeric matrix protein (COMP), E, E’ aggrecan (ACAN); E, E” aggrecan G1 neoepitope (ARGxx). Scale bar = 100 μm. (n = 9 WT (4 F, 5 M), 11 Opa1cKO (6 F, 5 M) mice/genotype, 1-3 discs/mouse, 13-14 discs/genotype/marker). Quantitative measurements are shown as Box and whisker plots showing all data points with median and interquartile range and maximum and minimum values. Significance was determined using an unpaired t-test (D) or Mann-Whitney two-tailed test (D’, E’, E”, E”’), as appropriate.
Fig. 8
Fig. 8. Opa1cKO mice evidence alterations in vertebral bone health and disc height index.
A The representative 3D reconstruction of hemi-section and trabecular lumbar vertebral bone from 7-month, 12-month, and 20-month-old WT and Opa1cKO mice. Scale bars 500 μm. Vertebral trabecular bone parameters B Percent bone volume/ tissue volume (BV/TV) (%), C Bone mineral density (BMD) (g/cm3), D trabecular thickness (Tb.Th) (mm), E trabecular number (Tb.N) (1/mm), F trabecular separation (Tb.Sp) (mm), G structural model index (SMI) of WT and Opa1cKO mice. H Representative 3D reconstruction of transverse section through vertebrae of WT and Opa1cKO mice showing cortical shell geometry and corresponding quantitative parameters I mean total cross-sectional thickness bone area (B.Ar) (mm2), J mean total cross-sectional tissue area (T.Ar) (mm2), K cross-sectional thickness (Cs.Th) (mm), L Tissue mineral density (TMD) (g/cm3). Scale bars 500 μm. M Representative microCT reconstructions of hemi-sections through vertebrae of WT and Opa1cKO mice to determine N Vertebral length (VL) (mm), O disc height (DH) (mm), and P disc height index (DHI). Scale bars 1 mm. Quantitative data are shown as box and whisker plots showing all data points with median and interquartile range and maximum and minimum values. 7-month n = 10 WT (3 F, 7 M), 8 Opa1cKO (3 F, 5 M); 12-month n = 10 WT (6 F, 4 M), 10 Opa1cKO (4 F, 6 M); 20-month n = 9 WT (4 F, 5 M), 11 Opa1cKO (6 F, 5 M), 4 vertebrae and 3 discs/mouse were analyzed. Significance for B-G and I-P was determined using a t-test or a Mann-Whitney two-tailed test as appropriate. Source data are provided as a Source Data file.
Fig. 9
Fig. 9. The loss of OPA1 significantly alters NP tissue metabolic balance.
A WT and Opa1cKO transcriptomic clustering profiles using Principal Component Analysis (PCA). B, C Volcano plot and Hierarchical clustering of differentially expressed genes (DEGs) with FDR < 0.05%. D The CompBio biological map generated from downregulated DEGs FDR < 0.05%. The size of the sphere corresponds to its enrichment score, while the thickness of the lines connecting themes represents the number of genes shared between them. E–K Downregulated themes and related DEGs associated with hypoxia, glycolysis, lysophosphatidic acid (LPA), one-carbon metabolism, procollagen dioxygenase, and autophagy/mitophagy in Opa1cKO mice were shown with CompBio entity score. L–N’ The gene set enrichment analysis (GSEA) of mitochondrial pathways (MitoPathways 3.0) of Opa1cKO downregulated DEGs showing ETC complex IV subunits, OXPHOS and branched chain amino acids metabolism. MitoPathways3.0 was employed to calculate gene set enrichment using the log2 values for pre-ranking the genes and gene set size filters (min=15 and max = 500). A negative enrichment score (ES) indicates gene set enrichment at the bottom of the ranked list. Source data are provided as a Source Data file.
Fig. 10
Fig. 10. Opa1cKO mice evidence synovial hyperplasia and morphological changes in articular cartilage and subchondral bone.
A Representative H&E images (top row 4X; scale bar - 250 μm; bottom row 10X; scale bar − 100 μm) of WT and Opa1cKO mouse joint sections showing medial and lateral compartments of the same joint. Profound synovial hyperplasia and/or ossification is noted in Opa1cKO mice in both the medial and lateral compartments (yellow asterisks), when compared to WT mice B–E Histomorphometric analyses of lateral and medial joint compartments conducted on midcoronal sections of WT and Opa1cKO mouse limbs. B, B’ articular cartilage (Art. cart) area and thickness, C, C’ calcified cartilage (Calc. cart) area and thickness, and D, D’ subchondral bone plate (SCBP) area and thickness E quantitative analysis of synovial hyperplasia. n = 10 WT (4 F, 6 M), n = 11 Opa1cKO (5 F, 6 M). Quantitative data is represented as box and whiskers B–D’ or violin E plots showing all data points with median and interquartile range and maximum and minimum values. Significance for B-E was determined using a t-test or a Mann-Whitney two-tailed test as appropriate. F Schematic showing the in vitro consequences of OPA1-deficiency on mitochondrial and organelle morphology and metabolic functions of NP cells and in vivo phenotypic manifestations of OPA-deletion on the spinal column and knee joint in Opa1cKO mice. Source data are provided as a Source Data file.

Update of

References

    1. Disease, G. B. D., Injury, I. & Prevalence, C. Global, regional, and national incidence, prevalence, and years lived with disability for 354 diseases and injuries for 195 countries and territories, 1990-2017: a systematic analysis for the Global Burden of Disease Study 2017. Lancet392, 1789–1858 (2018). - PMC - PubMed
    1. Madhu, V., Guntur, A. R. & Risbud, M. V. Role of autophagy in intervertebral disc and cartilage function: Implications in health and disease. Matrix Biol.100-101, 207–220 (2021). - PMC - PubMed
    1. Collins, J. A., Diekman, B. O. & Loeser, R. F. Targeting aging for disease modification in osteoarthritis. Curr. Opin. Rheumatol.30, 101–107 (2018). - PMC - PubMed
    1. Merceron, C. et al. Loss of HIF-1alpha in the notochord results in cell death and complete disappearance of the nucleus pulposus. PLoS One9, e110768 (2014). - PMC - PubMed
    1. Madhu, V. et al. The mitophagy receptor BNIP3 is critical for the regulation of metabolic homeostasis and mitochondrial function in the nucleus pulposus cells of the intervertebral disc. Autophagy19, 1821–1843 (2023). - PMC - PubMed

MeSH terms

LinkOut - more resources