. 2025 Jul 1;16(1):5720.
doi: 10.1038/s41467-025-61279-y.

Machine learning-assisted decoding of temporal transcriptional dynamics via fluorescent timer

Affiliations

Machine learning-assisted decoding of temporal transcriptional dynamics via fluorescent timer

Nobuko Irie et al. Nat Commun. .

Abstract

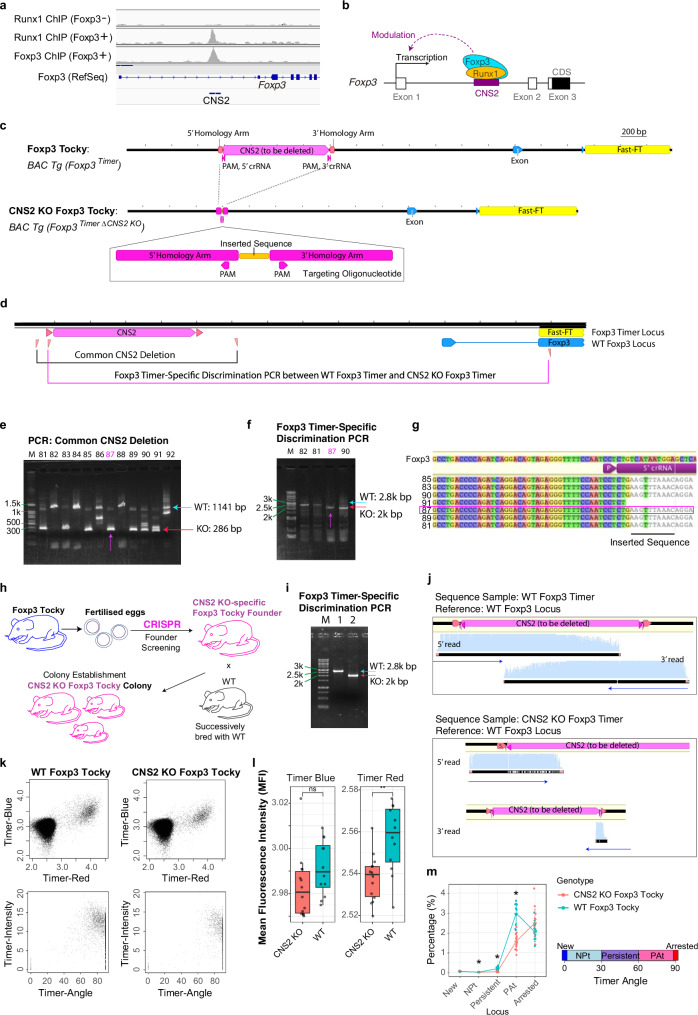
Investigating the temporal dynamics of gene expression is crucial for understanding gene regulation across various biological processes. Using the Fluorescent Timer protein, the Timer-of-cell-kinetics-and-activity system enables analysis of transcriptional dynamics at the single-cell level. However, the complexity of Timer fluorescence data has limited its broader application. Here, we introduce an integrative approach combining molecular biology and machine learning to elucidate Foxp3 transcriptional dynamics through flow cytometric Timer analysis. We have developed a convolutional neural network-based method that incorporates image conversion and class-specific feature visualisation for class-specific feature identification at the single-cell level. Biologically, we developed a novel CRISPR mutant of Foxp3 fluorescent Timer reporter mice lacking the enhancer Conserved Non-coding Sequence 2, which revealed new roles of this enhancer in regulating Foxp3 transcription frequency under specific conditions. Furthermore, analysis of wild-type Foxp3 fluorescent Timer reporter mice at different ages uncovered distinct patterns of Foxp3 expression from neonatal to aged mice, highlighting prominent thymus-like features of neonatal splenic Foxp3+ T cells. In conclusion, our study uncovers previously unrecognised Foxp3 transcriptional dynamics, establishing a proof-of-concept for integrating CRISPR, single-cell dynamics analysis, and machine learning methods as advanced techniques to understand transcriptional dynamics in vivo.


Conflict of interest statement

Competing interests: A patent associated with the ML method in this study has been filed (MO). The remaining authors declare no competing interests.

Figures

Fig. 1
Fig. 1. Research Framework and Overview of Machine Learning Methods.
a Pitfalls and risks in manual gating are schematically presented, highlighting the major pitfalls and risks associated with manual gating, emphasising the hand-drawn nature of the methodology that introduces bias and undermines reproducibility. Unicode emojis for warning and hand symbols are included. b Proposed research framework for Machine Learning (ML)-assisted decoding of transcriptional dynamics. This schematic outlines the comprehensive workflow employed to unravel transcriptional dynamics of Foxp3 within a functional system. It covers the experimental design, generation of independent training and test datasets, training of ML models, performance evaluation, and data-driven identification of group-specific feature cells through model behaviour analysis. The protein structure is adapted from. c Implementation of the research framework as TockyMachineLearning, a novel machine learning suite designed for this study. Data preprocessing, performed by TockyPrep, normalises and transforms flow cytometric Timer data into standardised Timer Angle and Timer Intensity data. This pre-processed data then feeds into the TockyMachineLearning toolkit. Within this toolkit, TockyKmeansRF combines k-means clustering with Random Forest (RF) analysis, utilising the mean decrease Gini index to identify feature cells. TockyConvNet transforms Timer Angle and Intensity data into 2D grayscale images representing cell density. These images are batch-processed by ConvNet, with model behaviours monitored using Grad-CAM to enable identification of feature cells at the single-cell level.
Fig. 2
Fig. 2. Development of the CRISPR-mediated CNS2 KO Foxp3-Tocky Mouse Model.
a ChIP-seq profiles showing aligned sequence reads for Runx1 and Foxp3 binding in Foxp3+ and Foxp3 − CD4 + T cells. b Working model of CNS2-dependent Foxp3 transcriptional regulation by Runx1 and Foxp3. c CRISPR-Cas9 strategy for CNS2 deletion within the Foxp3-Timer locus, showing the targeting oligonucleotide design. d Two PCR-based genotyping approaches: one detects CNS2 deletion in both endogenous and transgenic Foxp3 loci; the other discriminates WT and CNS2 KO Foxp3-Timer alleles. Screening of founder mice using e Common CNS2 Deletion PCR and f Foxp3 Timer-specific PCR. Screening was performed once during founder selection following embryonic injections. g Sanger sequencing confirming deletion in founder mice. h Breeding strategy illustrating how CNS2 KO Foxp3-Tocky mice were successively bred with WT animals over several generations to establish a stable mouse colony while ensuring that the endogenous Foxp3 gene remains free from mutations. i Established genotyping PCR for discriminating CNS2 KO Foxp3-Tocky and WT Foxp3-Tocky mice; representative result from >3 independent tests. j Sanger sequencing to validate specificity of the Foxp3 Timer-specific PCR shown in h. k Representative flow cytometric plots of Timer Blue vs. Timer Red and Timer Angle vs. Intensity for WT and CNS2 KO Foxp3-Tocky mice. l Box plots showing MFI of Timer Blue and Timer Red fluorescence in CD4+ T cells. The box represents the interquartile range (IQR; 25th–75th percentile), showing the median, and whiskers up to 1.5× IQR from the box. Statistical significance was assessed using a two-sided Student’s t-test (p  <  0.01). Exact p-values: Timer Red = 0.004; Timer Blue = 0.053. n  =  14 KO and 12 WT samples. m Percentage of cells within each Timer locus in CD4 + T cells from superficial lymph nodes. Locus definitions: New (0˚), NPt (0˚–30˚), Persistent (30˚–60˚), PAt (60˚–90˚), Arrested (90˚). Error bars show standard deviations. Two-sided Mann–Whitney test with p-value adjustment used. Adjusted p-values for Tocky loci: Persistent = 2.1 × 10-6, PAt = 6.2 × 10-6, Arrested = 1.3 × 10-2. n  =  14 KO and 12 WT samples.
Fig. 3
Fig. 3. TockyKmeansRF: Combinatorial analysis using clustering and random forest.
a Schematic overview of the TockyKmeansRF framework combining k-means clustering and Random Forest (RF) classification to model Timer fluorescence in flow cytometry data. b Training and test datasets generated from lymph node samples of WT and CNS2 KO Foxp3-Tocky mice. c Area Under the Curve (AUC) analysis of model performance across varying numbers of clusters (top) and RF trees (bottom). d Visualisation of CNS2-dependent feature clusters in the test dataset. Timer Angle–Intensity and original Timer fluorescence spaces are shown. Top: feature importance by Mean Decrease Gini (MDG); bottom: feature cells defined as top 60th percentile by MDG. e Density-based clustering of feature cells. f Violin plots showing kernel density estimates of the percentage of cells in each cluster per sample (n  =  22 KO, 27 WT). Each point represents a biological replicate. The box indicates the interquartile range (IQR; 25th–75th percentile), the centre line denotes the median, and whiskers extend to the most extreme values within 1.5× IQR; outliers beyond this are plotted. Samples lacking cells in Cluster 3 (KO) were excluded from that cluster’s plot. g Violin plots showing mean fluorescence intensity (MFI) of CD25, CD44, PD-1, and CD69 for two identified clusters and remaining Timer+ cells (“others”) in WT samples (n  =  27). Statistical analysis used the Kruskal-Wallis test followed by Dunn’s test with Bonferroni correction. Timer-negative cells were included only as a baseline reference and excluded from statistical testing. The box shows the IQR, the centre line indicates the median, and whiskers extend to the most extreme values within 1.5× IQR. Exact p-values are provided in Supplementary Data 1. h Computational performance of TockyKmeansRF, showing runtime and memory usage with progressively increased CNS2 KO training data.
Fig. 4
Fig. 4. TockyConvNet: Deep learning-based analysis via image conversion and gradient mapping.
a Schematic of the image conversion process applied to Timer fluorescence data. b Representative dot plots (left) and pseudocolour images (right) after conversion. c Architecture of the TockyConvNet model, comprising four convolutional layers used for Gradient-weighted Class Activation Mapping (Grad-CAM) shown in g, h. d Learning curve from three-fold cross-validation. Receiver Operator Characteristics (ROC) e and Precision–Recall f analyses for benchmarking TockyConvNet with manual gating strategies. Differential Grad-CAM heatmaps for WT vs. CNS2 KO samples across convolutional layers, shown in Timer Angle-Intensity g and Timer Blue-Red h spaces. Colour range is normalised per panel. Violin plots showing kernel density estimates of CNS2 feature cell percentages in WT (i; top 90th percentile) and KO (j; bottom 10th percentile) based on differential Grad-CAM maps. Each point represents a biological replicate. Statistical analysis used the two-sided Mann–Whitney test; **p  <  0.01, ****p  <  0.001. The box shows the interquartile range (25th–75th percentile), centre line indicates the median, and whiskers extend to the most extreme values within 1.5× IQR. n  =  22 KO and 27 WT samples. Exact p-values are in Supplementary Data 1. k Violin plots of mean fluorescence intensity (MFI) for indicated markers in WT feature cells, other Timer-positive and -negative cells in WT samples (n  =  27). Statistical significance was assessed using the Kruskal-Wallis test with Dunn’s post-hoc test (Bonferroni correction); **p  <  0.01, ***p  <  0.005, ****p  <  0.001. Timer-negative cells were included for reference only and not in statistical testing. Box and whisker definitions as above. Exact p-values are in Supplementary Data 1.
Fig. 5
Fig. 5. Gene Expression Analysis of CNS2-Dependent Feature Cells by Cross-Analysis of Grad-CAM Output from TockyConvNet and RNA-seq Data.
a Timer expression profile (Upper) and Timer Angle and Intensity profile (Lower) of pre-sort CD4+ T cells and fractionated Foxp3 Timer+ cells from WT Foxp3 Timer mice. b Grad-CAM heatmap using the TockyConvNet, trained as shown in Fig. 4, applied to RNA-seq flow cytometric data. (Upper) Visualisation of WT feature analysed via Attention-Conv2 Grad-CAM, highlighted by red on heatmap (Upper); (Lower) KO feature cells visualised through Conv2 Grad-CAM, highlighted with a blue on heatmap. Colour range is normalised per panel. c Bar charts showing the percentage of WT feature cells (i.e. CNS2-dependent cells, left) and KO feature cells (i.e. CNS2-independent cells, right) in pre-sort CD4+ T cells and fractionated Foxp3 Timer+ cells. Error bars indicate standard deviations. n  = 3 biological replicates. Expression dynamics of key genes in fractionated Foxp3 Timer+ cells: d transcription factors downstream of TCR signalling; e genes associated with IL-2 and TGF-β signalling, along with prototypic upstream and downstream Foxp3 genes. p-values were obtained by two-sided Wald tests of the R package DESeq2 and adjusted by the Benjamini & Hochberg method. Asterisks indicate statistical significance (adjusted p-value < 0.05) and shown for comparisons involving B2 only. Error bars indicate standard deviations. n  = 3 biological replicates. Exact p-values are provided in Supplementary Data 1.
Fig. 6
Fig. 6. Generation of Foxp3 Timer Neonatal-to-Ageing Benchmarking Data across developmental and ageing stages in WT Foxp3-Tocky mice.
a Timer Blue and Timer Red expression in CD4 + T cells from the thymus and spleen of WT Foxp3 Timer mice at various ages. All samples within the training dataset were concatenated per group and shown as pseudocolour plots. Days and weeks since birth are indicated. b Normalised Timer fluorescence data from the flow cytometric analysis in a. c Timer Angle and Intensity transformed from the normalised Timer fluorescence data in b. d Percentage of CD4+ T cells in each of the indicated gates or the mean Timer Angle. e Percentage of mean Timer Angle plotted against logarithmically transformed age, with axis labels indicating actual age in days. Each line represents a quadratic regression model for each organ’s data. Shaded areas indicate 95% confidence intervals around the fitted regression lines.
Fig. 7
Fig. 7. Development of the TockyConvNet for Quantitative Assessment of Thymus and Spleen Characteristics in Foxp3 Transcriptional Dynamics.
a Diagram of the ConvNet architecture for the age-adjusted TockyConvNet classifier and continuous score models. b ROC and Precision-Recall curve analysis using the TockyConvNet classifier. c Thymus-Spleen Continuous Score data from the TockyConvNet continuous score model analysing an independent test dataset, using linear age values (left) and log2-transformed age values (right).
Fig. 8
Fig. 8. Optimising and Benchmarking of the TockyConvNet Four-Class Classifier.
a Diagram of the 3 Conv-Layer TockyConvNet architecture as a four-class classifier for classifying the two organs (Spleen vs. Thymus) and stratified ages (Young [<30 days old]; vs. Aged ( > 30 days old)). b Optimisation of the TockyConvNet architecture, comparing models with one, two, and three convolutional layer blocks by ROC and Precision-Recall curve analysis. c Benchmarking results of TockyConvNet against other methods including TockyKmeansRF and manual gating strategies in differentiating the four classes using ROC (left) and Precision-Recall curves (right). The data generated in Fig. 6 were used.
Fig. 9
Fig. 9. Optimising Grad-CAM method for analysing Foxp3 timer dynamics.
a Heatmaps of Grad-CAM for each convolutional layer, visualising pixels used for discriminating each indicated class. Colour range is normalised per panel. b ROC curves showing class-discriminative capacity of each of the convolutional layers by Grad-CAM. c Heatmap visualisation of the Grad-CAM outputs for each class in both Timer Angle and Intensity space, and original Timer fluorescence space. Colour range is normalised per panel.

Similar articles

References

    1. Petropoulos, S. et al. Single-Cell RNA-Seq Reveals Lineage and X Chromosome Dynamics in Human Preimplantation Embryos. Cell165, 1012–1026 (2016). - PMC - PubMed
    1. Treutlein, B. et al. Dissecting direct reprogramming from fibroblast to neuron using single-cell RNA-seq. Nature534, 391–395 (2016). - PMC - PubMed
    1. Park, J. E. et al. A cell atlas of human thymic development defines T cell repertoire formation. Science367 (2020). - PMC - PubMed
    1. Bradley, A., Hashimoto, T. & Ono, M. Elucidating T cell activation-dependent mechanisms for bifurcation of regulatory and effector T cell differentiation by multidimensional and single-cell analysis. Front. Immunol.9, 1444 (2018). - PMC - PubMed
    1. Tan, B. J. Y. et al. HTLV-1 infection promotes excessive T cell activation and transformation into adult T cell leukemia/lymphoma. J. Clin. Invest.131, e150472 (2021). - PMC - PubMed

Substances

LinkOut - more resources