. 2025 Jul 1;16(1):5546.
doi: 10.1038/s41467-025-60820-3.

Binge drinking triggers VGLUT3-mediated glutamate secretion and subsequent hepatic inflammation by activating mGluR5/NOX2 in Kupffer cells

Affiliations

Binge drinking triggers VGLUT3-mediated glutamate secretion and subsequent hepatic inflammation by activating mGluR5/NOX2 in Kupffer cells

Keungmo Yang et al. Nat Commun. .

Abstract

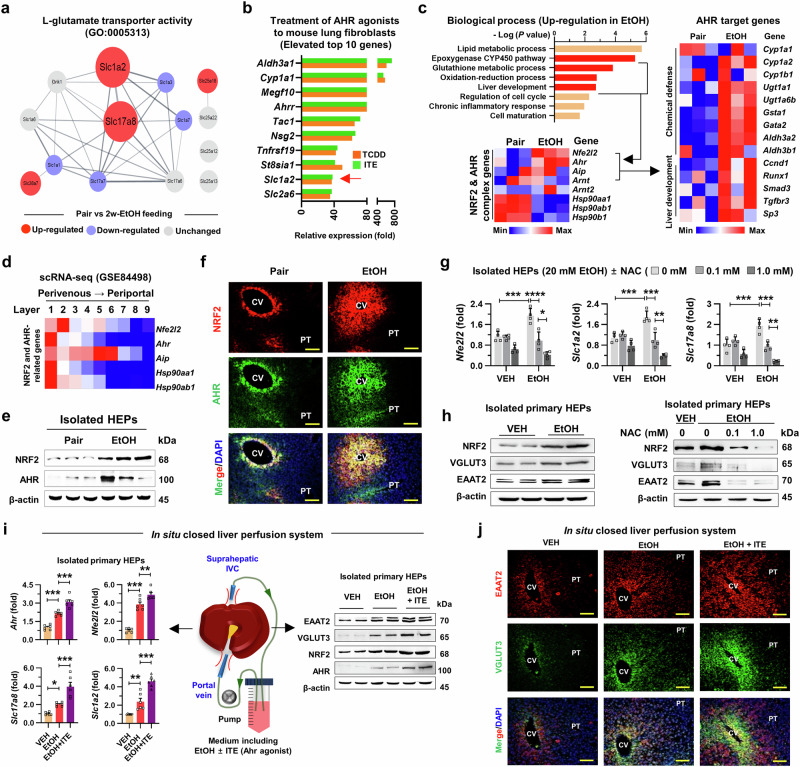
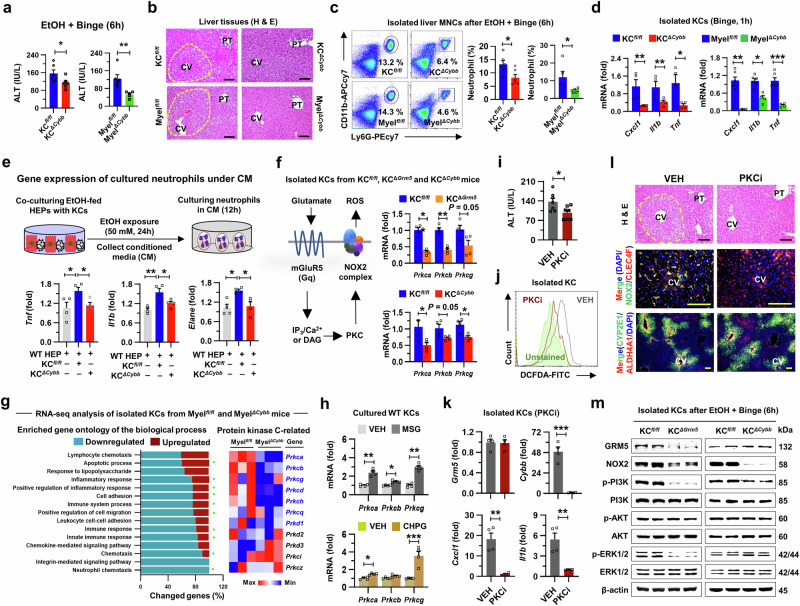
Glutamate, a crucial player in hepatic amino acid metabolism, has been relatively unexplored in immune cell activation. We show in a study with male mice that hepatic glutamate accumulates in vesicles of perivenous hepatocytes through vesicular glutamate transporter 3 (VGLUT3), regulated by the aryl hydrocarbon receptor upon chronic alcohol intake. Additional binge drinking triggers the exocytosis of glutamate by altering the intracellular Ca2+ level, stimulating metabotropic glutamate receptor 5 (mGluR5) and subsequent NADPH oxidase 2 (NOX2)-mediated ROS production in Kupffer cells (KCs). This interaction between hepatocytes and KCs is facilitated by pseudosynapse formation, arising from alcohol-induced ballooning of perivenous hepatocytes. Genetic or pharmacological interference of mGluR5 or NOX2 in KCs alleviates alcohol-related steatohepatitis (ASH). Analysis of patient samples confirmed some of the findings from mice, showing that plasma glutamate concentration and VGLUT3 levels correlate with ASH development. Conclusively, our findings highlight glutamate storage and release in mediating ASH, particularly through the pseudosynapse between hepatocytes and KCs.


Conflict of interest statement

Competing interests: The authors declare no competing interests.

Figures

Fig. 1
Fig. 1. Kupffer cells play a pivotal role in the early injury of alcohol-related steatohepatitis.
a Schematic representation of different ethanol (EtOH) treatments applied to WT mice and hepatocytes (HEPs). b Measurement of ALT in the cultured media of HEPs treated with EtOH for 6 h (left, n = 3/group). Serum ALT and EtOH levels from in vivo experiments (right, n = 6/group). cg Analysis parameters in time-course tracing of acute on chronic EtOH-fed mice, comparing each timepoint after binge alcohol administration relative to the EtOH only (0 h). c Evaluation of serum ALT, AST, and TG in mice with a 2-week EtOH diet plus binge drinking (n = 4/group). d Representative staining of liver sections with H&E solutions and antibodies of Ki-67, MPO and CLEC4F. Scale bar, 50 μm. e Bar and linear graphs or flow cytometry panels showing frequencies of liver mononuclear cells (MNCs) and neutrophils in liver (n = 4/group). f Quantification of the number of CLEC4F+ Kupffer cells (KCs) per HEPs by immunostaining (n = 12/group), as well as their frequency in flow cytometry and counts per liver weight (n = 4/group). g mRNA expression of Cxcl1 and Ccl2 in isolated HEPs and Cxcl1 (n = 5/group), Il1b, Il6, Cybb, and Grm5 in isolated KCs (n = 4/group). Statistical comparisons were made using one-way ANOVA with Tukey’s multiple comparisons. Data are presented as mean ± SEM. *p < 0.05, **p < 0.01, ***p < 0.001. Source data are provided as a Source Data file.
Fig. 2
Fig. 2. Glutamate accumulation in perivenous hepatocytes through vesicular glutamate transporter 3 after 2-week EtOH intake and its release by binge drinking.
a Glutamate concentrations in serum and liver from Pair-fed and EtOH-fed WT mice with/without binge drinking (n = 8/group). b RNA-sequencing analysis of the whole liver tissues from WT mice fed with isocaloric (Pair) or EtOH diet for 2 weeks (n = 3/group). Graphical representation and heatmaps about pathways of glutamate production and transportation. c Relative mRNA expression of glutamate transporters according to the liver zonation in single-cell RNA (scRNA)-sequencing of WT mouse HEPs (GSE84498). d Representative immunofluorescence staining of VGLUT3, EAAT2, OAT, and ALDH4A1 in liver sections merged with DAPI. Central vein (CV) and portal triad (PT). Scale bar, 50 μm. e Western blot analysis in isolated HEPs from WT mice. f Relative mRNA expression of Aldh4a1, Oat, Slc1a2, and Slc17a8 in the whole liver tissues from EtOH-fed mice and EtOH-treated HEPs compared to control (n = 4/group). g Immunostaining of VGLUT3 after liver tissue expansion by the epitope-preserving magnified analysis of proteome protocol. Scale bar, 100 μm. h Schematic protocol of isolating microvesicles (MVs) by stepwise centrifugation. i, j Representative Western blot analysis and glutamate concentrations in isolated MVs from Pair- or EtOH-fed WT mice (n = 6/group). Statistical comparisons were made using one-way ANOVA with Tukey’s multiple comparisons test (a) or two-tailed unpaired t-test (f, j). p  <  0.05 was considered statistically significant. Data are presented as mean ± SEM. *p < 0.05, **p < 0.01, ***p < 0.001. Source data are provided as a Source Data file.
Fig. 3
Fig. 3. VGLUT3 and EAAT2 are regulated with NRF2-AHR pathway in the ethanol-fed mice.
a Protein-protein interactions of L-glutamate transporter activity (GO:0005313) in bulk RNA-seq data of mouse livers through the STRING database. b Top 10 up-regulated genes stimulated by AHR agonists (TCDD, ITE) in mouse lung fibroblast, re-analyzed using public microarray data. c mRNA expression of NRF2 and AHR-related genes and AHR target genes from RNA-seq analysis of WT mice fed with Pair or EtOH diet for 2 weeks (n = 3/group). d Relative mRNA expression of AHR-related genes according to liver zonation in scRNA-seq of WT mouse liver (GSE84498). e Western blot of NRF2 and AHR in isolated HEPs. f Representative immunofluorescent staining of AHR and NRF2 in liver sections. Scale bar, 50 μm. g, h mRNA expression of Nfe2l2, Slc1a2, and Slc17a8 in freshly isolated HEPs treated with 20 mM EtOH and N-acetyl-L-cysteine (NAC) for 24 h (g, n = 4/group), along with their Western blot analysis of NRF2, VGLUT3, and EAAT2. i In situ closed liver perfusion performed with VEH, 100 mM EtOH, or 1 μM AHR agonist (ITE) containing media in WT mice (2 h). Relative mRNA (n = 6/group) and protein levels of Ahr (AHR), Nfe2l2 (NRF2), Slc17a8 (VGLUT3), and Slc1a2 (EAAT2) in isolated HEPs. j Representative immunofluorescence staining of VGLUT3 and EAAT2 in liver after in situ closed perfusion. Scale bar, 50 μm. Statistical comparisons were made using one-way ANOVA with Tukey’s multiple comparisons test. Data are presented as mean ± SEM. *p < 0.05, **p < 0.01, ***p < 0.001. Source data are provided as a Source Data file.
Fig. 4
Fig. 4. Binge drinking rapidly alters the intracellular calcium levels to release glutamates and activate mGluR5 of Kupffer cells.
a A schematic figure of Ca2+ channels and transporters in HEPs. Heatmaps of genes in Pair and EtOH group (n = 3/group). b Representative intravital liver imaging stained with Fluo-4 AM and lectin. Statistical analysis of Fluo-4 AM-positive cells per image field (n = 4/group). Scale bar, 100 μm. c Heatmaps showing relative mRNA expression of SNARE complex-related genes analyzed by RNA-sequencing before and after binge drinking in EtOH-fed mice (n = 3/group). d Glutamate concentration in the supernatant after in vitro additional EtOH treatment of HEPs isolated from 2-week Pair-fed and EtOH-fed mice (n = 3/group). e Flow cytometry analyses of mGluR5 expression and ROS generation in isolated KCs. f ROS generation and gene expression of Grm5, Cybb, and Cxcl1 in KCs treated with mGluR5 selective agonist (CHPG) or monosodium glutamate (MSG) compared to vehicle (n = 4/group). g Size distribution analysis of HEPs isolated from Pair- or EtOH-fed mice. Bar graph shows the average diameter of HEPs in each group (n = 6/group). h Transmission electron microscopy in liver section fed with Pair or EtOH diet for 2 weeks. Bar graph indicates the average distance between adjacent hepatocytes (HEPs) and Kupffer cells (KCs), measured across multiple cell pairs per mouse (n = 12 HEP–KC pairs/group). Scale bar, 5 μm. i Co-culturing of KCs directly or indirectly with HEPs isolated from EtOH-fed mice, followed by treatment with 50 mM EtOH for 6 h. Relative mRNA expression of Cybb, and Il1b in isolated KCs (n = 6/group). LDH was measured in the supernatant (n = 4/group). Statistical comparisons were made using one-way ANOVA with Tukey’s multiple comparisons test (b, i), and multiple comparisons by two-stage step-up method of Benjamini, Krieger and Yekutieli. F (d), or two-tailed unpaired t-test (fh). Data are presented as mean ± SEM. *p < 0.05, **p < 0.01, ***p < 0.001. Source data are provided as a Source Data file.
Fig. 5
Fig. 5. Genetic or pharmacologic inhibition of mGluR5 in Kupffer cells attenuates alcohol-related liver injury in mice.
a Measurement of serum ALT, AST, TG, and glutamate levels in KCfl/fl and KC-specific mGluR5 knockout mice (KCΔGrm5) fed with 2-week EtOH plus binge drinking (n = 6/group). b Representative flow cytometry panels and bar graphs indicate frequencies of the neutrophils, macrophages, and eosinophils of liver MNCs from KCΔGrm5 mice compared to KCfl/fl (n = 6/group). c Representative H & E and immunostaining of ALDH4A1 and CYP2E1 in liver sections from KCfl/fl and KCΔGrm5 mice. Scale bar, 50 μm. d Relative mRNA expression of Cxcl1, Ccl2, Il1b, and Cybb in isolated KCs from KCfl/fl and KCΔGrm5 mice (n = 4/group). e ROS generation in isolated KCs from KCfl/fl and KCΔGrm5 mice (n = 4/group). f Protocol schematic of in vitro co-culture system of HEPs and KCs. Measurement of glutamate (n = 4/group) and LDH in co-culture media (n = 3/group). g Relative mRNA expression of Cxcl1 and Cybb in co-cultured KCs (n = 4/group). h Measurement of serum ALT, AST, TG, and glutamate levels following intraperitoneal injection of VEH or mGluR5 antagonist (MPEP; 10 mg/kg) for three consecutive days prior to sacrifice (n = 5/group). i Representative H&E stains in liver sections. Scale bar, 50 μm. j ROS generation in isolated KCs from VEH or MPEP-treated mice. k Relative mRNA expression related to inflammatory response in isolated KCs (n = 4/group) from MPEP-treated mice. Statistical comparisons were made using one-way ANOVA with Tukey’s multiple comparisons test (f) or two-tailed unpaired t-test (a, b, d, g, h, k). Data are presented as mean ± SEM. *p < 0.05, **p < 0.01, ***p < 0.001.
Fig. 6
Fig. 6. mGluR5-induced NOX2 activation in Kupffer cells occurs via a PKC-dependent pathway.
a Measurement of serum ALT levels in KC from myeloid cell-specific Cybb knockout mice (KCΔCybb and MyelΔCybb) fed with 2-week EtOH plus binge drinking (n = 6/group). b Representative H&E stains in liver sections. Scale bar, 50 μm. c Representative flow cytometry panels (left) and bar graphs (right) showing frequencies of neutrophils in liver MNCs from Cybb knockout mice (KCΔCybb and MyelΔCybb) compared to floxed mice (n = 6/group). d mRNA expression levels of Cxcl1, Il1b and Tnf in isolated KCs (n = 4/group). e Generation of conditioned media (CM) by co-culturing WT HEPs with KCΔfl/fl or KC ΔCybb with 50 mM EtOH for 24 h, followed by culturing isolated neutrophils with CM for 12 h and analyzing Tnf, Il1b, and Elane mRNA expression (n = 4/group). f Relative mRNA expressions of Prkca, Prkcb, and Prckg in isolated KCs from KCΔCybb and KCΔGrm5 mice (n = 4/group). g Gene ontology analysis and mRNA expression of protein kinase C (PKC)-related genes in KCs from Myelfl/fl and MyelΔCybb mice. Green dots indicate the PKC-related gene sets. h mRNA expression of Prkca, Prkcb, and Prckg in isolated KCs treated with 100 μM MSG (30 min) or 10 μM CHPG (10 min) (n = 4 /group). i Measurement of ALT levels following intraperitoneal injection of VEH or PKC inhibitor (PKCi; chelerythrine chloride; 10 mg/kg) for 3 consecutive days before sacrifice (n = 7/group). j, k Representative of ROS generation and mRNA expression in isolated KCs from VEH or PKCi-treated mice (n = 4/group). l H&E and immunostaining of ALDH4A1 and CYP2E1 in liver sections. Scale bar, 50 μm. m Western blot analysis for the downstream signaling pathways of mGluR5 in isolated KCs from KCfl/fl, KCΔGrm5, and KCΔCybb mice. Statistical comparisons were made using one-way ANOVA with Tukey’s multiple comparisons test (e), multiple comparison by two-stage step-up method of Benjamini, Krieger and Yekutieli. F (d, f, h), or unpaired t-test (a, c, i, k). Data are presented as mean ± SEM. *p < 0.05, **p < 0.01, ***p < 0.001. Source data are provided as a Source Data file.
Fig. 7
Fig. 7. Levels of blood glutamate and hepatic SLC17A8 mRNA have a positive correlation with the inflammatory response in ALD patients without liver cirrhosis.
a Strategy for classifying patients with alcohol-related liver disease (ALD) involved in the study. Plasma glutamate levels were measured in ALD patients (n = 16) with and without alcohol-related steatohepatitis (ASH). b Correlative analysis of plasma glutamate levels with AST, ALT, GGT, steatosis grade, and ductular proliferation in ALD patients without liver cirrhosis (LC) (n = 16). Correlations were assessed by linear regression model. c Representative H&E and immunostaining of CYP2E1, NRF2, AHR, EAAT2, and VGLUT3 in control, alcohol-related fatty liver (AFL), and ASH patients. Scale bar, 50 μm. d Relative mRNA expression of SLC17A8 (n = 3/group), SLC1A2, AHR, and NFE2L2 in isolated human hepatocytes (hHEPs) treated with 20 mM EtOH for 24 h (n = 6/group). e Relative mRNA expression of GRM5, CYBB, PRKCA, and PRKCB in isolated human Kupffer cells (hKCs) treated with 10 μM CHPG for 10 min (n = 3/group). Statistical comparisons were made using two-tailed unpaired t-test. Data are presented as mean ± SEM. *p < 0.05, **p < 0.01, ***p < 0.001. Source data are provided as a Source Data file.

Similar articles

References

    1. Seitz, H. K. et al. Alcoholic liver disease. Nat. Rev. Dis. Prim.4, 16 (2018). - PubMed
    1. Singal, A. K. & Mathurin, P. Diagnosis and treatment of alcohol-associated liver disease: a review. JAMA326, 165–176 (2021). - PubMed
    1. Lucey, M. R., Mathurin, P. & Morgan, T. R. Alcoholic hepatitis. N. Engl. J. Med.360, 2758–2769 (2009). - PubMed
    1. Krenkel, O. & Tacke, F. Liver macrophages in tissue homeostasis and disease. Nat. Rev. Immunol.17, 306–321 (2017). - PubMed
    1. Smedsrod, B. et al. Cell biology of liver endothelial and Kupffer cells. Gut35, 1509–1516 (1994). - PMC - PubMed

MeSH terms

LinkOut - more resources