. 2025 Jul 1;16(1):5878.
doi: 10.1038/s41467-025-61142-0.

Bridging cell morphological behaviors and molecular dynamics in multi-modal spatial omics with MorphLink

Affiliations

Bridging cell morphological behaviors and molecular dynamics in multi-modal spatial omics with MorphLink

Jing Huang et al. Nat Commun. .

Abstract

Multi-modal spatial omics data are invaluable for exploring complex cellular behaviors in diseases from both morphological and molecular perspectives. Current analytical methods primarily focus on clustering and classification, and do not adequately examine the relationship between cell morphology and molecular dynamics. Here, we present MorphLink, a framework designed to systematically identify disease-related morphological-molecular interplays. MorphLink has been evaluated across a wide array of datasets, showcasing its effectiveness in extracting and linking interpretable morphological features with various molecular measurements in spatial omics analyses. These linkages provide a transparent view of cellular behavior heterogeneity within tissue regions with similar cell type compositions, characterizing tumor subtypes and immune diversity across different organs. Additionally, MorphLink is scalable and robust against cross-sample batch effects, making it an efficient method for integrative spatial omics data analysis across samples, cohorts, and modalities, and enhancing the interpretation of results for large-scale studies.


Conflict of interest statement

Competing interests: This study was supported by start-up research funds from the Department of Human Genetics, School of Medicine at Emory University. The authors declare no competing interests.

Figures

Fig. 1
Fig. 1. Workflow of MorphLink.
a MorphLink starts by extracting image patches from the H&E image, then employs an unsupervised, spatially aware approach to segment each patch into multiple masks. Each mask represents a type of tissue structure, and object detection is further performed. Both mask-level and object-level summary statistics are calculated to generate interpretable image features. b MorphLink quantifies the pattern similarity between morphological and molecular features by initially partitioning the tissue into subregions. Within each subregion, it calculates gradient curves along the X and Y directions to summarize the patterns of both features. The Curve-based Pattern Similarity Index (CPSI) is then computed based on these regional curves. Next, MorphLink samples patches to visually illustrate the dynamic changes in cell morphology and gene expression.
Fig. 2
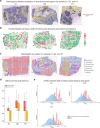
Fig. 2. MorphLink associates nuclei and CAF morphology with gene expression to characterize tumor heterogeneity in human bladder cancer.
a Pathologist’s annotations at the spot level overlaid on the H&E image. b The selected tumor region is further divided into two subregions by spatial clustering using gene expression. c The expression patterns of CD74 (value range 0–2.708) and MYCL (value range: 0–2.708) in selected tumor regions. d Boxplot of the area proportion of 8 identified masks within patches in tumor regions. The lower and upper hinges correspond to the first and third quartiles, and the center refers to the median value. The upper (lower) whiskers extend from the hinge to the largest (smallest) value no further (at most) than the 1.5× interquartile range from the hinge. Data beyond the end of the whiskers is plotted individually. e H&E patches of two spots, with two corresponding segmented masks for nuclei and CAF; object detection is subsequently performed within each mask. f A morphological feature from MorphLink that quantifies the IQR of solidity for nuclei. g Distribution of CPSIs between 35 antigen-presenting genes and target nuclei solidity image feature (red), compared to that between the same set of genes and other nuclei image features (blue). h A visual illustration of the linkage between CD74 expression and IQR of solidity for nuclei in H&E image and detected objects. The values are median image feature values for spots stratified by CD74’s expression level, grouped into quantiles from 0 to 1 with a step of 0.25. i A morphological feature from MorphLink that quantifies the area of CAFs. j Distribution of CPSIs between 46 tumor proliferation-related genes and target area of CAFs image feature (red), compared to that between the same set of genes and other CAF image features (blue). k A visual illustration of linkages between MYCL expression and area of CAFs in H&E image and segmented mask. The values are median image feature values for spots stratified by MYCL’s expression level, grouped into quantiles from 0 to 1 with a step of 0.25.
Fig. 3
Fig. 3. MorphLink associates lymphocyte organization with gene expression to characterize immune diversity in human bladder cancer.
a Tertiary lymphoid structures (TLS) and diffuse tumor-infiltrating lymphocytes (TIL) annotation on spot-level and H&E image from the pathologist. b The expression of IGHM (value range: 0–2.565) at lymphocyte-enriched regions. c Boxplot of the area proportion of 8 identified masks within patches in lymphocyte-enriched regions. Boxplot hinges, median, and whiskers are defined the same as in Fig. 2d. d A morphological feature that measures the largest cluster size of lymphoid nuclei aggregation shows high CPSIs with all TLS-enriched genes. e Distribution of CPSIs between 28 TLS-enriched genes and target nuclei aggregation area image feature (red), compared to that between the same set of genes and other nuclei image features (blue). f A visual illustration depicting how the organization of limnophytes differs between TLS and diffused TIL in H&E images and detected nuclei.
Fig. 4
Fig. 4. Applying MorphLink to multi-sample human breast cancer data.
a Cellular-level stroma regions annotated by the pathologist. b Overlay of the extracted morphology feature (IQR of stroma pixel distance) with the pathologist-annotated stroma regions. The value ranges of the target morphology feature in the A1, G2, and H1 samples are 0−1.907, 0−2.548, and 0−2.668, respectively. c The manual annotations of tissue regions for samples A1, G2, and H1 by the original study. d Boxplot comparing the morphology feature values in invasive cancer compared to cancer in situ across three samples (A1: n = 282, 21; G2: n = 140, 20; H1: n = 90, 97). Boxplot hinges, median, and whiskers are defined the same as in Fig. 2d. e Distribution of CPSIs between the top 50 invasive cancer-enriched genes and target morphology feature (red), compared to that between the same morphology feature and other remaining genes (blue) across three samples.
Fig. 5
Fig. 5. MorphLink links nuclei orientation with gene expression to characterize neuronal cell development in mouse brain data.
a The H&E image of the mouse brain region. b The entire tissue region is separated into three subregions by spatial clustering using gene expression. c The gene expression pattern of NRN1 in subregion 1 (value range: 0–5.631). d Boxplot of the area proportion of 4 identified masks within patches in subregion 1. Boxplot hinges, median, and whiskers are defined the same as in Fig. 2d. e A morphological feature from MorphLink quantifies the IQR of nuclei orientation (value range: 0–2.632). f Distribution of CPSIs between 30 neuron development genes and target nuclei orientation image feature (red), compared to that between the same set of genes and other nuclei image features (blue). g A visual illustration of how neuronal cell orientation changes in H&E image and detected objects, showing a shift from the same direction to diverse directions as NRN1 expression level increases.
Fig. 6
Fig. 6. MorphLink characterizes the morphology-molecular relationship at the tumor/muscle interface.
a The H&E image of the tissue section, with the blurred region outlined by a red dashed line. b Manual annotations of the tissue section from the original study. c Spatial domains were detected using image features derived from HIPT, Ciga et al., and MorphLink. d Expression patterns of RPL5B (value range: 0–3.367), TUBA8L (value range: 0–2.485), and PPIAA (value range: 0–3.892) in the muscle region. e. Boxplot of the area proportion of 5 identified masks within patches in muscle regions. Boxplot hinges, median, and whiskers are defined the same as Fig. 2d. f A morphological feature that quantifies the 75th quantile of the fiber bundle area shows the highest CPSIs with RPL5B (0.757), TUBA8L (0.743), and PPIAA (0.747). The value for the target morphology feature is 0–8.628. g Distribution of CPSIs between 8 genes and target fiber bundle area image feature (red), compared to that between the same set of genes and other fiber image features (blue). h A visual illustration of muscle fascicle size changes associated with RPL5B expression in H&E image, segmented mask, and detected objects. The values are median image feature values for spot stratified by RPL5B’s expression level, grouped into quantiles from 0 to 1 with a step of 0.25.

Update of

References

    1. Fitzgibbons, P. L. et al. Prognostic factors in breast cancer: College of American Pathologists consensus statement 1999. Arch. Pathol. Lab. Med.124, 966–978 (2000). - PubMed
    1. Ash, J. T. et al. Joint analysis of expression levels and histological images identifies genes associated with tissue morphology. Nat. Commun.12, 1609 (2021). - PMC - PubMed
    1. Vandereyken, K. et al. Methods and applications for single-cell and spatial multi-omics. Nat. Rev. Genet24, 494–515 (2023). - PMC - PubMed
    1. Chen, K. H. et al. Spatially resolved, highly multiplexed RNA profiling in single cells. Science348, aaa6090 (2015). - PMC - PubMed
    1. Stickels, R. R. et al. Highly sensitive spatial transcriptomics at near-cellular resolution with Slide-seqV2. Nat. Biotechnol.39, 313–319 (2021). - PMC - PubMed

LinkOut - more resources