. 2025 Jul 1;16(1):5629.
doi: 10.1038/s41467-025-60935-7.

Human neutrophil α-defensin HNP1 interacts with bacterial OmpA to promote Acinetobacter baumannii biofilm formation

Affiliations

Human neutrophil α-defensin HNP1 interacts with bacterial OmpA to promote Acinetobacter baumannii biofilm formation

Chongbing Liao et al. Nat Commun. .

Abstract

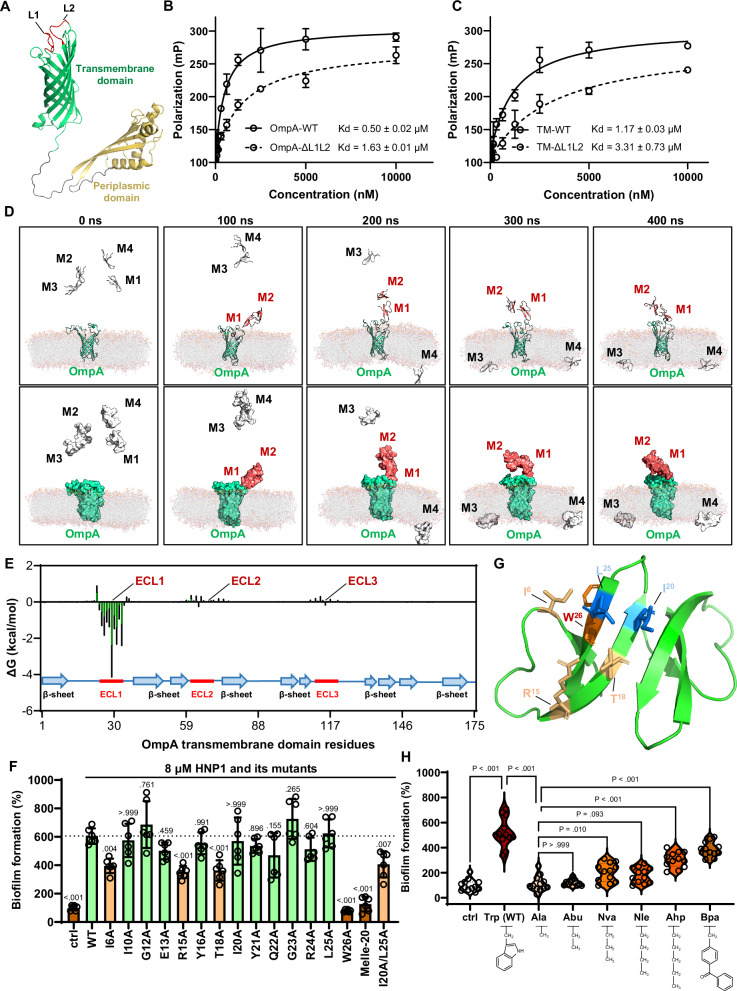
Acinetobacter baumannii is the causative agent of a wide range of nosocomial and community-acquired infections that remain extremely difficult to treat due largely to its antibiotic resistance contributed, in part, by biofilm formation. We find that the prototypic human neutrophil α-defensin HNP1, present in the bronchoalveolar lavage fluids from Acinetobacter baumannii-infected patients, promotes Acinetobacter baumannii biofilm formation through interactions with the bacterial outer membrane protein OmpA. As a result of HNP1-enhanced biofilm formation, Acinetobacter baumannii becomes more tolerant to antibiotics and more readily colonizes host cells and tissues. These unexpected findings contrast the protective roles HNP1 plays in innate immunity against microbial infection, showcasing an example of the host-pathogen arms race where a host defense peptide is exploited by a microbe for pathogenicity.


Conflict of interest statement

Competing interests: The authors declare no competing interests.

Figures

Fig. 1
Fig. 1. HNP1 promotes biofilm formation on abiotic surfaces by A. baumannii in vitro without affecting bacterial viability.
A HNP1 promoted biofilm formation by A. baumannii 19606 in a dose-dependent manner. Results are normalized to the control group (0 μM) and represent the mean ± SD of at least three independent experiments (n = 3 biological replicates per experiment). B HNP1 did not inhibit bacterial growth in LB broth (LB, orange), while exhibited significant bactericidal activity in 10 mM phosphate buffer (PB, gray). Bactericidal activity was evaluated using VCC assays. Results are mean ± SD, representative of two independent experiments (n = 3 biological replicates per experiment). C Visualization of biofilm formation by GFP-expressing A. baumannii on silicone pieces using optical microscopy after crystal violet staining (CV, scale bar = 25 μm), confocal microscopy (GFP, scale bar = 20 μm), and scanning electron microscopy (SEM, scale bar = 10 μm). Six-μm-thick z stacks from confocal microscopies were reconstructed in three-dimension using Imaris Viewer software (3D). Images are representative of at least two independent experiments. D Schematic illustration of biofilm observation using the BioFlux 1000z system (redrawn from a schematic from the BioFlux manufacturer). Diluted inoculum was applied to the 48-well plate channel with 0, 4 or 8 μM HNP1, followed by microscopic photographing continuously under a flow condition. E Real-time monitoring of biofilm formation in the Bioflux 1000z system. F Quantification of biofilms in the channels as mean gray values using ImageJ. Results represent mean with 95% confidence intervals from five parallels. G Heatmap showing the enhancement of biofilm formation by HNP1 across various A. baumannii clinical isolates, quantified by CV staining. Results are representative of at least three independent experiments. *p < 0.05; **p < 0.01; ***p < 0.001; one-way ANOVA. H Comparative effects of different antimicrobial peptides (4 μM) on biofilm formation, analyzed using CV staining. Results are violin plot of three independent experiments (n = 3 biological replicates per experiment). Statistical significances (A, B, G and H) were evaluated by one-way ANOVA with Tukey correction for multiple comparison. See also Supplementary Figs. S1, S2, Supplementary Table S1 and Supplementary Movie 1.
Fig. 2
Fig. 2. HNP1 promotes A. baumannii adhesion to host cells in vitro and on mouse skin wounds in vivo.
A Section and side views of overnight adhesion of 19606 to host cells (scale bar = 10 μm) representative of three independent experiments. Red arrows indicate the locations of bacteria. After washing with DMEM, the cells were added with 19606 in the presence or absence of HNP1, and incubated for indicated times. The adhering bacteria were visualized by confocal microscopy and quantified by colony counting. Colony counting results showing that HNP1 significantly promoted adhesion of 19606 to A549 (B) and J774a.1 (C) cells after 4 h of incubation, while the bacterial internalization remained low after 4–8 h of incubation plus 1 h of gentamicin treatment. Results are mean ± SD, representative of at least three experiments (n = 6 biological replicates per experiment). D Schematic of the murine wound infection assay. C57BL/6J mice were anaesthetized, the dorsal side was shaved and depilated, and two 5-mm-diameter circular punches were made per mouse. The wounds were inoculated with 20 μl of bacterial suspension containing ~3 × 106 CFU of 19606 pretreated with 0 or 10 μM HNP1, and then covered with waterproof bandages and tissue adhesive. Mice were sacrificed 2-, 4-, and 6-days post-infection, and the wounds were collected for bacterial load quantification and SEM observation. E Colony counting showing a higher bacterial load on murine wounds in the presence of 10 μM HNP1. Results are mean ± SEM (four mice per time point per group, two wounds per mouse). F SEM images of bacteria on murine wounds (Scale bar = 10 μm) representative of four mice in one experiment. Statistical significances for B and C were evaluated by two-way ANOVA with Tukey correction for multiple comparison. Statistical significances for (E) were evaluated by multiple unpaired t-tests (two-sided). See also Supplementary Figs. S3 and S4.
Fig. 3
Fig. 3. HNP1 enhances survival and antibiotic tolerance of A. baumannii in biofilms.
A Schematic of the antibiotic treatment of biofilms. Diluted inoculum was added to a 48-well plate with or without 8 μM HNP1 and incubated at 37 °C for 24 h. Then, an equal volume of LB containing double concentrations of indicated antibiotics were added to each well, and the plate was further incubated for another 12 h. After incubation, planktonic bacteria were removed by washing with PBS, and the biofilms were suspended and diluted in PBS. Finally, bacterial suspensions were plated and colonies were counted after overnight culture at 37 °C. B Confocal microscopy of biofilms treated with kanamycin and stained with SYTO™ 9 and PI (Scale bar = 25 μm). C Quantification of live/dead bacteria by confocal microscopy using ImageJ. Results are mean ± SD of 5 random views per group. D Colony counting results showing the survival of 19606 in biofilms treated with kanamycin with/without 8 μM HNP1. Results are mean ± SD, representative of at least three independent experiments (n = 6 biological replicates per experiment). Statistical significances (C and D) were evaluated by two-way ANOVA with Tukey correction for multiple comparison. See also Supplementary Fig. S5.
Fig. 4
Fig. 4. HNPs are present in BALF/sputum samples from A. baumannii-infected pneumonia patients.
A Schematic illustration of the BALF/sputum sample processing. BALF or sputum samples were diluted with 10 mM PBS, and centrifuged at 1000 × g, 4 °C for 10 min, then the supernatants were collected for further analysis. B Representative deconvolution of the mass spectrum of the sputum supernatant from the patient. Samples were analyzed using an Agilent 6230 LC-TOF system, and the mass spectrum was processed with Bioconfirm software (Agilent). Red arrows indicate the peaks corresponding to HNPs. C Quantification of HNP1 in the BALF/sputum supernatants by LC-MS. Extracted-ion chromatograms (EIC) for 1148 ± 1 m/z were used for calculating HNP1 levels based on peak areas. Synthetic HNP1 (10 – 10,000 nM) was used as the standard. D Quantification of HNP1-3 in BALF/sputum supernatants by ELISA. Results of C (n = 3 technical replicates for each patient sample) and D (n = 2 technical replicates for each patient sample) are presented as mean ± SD, representative of at least three independent experiments. See also Supplementary Fig. S6.
Fig. 5
Fig. 5. OmpA mediates HNP1-promoted biofilm formation by A. baumannii.
A Adhesion of three 19606 strains on A549 cells evaluated by the bacterial adhesion assay. The cells were washed with DMEM, incubated with 19606 in the presence or absence of HNP1 for 2 h, lysed with water, diluted with PBS, and then plated on LB agar for colony counting after overnight culture. B Effect of HNP1 on biofilm formation of three 19606 strains. Upper panel: Biofilm formation in 96-well plates quantified by CV staining. Lower panel: Biofilm formation on the air-liquid interface of polystyrene tubes stained with CV. HNP1 did not enhance bacterial adhesion to A549 cells (A) or biofilm formation (B) in the ompA knockout mutant (ΔOmpA), but these effects were restored with ompA complementation (ΔOmpA:C). Results of A and B are mean ± SD representative of at least two experiments (n = 6 biological replicates per experiment). C Visualization using fluorescent microscopy of biofilm formation on silicone surfaces by three A. baumannii 19606 strains with/without HNP1, stained by PI (Scale bar = 50 μm), representative of two independent experiments. D Visualization using SEM of biofilm formation on silicone surfaces by A. baumannii 19606 WT and ΔOmpA strains with/without HNP1 (Scale bar = 50 μm), representative of two biological replicates. E Competitive inhibition of exogenously added recombinant OmpA on HNP1-promoted biofilm formation. Results are pooled mean ± SD of three independent experiments (n = 3 biological replicates per experiment). Statistical significances (A, B and E) were evaluated by two-way ANOVA with Tukey correction for multiple comparison. See also Supplementary Figs. S7 and S8.
Fig. 6
Fig. 6. Molecular basis that underlies HNP1-OmpA interactions.
A The structure of A. baumannii OmpA constructed using AlphaFold 3. The transmembrane domain is in green, the peptidoglycan-binding domain in the periplasm is in yellow, and the two extracellular loops (L1 and L2) are in red. B Binding affinity between the full-length wild-type OmpA (OmpA WT) and HNP1, as well as the OmpA ΔL1L2 mutant (OmpA-ΔL1L2) and HNP1, assessed by fluorescent polarization. C Binding affinity between the transmembrane domain of wild-type OmpA (TM) and HNP1, as well as the OmpA ΔL1L2 mutant (TM-ΔL1L2) and HNP1, assessed by fluorescent polarization. Results of B and C are mean ± SD representative of at least two experiments (n = 2 biological replicates per experiment). D Conformations at different time points of HNP1 and OmpA in molecular dynamics simulation. OmpA is shown in green, interacting HNP1 molecules (M1 and M2) in red, and diffusing HNP1 molecules (M3 and M4) in gray. E The decomposition of individual residue contributions of OmpA in the total binding free energy during 100–1000 ns of MD simulation analyzed using MM-GBSA. F Effect of HNP1 Ala-substitution mutants on biofilm formation characterized by CV staining. Results are mean ± SD of two independent experiments (three parallels per experiment). G Position of critical residues on an HNP1 dimer (PDB: 3GNY). H Restorage of hydrophobicity at position 26 of HNP1 restored its biofilm-enhancing effect. Results are violin plot of four independent experiments (three parallels per experiment). Statistical significances (F and H) were evaluated by one-way ANOVA with Tukey correction for multiple comparison. See also Supplementary Figs. S7–S11 and Supplementary Movie 2.
Fig. 7
Fig. 7. HNP1 affects the metabolism of A. baumannii while exhibiting minimal effects on biofilm-related gene transcription.
A PCA plot of RNA-seq data from A. baumannii WT and ΔOmpA strains treated with/without 8 μM HNP1 (n = 3 for each group). B Hierarchically clustered heatmap representing sample-to-sample distances calculated using Poisson distances, illustrating the overall similarities between samples. C Venn diagrams showing the overlap of DEGs between the three comparisons: WT + HNP1 vs. WT, ΔOmpA vs. WT, and ΔOmpA + HNP1 vs. ΔOmpA. The upper panel shows overlaps of upregulated genes, while the lower panel shows overlaps of downregulated genes. D Volcano plots depicting the DEGs from the DESeq2 analysis for the three comparisons. Genes significantly upregulated are shown in red, while significantly downregulated genes are shown in blue. Non-significant genes are indicated in gray. E COG category distribution of DEGs. The upregulated and downregulated genes in each comparison are categorized by their COG functional groups, with blue representing downregulated genes and orange representing upregulated genes. F Heatmap showing the expression of nine-groups of biofilm-related genes across the four experimental groups. The upper panel displays the mean log2 fold change relative to WT for each gene, and the lower panel shows the count per million (CPM) expression values for the same genes. See also Supplementary Figs. S12 and S13, Supplementary Data.

Similar articles

References

    1. Harding, C. M., Hennon, S. W. & Feldman, M. F. Uncovering the mechanisms of Acinetobacter baumannii virulence. Nat. Rev. Microbiol.16, 91–102 (2018). - PMC - PubMed
    1. Peleg, A. Y., Seifert, H. & Paterson, D. L. Acinetobacter baumannii: emergence of a successful pathogen. Clin. Microbiol. Rev.21, 538–582 (2008). - PMC - PubMed
    1. Perez, F. et al. Global challenge of multidrug-resistant Acinetobacter baumannii. Antimicrob. Agents Chemother.51, 3471–3484 (2007). - PMC - PubMed
    1. Whiteway, C., Breine, A., Philippe, C. & Van der Henst, C. Acinetobacter baumannii. Trends Microbiol.30, 199–200 (2022). - PubMed
    1. Perez, S. et al. Increase in hospital-acquired Carbapenem-resistant Acinetobacter baumannii infection and colonization in an acute care hospital during a surge in COVID-19 admissions—New Jersey, February-July 2020. Morb. Mortal. Wkly Rep.69, 1827–1831 (2020). - PMC - PubMed

MeSH terms

Substances

LinkOut - more resources