. 2025 Jul 1;16(1):5930.
doi: 10.1038/s41467-025-61392-y.

Air pollution-induced proteomic alterations increase the risk of child respiratory infections

Affiliations

Air pollution-induced proteomic alterations increase the risk of child respiratory infections

Nicklas Brustad et al. Nat Commun. .

Abstract

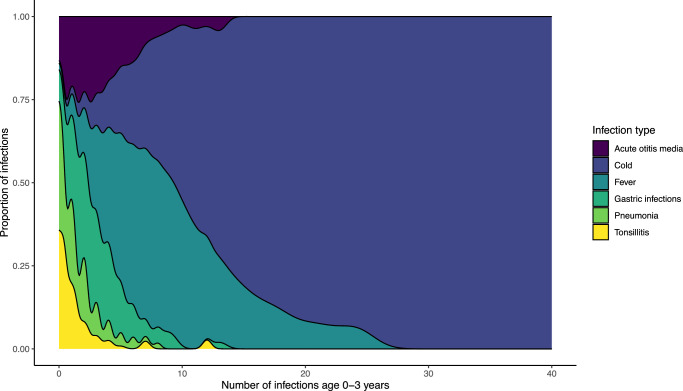
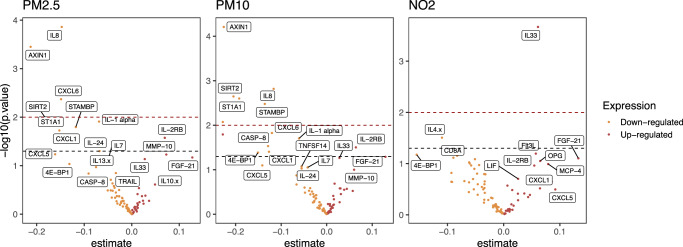
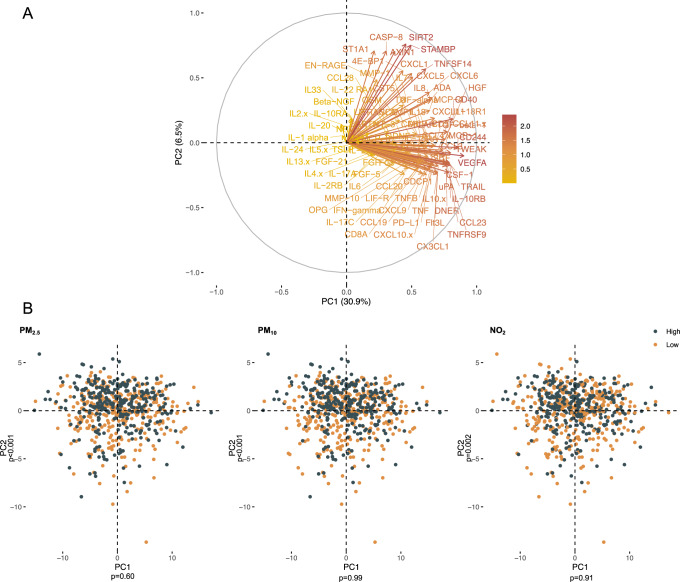
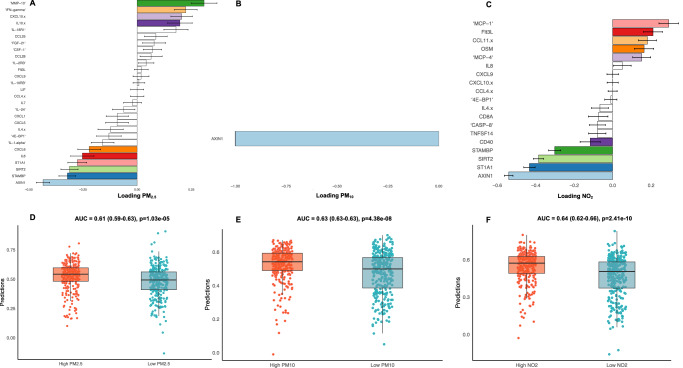
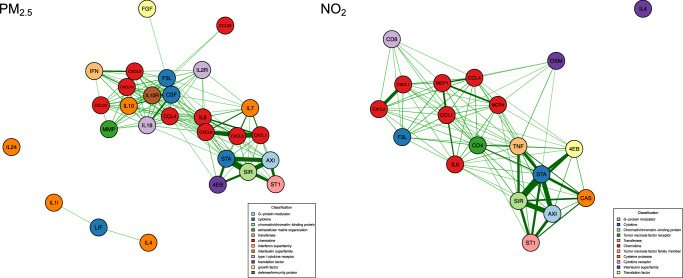
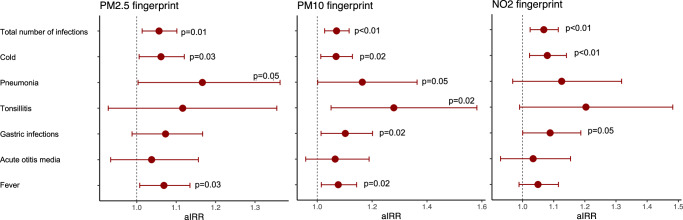
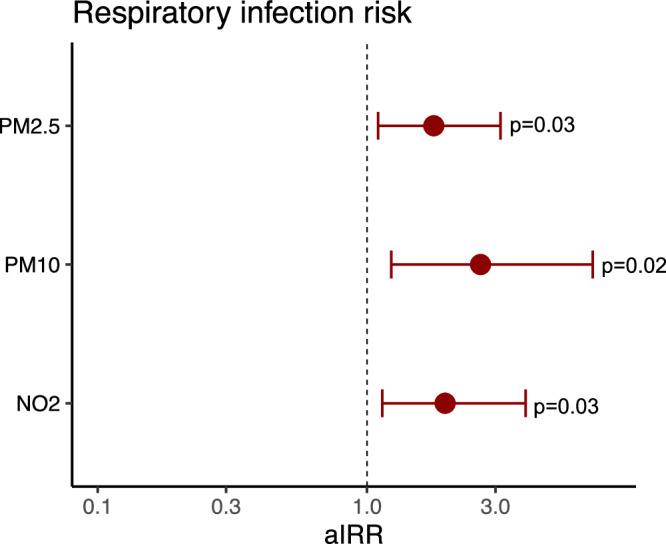
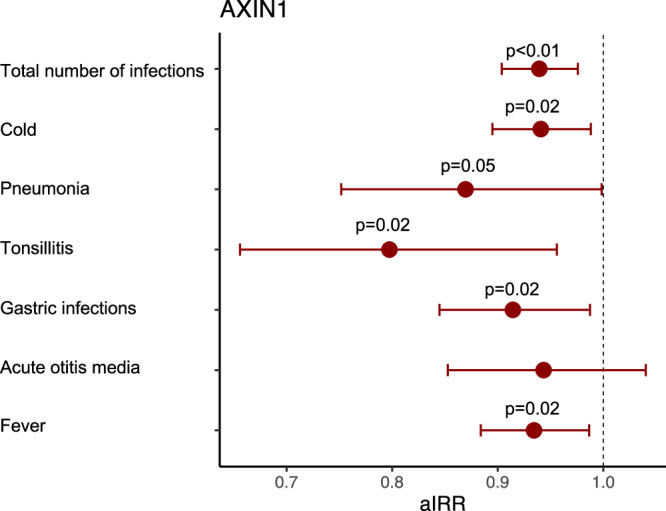
Early life air pollution exposure may play a role in development of respiratory infections, but underlying mechanisms are still not understood. We utilized data from two independent prospective birth cohorts to investigate the influence of prenatal and postnatal ambient air pollution exposure of PM2.5, PM10 and NO2 on maternal and child proteomic profiles and the risk of daily diary-registered common infections age 0-3 years in the Danish COPSAC2010 (n = 613) and pneumonia, croup and bronchitis age 1-2 years in the Swedish EMIL (n = 101). A supervised sparse partial least square model generated proteomic fingerprints of air pollution analyzed against infection outcomes using Quasi-Poisson and logistic regression models, respectively. Here we demonstrated that prenatal ambient air pollution exposure was associated with altered maternal proteomic profile with significant downregulation of the AXIN1 protein. The prenatal air pollution proteomic fingerprints related to a significantly higher risk of total number of infections, cold, pneumonia and fever episodes in COPSAC2010 and similar postnatal air pollution proteomic fingerprints related to a significantly higher risk of respiratory infections in EMIL. Higher AXIN1 protein levels associated with significantly decreased risks of total number of infections, cold, pneumonia, tonsillitis and fever episodes, and asthma risk in COPSAC2010 and a significantly decreased risk of respiratory infections in EMIL suggesting a protective effect of this specific protein in both cohorts. This study of two prospective birth cohorts demonstrates ambient air pollution alterations in the maternal and child's proteomic profiles that associates with respiratory infection risk suggesting the AXIN1 protein as a potential target for respiratory infection and asthma prevention in childhood.


Conflict of interest statement

Competing interests: The authors declare no competing interests.

Figures

Fig. 1
Fig. 1. Density plot.
Density plot showing the proportion of infection types age 0–3 years in the COPSAC2010 cohort.
Fig. 2
Fig. 2. Volcano plots.
Volcano plots of the associations between PM2.5, PM10, and NO2 and maternal inflammatory proteomic profile in the COPSAC2010 cohort from linear regression models. Blue dotted line indicating p < 0.05 and red dotted line indicating p < 0.001. Source data are provided as a Source Data file.
Fig. 3
Fig. 3. PCA score and loading plots.
A PCA loading plot showing the distribution of maternal inflammatory proteins at pregnancy week 24 from a principal component analysis in the COPSAC2010 cohort. B PCA score plots of the maternal inflammatory proteomic profile at pregnancy week 24 showing patterns of correlation from linear regression models between proteins and the distribution of mothers with high vs low (median split) ambient air pollution exposure for PM2.5, PM10, and NO2.
Fig. 4
Fig. 4. Loading plots of the proteins.
Sparse least squares model predicting high vs low air pollution exposure during pregnancy from maternal pregnancy week 24 proteomic profiles. A–C Overview of proteins with corresponding loadings. PM10 only had one selected protein (AXIN1). The panels display linear regression estimates with 95% confidence intervals for proteins positively or negatively associated with air pollution measurements (n = 613). D–F The cross-validated predictions with AUC and p-values, which were strongly associated with air pollution. The box plots represent the class predictions for the median cross-validated model (n = 613). The center of the boxes represents the median, their bounds represent the 25th and 75th percentiles, and the lower and upper ends of whiskers represent the smallest and largest values.
Fig. 5
Fig. 5. Network analysis.
A Correlation (Spearman) network analysis of the proteins from each air pollution component (PM2.5 and NO2). The component for PM10 only included 1 protein – AXIN1. Abbreviations: AXI AXIN1, ST1 ST1A1, SIR SIRT2 STA STAMBP, F3L Flt3L, CCL1 CCL11, CD4 CD40, TNF TNFSF14, CAS CASP8, CD8 CD8A, 4EB 4EBP1, MMP MMP10, IFN IFNgamma, IL18R IL18R1, IL1l IL1alpha, FGF FGF21, CSF CSF1, IL2R IL2RB, IL10 IL10RB. Correlations with an absolute value below 0.3 are not shown. Correlations ≥ 0.6 are plotted with maximum edge thickness of the lines. Correlations between 0.3 and 0.6 are scaled proportionally with thinner lines.
Fig. 6
Fig. 6. Maternal air pollution proteome vs risk of infections in COPSAC2010.
Association between maternal air pollution proteomic fingerprints from sparse least squares model and risk of infections types age 0–3 years in the COPSAC2010 cohort (n = 613). Estimates from Quasi-Poisson regression models with 95% confidence intervals adjusted for gestational age, furred pets during the first year, maternal education and income, time to daycare start, number of older siblings, alcohol use, antibiotic use, and smoking during pregnancy, delivery mode, child hospitalization at birth, and birth season. Source data are provided as a Source Data file.
Fig. 7
Fig. 7. Child air pollution proteome vs risk of infections in EMIL.
Results from the EMIL cohort (n = 101) showing associations between child air pollution proteomic fingerprint and risk of respiratory infections age 1–2 years. Estimates from logistic regression models with 95% confidence intervals adjusted for gestational age, furred pets during the first year, maternal education and income, time to daycare start, number of older siblings, alcohol use, antibiotic use, and smoking during pregnancy, delivery mode, child hospitalization at birth, and birth season. Source data are provided as a Source Data file.
Fig. 8
Fig. 8. AXIN1 protein levels vs risk of infections in COPSAC2010.
Association between AXIN1 levels and risk of common childhood infections in COPSAC2010 (n = 613).Estimates from Quasi-Poisson regression models with 95% confidence intervals adjusted for gestational age, furred pets during the first year, maternal education and income, time to daycare start, number of older siblings, alcohol use, antibiotic use, and smoking during pregnancy, delivery mode, child hospitalization at birth, and birth season. Source data are provided as a Source Data file.

Similar articles

References

    1. Yu, Z. et al. Improved air quality and asthma incidence from school-age to young adulthood: a population-based prospective cohort study. Ann. Am. Thorac. Soc.10.1513/AnnalsATS.202402-200OC. (2024). - PMC - PubMed
    1. Tingskov Pedersen, C.-E. et al. Prenatal exposure to ambient air pollution is associated with early life immune perturbations. J. Allergy Clin. Immunol.151, 212–221 (2023). - PubMed
    1. Yu, Z. et al. Associations of improved air quality with lung function growth from childhood to adulthood: the BAMSE study. Eur. Respir. J.61, 2201783 (2023). - PMC - PubMed
    1. Gehring, U. et al. Exposure to air pollution and development of asthma and rhinoconjunctivitis throughout childhood and adolescence: a population-based birth cohort study. Lancet Respir. Med.3, 933–942 (2015). - PubMed
    1. Pedersen, M. et al. Early-life exposure to ambient air pollution from multiple sources and asthma incidence in children: a nationwide birth cohort study from Denmark. Environ. Health Perspect.131, 57003 (2023). - PMC - PubMed

MeSH terms

LinkOut - more resources