. 2025 Jul 1;16(1):5906.
doi: 10.1038/s41467-025-60958-0.

Caffeine enhances antitumor T-cell activity by suppressing kynurenine pathway in colorectal cancer

Affiliations

Caffeine enhances antitumor T-cell activity by suppressing kynurenine pathway in colorectal cancer

Yuechen Liu et al. Nat Commun. .

Abstract

Colorectal cancer (CRC) is a leading global health issue, ranking third in incidence and second in cancer mortality. Immunotherapy, effective mainly in mismatch repair-deficient CRC, may benefit from dietary interventions. This study investigates caffeine's potential to boost programmed death-1 (PD-1) immunotherapy efficacy in CRC, revealing that caffeine significantly reduces tumor growth, extends survival, and enhances CD8+ T cell activity in CRC by suppressing kynurenine pathway. Mechanistically, caffeine decreases kynurenine via the Krüppel-like factor 4 (KLF4)- Collagen type XII alpha 1 (COL12A1)- Mitogen-Activated Protein Kinase (MAPK)-Indoleamine 2,3-dioxygenase 1 (IDO1) axis, mitigating CD8+ T cell exhaustion. Combining caffeine with PD-1 therapy further prolongs survival, highlighting the value of integrating nutritional strategies into cancer treatment to improve outcomes and broaden therapeutic options. Here, we show caffeine can enhance PD-1 immunotherapy in CRC by suppressing kynurenine pathway, suggesting its potential as an adjunctive dietary therapy.


Conflict of interest statement

Competing interests: The authors declare no competing interests.

Figures
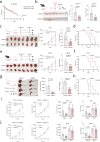
Fig. 1
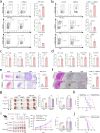
Fig. 1. Caffeine inhibits colorectal cancer progression and enhances survival.
a Survival analysis using Kaplan-Meier method from the UK Biobank dataset comparing high and low caffeine intake groups in colorectal cancer patients (n = 1981). b Schematic depicting the treatment of caffeine (0.1% w/v, daily) in APCmin/+ mice. Representative images of intestinal tumor (red arrows) and quantification of tumor number and tumor volume (n = 6 per group). c Schematic depicting the treatment of caffeine (0.1% w/v, daily) in subcutaneous CT26 tumor-bearing BALB/c mice. Representative images of tumor from control and caffeine-treated groups (n = 8 per group). Scale bars, 1 cm. Quantification of the tumor growth curve and tumor weight. d Kaplan-Meier survival curves of CT26 tumor-bearing BALB/c mice treated with caffeine or control (n = 8 per group). e Schematic depicting the treatment of caffeine (0.1% w/v, daily) in subcutaneous MC38 tumor-bearing C57BL/6 mice. Representative images of tumor from control and caffeine-treated groups (n = 8 per group). Scale bars, 1 cm. Quantification of the tumor growth curve and tumor weight. f Kaplan-Meier survival curves of MC38 tumor-bearing C57BL/6 mice treated with caffeine or control (n = 8 per group). g Schematic depicting the treatment of caffeine (0.1% w/v, daily) in orthotopic CT26 tumor-bearing BALB/c mice. Representative images of tumor from control and caffeine-treated groups (n = 4 per group). Scale bars, 1 cm. Quantification of the tumor volume and tumor weight. h Kaplan-Meier survival curves of orthotopic CT26 tumor-bearing BALB/c mice treated with caffeine or control (n = 4 per group). i Tumor growth curves and tumor weights of subcutaneous CT26 tumor-bearing BALB/c and BALB/c-nu mice treated with caffeine (0.1% w/v, daily) or control (n = 8 per group). j Tumor growth curves and tumor weights of subcutaneous MC38 tumor-bearing C57BL/6 mice and BALB/c-nu mice treated with caffeine (0.1% w/v, daily) or control (n = 8 per group). s.c., subcutaneous inject. o.i., orthotopic inject. Data error bars are mean ± SD. The statistical analysis of tumor growth curve is Two-way ANOVA, the survival curve is Log-rank test, the others are Student’s two-tailed unpaired t-test. The images of mice elements were drawn by Figdraw. Source data are provided as a Source Data file.
Fig. 2
Fig. 2. The anti-tumor effect of caffeine dependents on CD8+ T-cell function.
Flow cytometry analysis of CD8+ T cells and exhaustion markers (PD-1, LAG3) in a spontaneous tumor in APCmin/+ mice and b orthotopic CT26 tumor in BALB/c mice treated with caffeine (0.1% w/v, daily) or control (n = 4 per group). Quantification of immune cell populations (CD4+ T cells, B cells, macrophages, and neutrophils) in c spontaneous tumor in APCmin/+ mice and d orthotopic CT26 tumor in BALB/c mice treated with caffeine or control (n = 4 per group). Immunohistochemistry staining and quantification of CD8+ T cells in e spontaneous tumor in APCmin/+ mice and f orthotopic CT26 tumor in BALB/c mice treated with caffeine or control (n = 6 per group). Scale bars, 200 μm, 100 μm, 20 μm. g Schematic depicting the treatment of caffeine (0.1% w/v, daily) or anti-CD8 monoclonal antibody (CD8 mAb, 200 μg/mouse, ip. twice weekly) in orthotopic CT26 tumor-bearing BALB/c mice. Representative images of tumor from control or caffeine-treated and CD8 mAb treatment groups (n = 3 per group). Scale bars, 1 cm. Quantification of the maximum tumor size and tumor weight. h Kaplan-Meier survival curves of orthotopic CT26 tumor-bearing BALB/c mice treated with caffeine or control and CD8 mAb (n = 4 per group). i Schematic depicting the treatment of caffeine (0.1% w/v, daily) and CD8 mAb (200 μg/mouse, ip. twice weekly) in subcutaneous MC38 tumor-bearing C57BL/6 mice. Representative images of tumor from control or caffeine-treated and CD8 mAb treatment groups (n = 6 per group). Scale bars, 1 cm. Quantification of the tumor growth curve and tumor weight. j Kaplan-Meier survival curves of subcutaneous MC38 tumor-bearing C57BL/6 mice treated with caffeine or control and CD8 mAb (n = 6 per group). s.c., subcutaneous inject. o.i., orthotopic inject. Data error bars are mean ± SD. The statistical analysis of tumor growth curve is Two-way ANOVA, the survival curve is Log-rank test, the others are Student’s two-tailed unpaired t-test. The images of mice elements were drawn by Figdraw. Source data are provided as a Source Data file.
Fig. 3
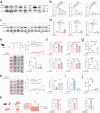
Fig. 3. COL12A1 is a crucial molecule in the anti-tumor effects of caffeine.
Co-culture experiments of Jurkat cells treated with caffeine (0, 0.1, 1 mM). a Flow cytometry analysis the IFN-γ and PD-1 expression and b qPCR analysis of the mRNA expression of GZMB, IFNG, and PD-1, LAG3 in Jurkat cells (Representative data from n = 3 independent experiments). Co-culture experiments of Jurkat and HCT116 cells treated with caffeine (0, 0.1, 1 mM). c Flow cytometry analysis of the IFN-γ and PD-1 expression and d qPCR analysis of the mRNA expression of GZMB, IFNG, and PD-1, LAG3 in Jurkat cells (Representative data from n = 3 independent experiments). e Volcano plot and f Enrichment analysis of differentially expressed genes between caffeine-treated and control groups in HCT116 cells. g Venn diagram identifying COL12A1 as a gene differentially expressed in both RNA-Seq, TCGA datasets and correlated with survival outcomes. h qPCR analysis of COL12A1 mRNA expression and i western blot analysis of COL12A1 expression in paired normal and tumor tissues (n = 12). The samples derive from the same experiment, but different gels for COL12A1, GAPDH were processed in parallel. The quantification provided under the blots is for the representative blot from n = 3 independent experiments. j Immunohistochemistry staining of COL12A1 and CD8 in colorectal cancer tissue microarray (TMA) samples, scale bars, 100 μm, 50 μm. Quantification of COL12A1 expression in tumors (n = 202, Min = 1, Max = 12, Median=6, Lower Whisker = 1, Upper Whisker=12, Q1 = 4, Q3 = 9, IQR = 5) compared to normal tissues (n = 65, Min = 0, Max = 12, Median = 4, Lower Whisker = 0, Upper Whisker = 12, Q1 = 2, Q3 = 6, IQR = 4). k OS plot and l Cox regression analysis the prognostic significance of COL12A1 expression and other clinical variables based on TMA dataset (n = 202). m Representative images of immunofluorescence co-staining for COL12A1 (red) and CD8 (green) with TMA samples; statistical plot of the number of CD8+ T cells (COL12A1-high, n = 60, Min =12, Max = 257, Median = 78.5, Lower Whisker = 12, Upper Whisker = 257, Q1 = 46, Q3 = 143.25, IQR = 97.25; COL12A1-low, n = 60, Min = 45, Max = 402, Median = 168.5, Lower Whisker = 45, Upper Whisker = 402, Q1 = 129, Q3 = 235, IQR = 106). Scale bars, 100 μm. Data error bars are mean ± SD. The statistical analysis of h is Student’s two-tailed paired t-test, k is Log-rank test, the others are Student’s two-tailed unpaired t-test. The images of co-culture elements were drawn by Figdraw. Source data is provided as a Source Data file.
Fig. 4
Fig. 4. Caffeine activates CD8+ T cells by KLF4/COL12A1 axis in CRC cells.
a Western blot and b qPCR analysis of COL12A1 expression in CRC cells treated with caffeine (0, 1, 10 mM) (Representative data from n = 3 independent experiments). The samples derive from the same experiment but different gels for COL12A1, GAPDH were processed in parallel. The quantification provided under the blots is for the representative blot from n = 3 independent experiments. c Western blot and d qPCR analysis COL12A1 expression in COL12A1-overexpressed (COL12A1-OE) and control cells treated with caffeine (1 mM) (Representative data from n = 3 independent experiments). The samples derive from the same experiment but different gels for COL12A1, GAPDH were processed in parallel. The quantification provided under the blots is for the representative blot from n = 3 independent experiments. e Schematic depicting the treatment of caffeine in subcutaneous COL12A1-OE MC38 tumor-bearing C57BL/6 mice. Representative images of tumor from caffeine-treated or COL12A1-OE groups (n = 5 per group). Scale bars, 1 cm. Quantification of the tumor growth curve and tumor weight. f Flow cytometry analysis of CD8+ T cells and GZMB, PD-1, LAG3 expression (n = 4 per group) or g Quantification of immunohistochemistry staining of CD8+ T cells and COL12A1 (n = 5) in tumor of subcutaneous MC38 with COL12A1-OE or control (COL12A1-NC) tumor-bearing C57BL/6 mice treated with caffeine or control. h Representative images of tumors from the treatment of anti-CD8 monoclonal antibody (CD8 mAb) (200 μg, ip. twice weekly) in subcutaneous MC38 with COL12A1 knockdown (sh-COL12A1) or control (sh-NC) tumor-bearing C57BL/6 mice (n = 5 per group). Scale bars, 1 cm. Quantification of the tumor growth curve and tumor weight. i Flow cytometry analysis (n = 4 per group) and j Quantification of immunohistochemistry staining (n = 5) of CD8+ T-cell infiltration in subcutaneous MC38 with sh-COL12A1 tumor-bearing C57BL/6 mice treated with CD8 mAb. k Schematic of co-culture experiments with splenocytes and COL12A1-OE MC38 cells treated with caffeine (1 mM). Flow cytometry analysis the GZMB, PD-1 and Ki67 expression in CD8+ T cells of splenocytes (n = 4 per group). Data error bars are mean ± SD. The statistical analysis of the growth curve is Two-way ANOVA, the others are Student’s two-tailed unpaired t-test. The images of mice and co-culture elements were drawn by Figdraw. Source data is provided as a Source Data file.
Fig. 5
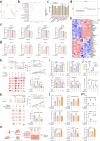
Fig. 5. Caffeine downregulates COL12A1 to reduce kynurenine.
a Principal component analysis, b Enrichment analysis of metabolites, c Quantification of tryptophan related metabolite levels (n = 6), d Box plots of tryptophan changes from supernatant of control (A, n = 6, Min=23.3397, Max = 23.7274, Median = 23.5581, Lower Whisker = 23.3997, Upper Whisker= 23.7274, Q1 = 23.4511, Q3 = 23.6636, IQR = 0.2125) and caffeine-treated (B, n = 6, Min = 23.5735, Max = 24.0682, Median = 23.9736, Lower Whisker=23.5735, Upper Whisker=24.0682, Q1 = 23.9351, Q3 = 24.0298, IQR = 0.1026) HCT116 cells, e Heatmap of differential metabolite. f ELISA analysis kynurenine (Kyn) levels in CRC cells treated with caffeine (0, 0.1, 1, 10 mM) (Representative data from n = 3 independent experiments). g ELISA analysis Kyn levels in COL12A1-overexpressed (COL12A1-OE) CRC cells treated with caffeine (1 mM) (Representative data from n = 3 independent experiments). h Schematic depicting the treatment of caffeine or Kyn (100 mg/kg, ip) or Indoximod (100 mg/kg, ip) in subcutaneous CT26 tumor-bearing BALB/c mice. Representative images of tumors (n = 6 per group). Scale bars, 1 cm. Quantification of the tumor growth curve and weight. i Flow cytometry analysis of CD8+ T cells and GZMB, PD-1, LAG3 expression (n = 4 per group) or j Quantification of immunohistochemistry staining of CD8+ T cells and COL12A1 (n = 6) in tumor of subcutaneous CT26 tumor-bearing BALB/c mice treated with caffeine or Kyn or Indoximod or control. k Schematic depicting the treatment of caffeine or Indoximod in subcutaneous COL12A1-OE CT26 tumor-bearing BALB/c mice. Representative images of tumors (n = 5 per group). Scale bars, 1 cm. Quantification of the tumor growth curve and weight. l Flow cytometry analysis of CD8+ T cells and GZMB, PD-1, LAG3 expression (n = 4 per group) or m Quantification of immunohistochemistry staining of CD8+ T cells and COL12A1 (n = 5) in tumor of subcutaneous COL12A1-OE CT26 tumor-bearing BALB/c mice treated with caffeine or Indoximod. n Schematic of co-culture experiments with splenocytes and COL12A1-OE CT26 cells treated with caffeine (1 mM), Kyn (100 μM) or Indoximod (50 μM). Flow cytometry analysis of the GZMB, PD-1, Ki67 expression in CD8+ T cells of splenocytes (n = 4 technical replicates, Representative data from n = 3 independent experiments). Data error bars are mean ± SD. The statistical analysis of the tumor growth curve is Two-way ANOVA, the others are Student’s two-tailed unpaired t-test. The images of mice and co-culture elements were drawn by Figdraw. Source data is provided as a Source Data file.
Fig. 6
Fig. 6. COL12A1 regulates Kyn production via MAPK-IDO1 axis.
a Schematic of tryptophan-kynurenine pathway. b Western blot and c qPCR analysis of the expression of IDO1, IDO2, and TDO2 in CRC cells with COL12A1 overexpression (Ad-COL12A1) and knockdown (sh-COL12A1) (Representative data from n = 3 independent experiments). The samples derive from the same experiment but different gels for IDO1, IDO2, another for TDO2 and another for GAPDH were processed in parallel. d Volcano plot, e Enrichment analysis and f KEGG analysis in Ad-COL12A1 MC38 cells compared to control. g Western blot analysis of ERK1/2, JNK1/2/3, p38, and IDO1 in CRC cells with different COL12A1 expression. The samples derive from the same experiment, but different gels for IDO1, p-ERK1/2, another for ERK1/2, another for p-JNK1/2/3, another for JNK1/2/3, another for p-P38, another for P38 and another for GAPDH were processed in parallel. h Representative fluorescence images and quantitative analysis of p-ERK (green) in Ad-COL12A1 HCT116 cells (Representative images from n = 5 independent experiments). Scale bars, 20 μm. i Western blot analysis the expression of IDO1 and ERK1/2 levels and j qPCR analysis the expression of IDO1 in COL12A1-OE CRC cells treated with U0126 (5 μM) (Representative data from n = 3 independent experiments). The samples derive from the same experiment but different gels for IDO1, p-ERK1/2, another for ERK1/2 and another for GAPDH were processed in parallel. k Schematic depicting the treatment of caffeine or U0126 in subcutaneous COL12A1-OE MC38 tumor-bearing C57BL/6 mice (n = 6 per group). Scale bars, 1 cm. Quantification of the tumor growth curve and tumor weight. l Flow cytometry analysis of CD8+ T cells and GZMB, PD-1, LAG3 expression (n = 4) in tumor of Fig. 6k. m ELISA analysis of kynurenine (Kyn) levels in COL12A1-OE CRC cells treated with caffeine (1 mM) or U0126 (5 μM) (Representative data from n = 3 independent experiments). n Flow cytometry analysis the GZMB, PD-1, Ki67 expression in CD8+ T cells of splenocytes co-cultured with COL12A1-OE MC38 cells treated with caffeine (1 mM) or U0126 (5 μM) (n = 4 technical replicates, Representative data from n = 3 independent experiments). Data error bars are mean ± SD. The statistical analysis of the tumor growth curve is Two-way ANOVA, the others are Student’s two-tailed unpaired t-test. Source data is provided as a Source Data file.
Fig. 7
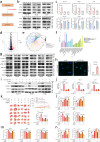
Fig. 7. Caffeine enhances the effects of PD-1 antibody immunotherapy.
a Schematic depicting the treatment of caffeine (0.1% w/v, daily) or anti-PD-1 monoclonal antibody (PD-1 mAb, 10 mg/kg, ip, twice weekly) in subcutaneous CT26 tumor-bearing BALB/c mice. Representative images of tumor from caffeine-treated or PD-1 mAb groups (n = 8). Scale bars, 1 cm. Quantification of the tumor growth curve and tumor weight. b Waterfall plot on tumor volume changes (n = 8) and c Kaplan-Meier survival curves of subcutaneous CT26 tumor-bearing BALB/c mice treated with caffeine, PD-1 mAb, or their combination (n = 6). d Flow cytometry analysis of GZMB, IFN-γ, Ki67 of CD8+ T cells in tumor of subcutaneous CT26 tumor-bearing BALB/c mice treated with caffeine, PD-1 mAb, or their combination (n = 4). e Schematic depicting the treatment of caffeine or PD-1 mAb in subcutaneous MC38 tumor-bearing C57BL/6 mice. Representative images of tumor from caffeine-treated or PD-1 mAb groups (n = 6). Scale bars, 1 cm. Quantification of the tumor growth curve and tumor weight. f Waterfall plot on tumor volume changes (n = 6) and g Kaplan-Meier survival curves of subcutaneous MC38 tumor-bearing C57BL/6 mice treated with caffeine, PD-1 mAb, or their combination (n = 6). h Flow cytometry analysis of GZMB, IFN-γ, Ki67 of CD8+ T cells in tumor of subcutaneous MC38 tumor-bearing C57BL/6 mice treated with caffeine, PD-1 mAb, or their combination (n = 4). i Analysis of mRNA expression of COL12A1 associated with response to anti-PD-1 therapy in multiple cancers in public datasets, Zhao_2019_GBM, (PRJNA482620, n = 14), Vanallen_2015_Melanoma (PHS000452, PD/SD, n = 66, PR/CR, n = 39). j Kaplan-Meier survival analysis of patients treated with anti-PD-1 therapy in public datasets. k Immunohistochemistry staining and quantification of COL12A1 in pre-immunotherapy CRC samples from responders (n = 8) and non-responders (n = 13), scare bar, 50 μm. l Representative images of immunofluorescence co-staining for COL12A1 (red) and CD8 (green) in pre-immunotherapy CRC samples from responders and non-responders. Representative images from n = 6 independent experiments. Scare bar, 50μm. m Schematic diagram. Data error bars are mean ± SD. The statistical analyse of growth curve is Two-way ANOVA, survival curve is Log-rank test, the others are Student’s two-tailed unpaired t-test. The images of mice elements and the schematic diagram of graphical abstract were drawn by Figdraw. Source data are provided as a Source Data file.

References

    1. Bray, F. et al. Global cancer statistics 2022: GLOBOCAN estimates of incidence and mortality worldwide for 36 cancers in 185 countries. CA Cancer J. Clin.74, 229–263 (2024). - PubMed
    1. Li, Y. et al. Targeting MS4A4A on tumour-associated macrophages restores CD8+ T-cell-mediated antitumour immunity. Gut72, 2307–2320 (2023). - PMC - PubMed
    1. Vilar, E. & Gruber, S. B. Microsatellite instability in colorectal cancer-the stable evidence. Nat. Rev. Clin. Oncol.7, 153–162 (2010). - PMC - PubMed
    1. Goldstein, J. et al. Multicenter retrospective analysis of metastatic colorectal cancer (CRC) with high-level microsatellite instability (MSI-H). Ann. Oncol.25, 1032–1038 (2014). - PMC - PubMed
    1. Kather, J. N., Halama, N. & Jaeger, D. Genomics and emerging biomarkers for immunotherapy of colorectal cancer. Semin Cancer Biol.52, 189–197 (2018). - PubMed

MeSH terms