. 2025 Jul 1;10(1):32.
doi: 10.1038/s41536-025-00418-x.

Single cell transcriptomics of human kidney organoid endothelium reveals vessel growth processes and arterial maturation upon transplantation

Affiliations

Single cell transcriptomics of human kidney organoid endothelium reveals vessel growth processes and arterial maturation upon transplantation

Marije Koning et al. NPJ Regen Med. .

Abstract

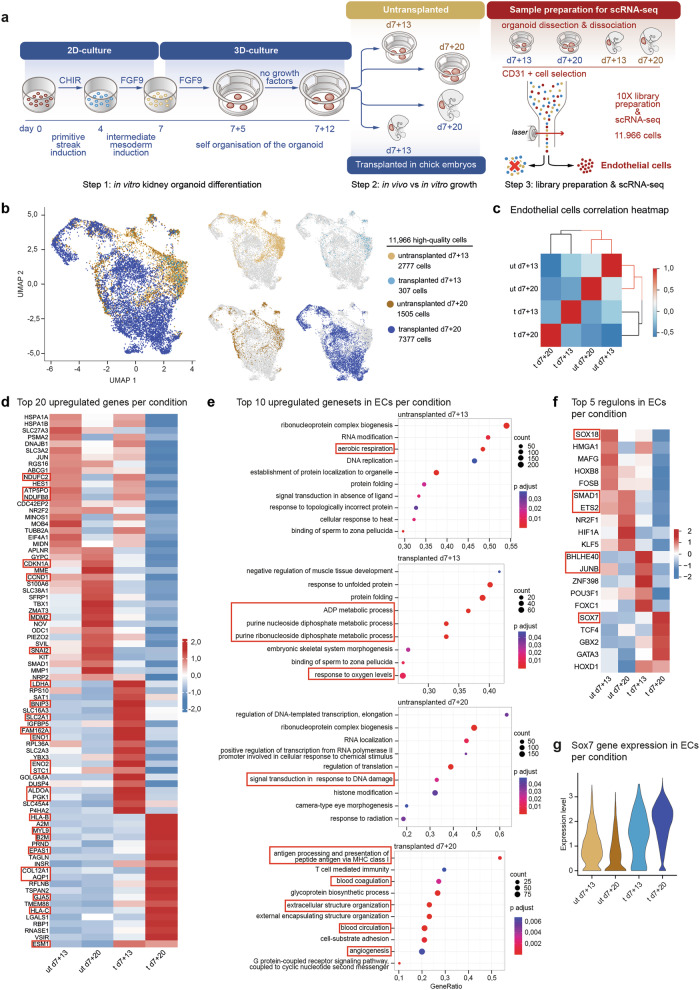
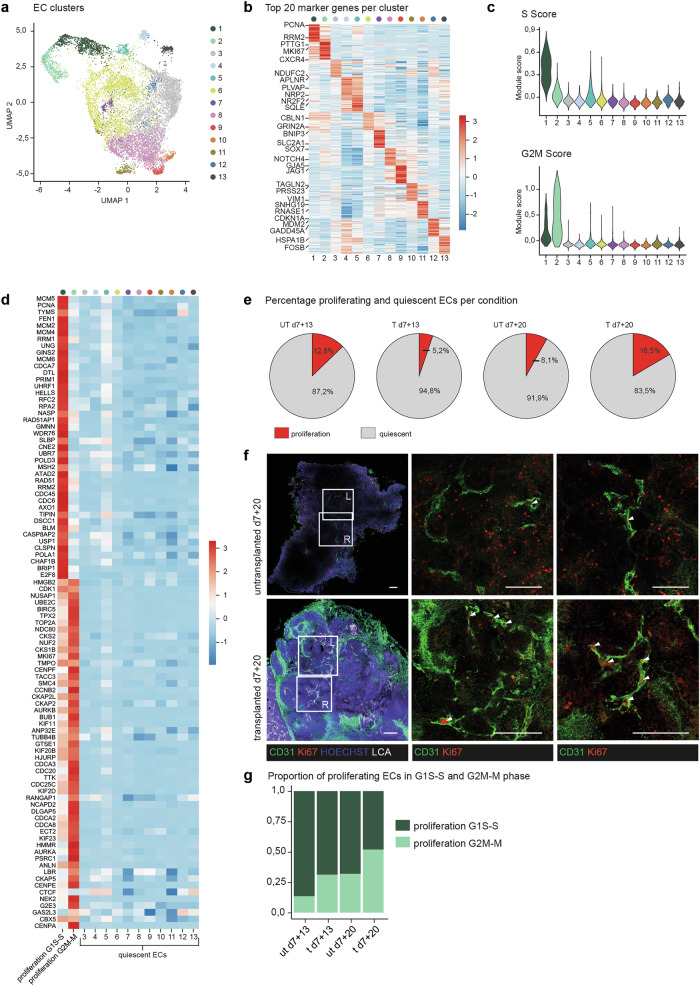
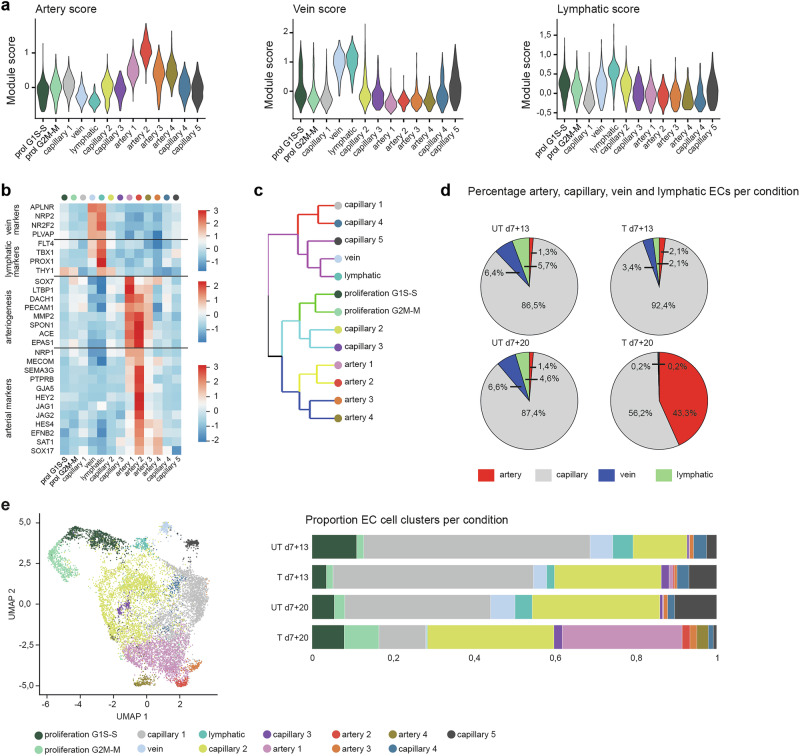
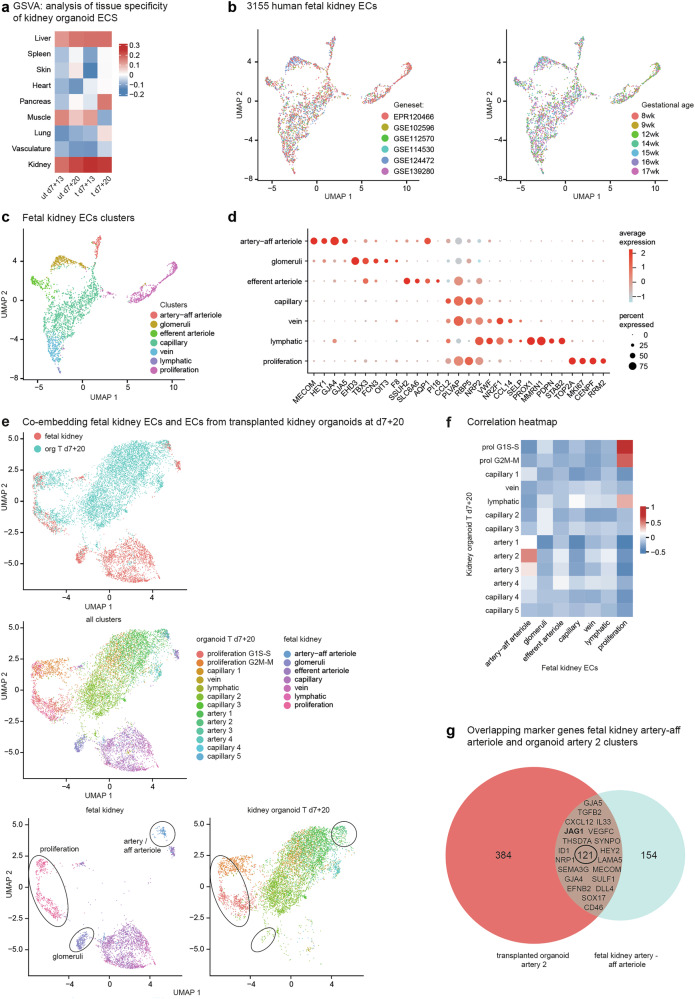
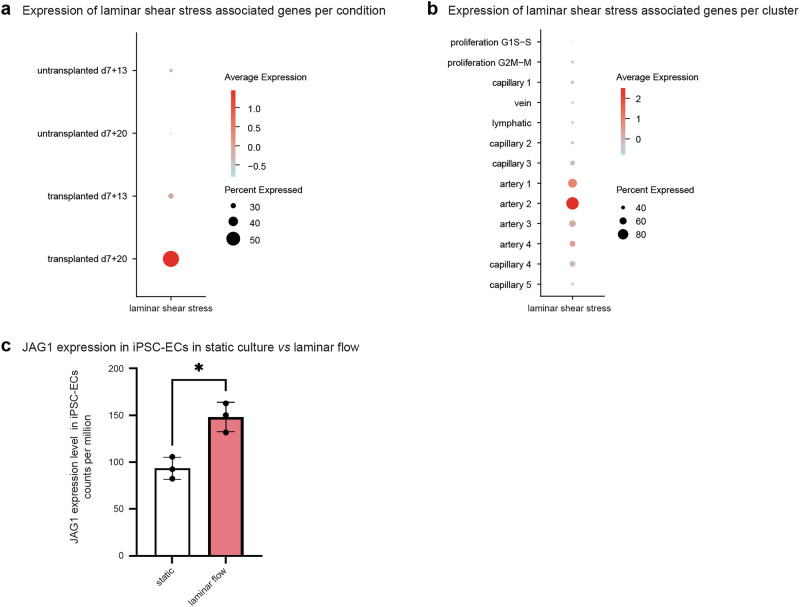
Kidney organoids derived from human induced pluripotent stem cells lack a proper vasculature, hampering their applicability. Transplantation prevents the loss of organoid endothelial cells (ECs) observed in vitro, and promotes vascularization. In this study, we transplanted kidney organoids in chicken embryos and deployed single-cell RNA sequencing of ~12,000 organoid ECs to delineate their molecular landscape and identify key changes associated with transplantation. Transplantation significantly altered EC phenotypic composition. Consistent with angiogenesis, proliferating EC populations expanded 8 days after transplantation. Importantly, ECs underwent a major vein-to-arterial phenotypic shift. One of the transplantation-specific arterial EC populations, characterized by laminar shear stress response and Notch signalling, showed a similar transcriptome as human fetal kidney arterial/afferent arteriolar ECs. Consistently, transplantation-induced transcriptional changes involved proangiogenic and arteriogenic SOX7 transcription factor upregulation and regulon enrichment. These findings point to blood flow and candidate transcription factors such as SOX7 as possible targets to enhance kidney organoid vascularization.


Conflict of interest statement

Competing interests: The authors declare no competing interests.

Figures

Fig. 1
Fig. 1. scRNAseq of enriched ECs from untransplanted and transplanted kidney organoids.
a Workflow of step 1: kidney organoid differentiation from hiPSCs, step 2: in vitro culture versus intracoelomic transplantation in chicken embryos, and step 3: organoid collection, dissociation to single cells, endothelial cell enrichment and scRNAseq. b UMAP visualization of a total of 11,966 high-quality human endothelial cells obtained from untransplanted (2777 cells from d7 + 13, 1505 from d7 + 20) and transplanted (307 cells from d7 + 13, 7377 from d7 + 20) kidney organoids, color-coded by condition. c Heatmap visualization of similarity analysis of ECs from the different conditions. ECs from each condition had unique transcriptome profiles but showed a higher similarity based on transplantation conditions than timepoints. Scale: z-score of the gene expression level. Abbreviations: ut untransplanted, t transplanted. d Expression-level scaled heatmap of the top 20 upregulated genes per condition. Highlighted genes are discussed in the text. Scale: z-score of the gene expression level. e Top 10 upregulated gene sets in ECs for each condition. Dot size indicates proportion of cells expressing a gene. Color intensity indicates the level of expression. Highlighted gene sets are discussed in the text. f Top 5 upregulated regulons in ECs for each condition, generated by transcription factor inference analysis conducted using the SCENIC method. Highlighted regulons are discussed in the text. Scale: z-score of the regulon enrichment score. g Violin plot visualization of the expression level of the SOX7 gene in ECs from the different conditions.
Fig. 2
Fig. 2. Endothelial cell proliferation is sustained after transplantation.
a UMAP visualization of a total of 11,966 high-quality human endothelial cells obtained from untransplanted (2777 cells from d7 + 13, 1505 from d7 + 20) and transplanted (307 cells from d7 + 13, 7377 from d7 + 20) kidney organoids, color-coded by cluster (n = 13). b Expression-level scaled heatmap of the top 20 marker genes per EC cluster. Scale = z-score of the gene expression level. c Violin plots depicting Module scores for S phase (top) and G2M phase (bottom) of the cell cycle for each EC cluster. Cluster 1 displayed the highest S module score, whereas cluster 2 had the highest G2M module score. Cluster 3–13 had low S and G2M scores. d Expression- level scaled heatmap of genes associated with proliferation per EC cluster. Cluster 1 and 2 express proliferation genes, with cluster 1 expressing genes associated with G1S-S phase and cluster 2 expressing genes associated with G2M-M phase. Cluster 3–13 did not express proliferation genes and were classified as quiescent EC clusters. Scale = z-score of the gene expression level. e Pie charts of the percentage of proliferating (red) and quiescent (gray) ECs per condition. The percentage of proliferating ECs is highest in transplanted day 7 + 20 organoids. f Immunofluorescent images of untransplanted day 7 + 20 (top) and transplanted d7 + 20 (bottom) kidney organoids, stained for human CD31 (green) ki67 (red) and HOECHST. Injected LCA (white) is visible in the transplanted organoid. In untransplanted organoids, few proliferating endothelial cells (CD31 + , ki67 + , arrowheads) can be identified, whereas in transplanted organoids, they appear more abundant. Scale bar: 100 µm. Images are based on 3 separate experiments. g Bar graph depicting the proportion of proliferating ECs in G1S-S (dark green) and G2M-M (light green) phase per condition.
Fig. 3
Fig. 3. Kidney organoids contain venous, lymphatic, arterial and capillary ECs and transplantation induces a switch from venous to arterial phenotype.
a Violin plots depicting artery (left), vein (middle) and lymphatic (right) module scores for each EC cluster. 4 artery clusters (artery 1-4), 1 vein cluster, 1 lymphatic cluster and 5 capillary clusters can be distinguished. b Expression-level scaled heatmap of vein, lymphatic, arteriogenesis and arterial markers per EC cluster. Scale: z-score of the gene expression level. c Hierarchical clustering of EC clusters, color-coded according to p-value from multiscale bootstrap resampling analysis on all highly variable genes. d Pie charts of the percentage of artery (red), capillary (gray), vein (blue) and lymphatic (green) ECs per condition. There is a large increase in the percentage of arterial ECs in transplanted day 7 + 20 organoids, while vein, lymphatic and capillary ECs are reduced in this condition. e Relative cluster quantification for each condition, showing a significant decrease in capillary 1 and 5 clusters and a significant increase in artery cluster 1,2 and 4 in transplanted day 7 + 20 organoids compared to the other conditions (untransplanted and transplanted d7 + 13 and untransplanted d7 + 20).
Fig. 4
Fig. 4. Kidney organoid artery and proliferating ECs resemble fetal kidney ECs.
a Heatmap of the geneset variation analysis scores of tissue EC marker genes in ECs from the different kidney organoid conditions. Scale: geneset variation analysis score. b UMAP visualization of a total of 3155 fetal kidney ECs from publicly available scRNAseq datasets from week 8–17 of gestation, color-coded by dataset (left) and gestational age (right). c UMAP visualization of the fetal kidney EC dataset, color-coded by EC subcluster. 7 clusters could be distinguished: artery-afferent arteriole, glomeruli, efferent arteriole, capillary, vein, lymphatic and proliferation. d Dot plot representing marker gene expression in fetal kidney EC clusters. Dot size indicates proportion of cells in cluster expressing a gene, color intensity indicates the level of expression. e UMAP visualization of fetal kidney ECs and ECs from transplanted kidney organoids at day 7 + 20, color-coded by origin (top), and cluster (bottom). f Heatmap visualization of the correlation between the different kidney organoid EC clusters and the fetal kidney EC clusters. The organoid proliferation clusters show high similarity to fetal kidney proliferating ECs, and the organoid artery 2 cluster correlates with the fetal kidney artery-afferent arteriole cluster. Scale: correlation coefficient. g Venn diagram displaying the overlap between marker genes for transplanted organoid artery 2 ECs and fetal kidney artery-afferent arteriole ECs: These clusters have 121 overlapping marker genes.
Fig. 5
Fig. 5. Upregulation of laminar shear stress associated genes in artery clusters.
a Dot plot representing expression of laminar shear stress associated genes in organoid ECs per condition. ECs from transplanted organoids at day 7 + 20 show the highest expression. Dot size indicates proportion of cells in cluster expressing laminar shear stress associated genes, color intensity indicates the level of expression. b Dot plot representing expression of laminar shear stress associated genes in organoid ECs per subcluster. ECs from artery cluster 2 show the highest expression. Dot size indicates proportion of cells in cluster expressing laminar shear stress associated genes, color intensity indicates the level of expression. c Bar graph showing the expression of JAG1 in iPSC-derived ECs cultured under static conditions (white) or under laminar flow for 4 days. JAG1 expression is upregulated in ECs under laminar flow.

Similar articles

References

    1. Dumas, S. J. Single-cell RNA sequencing reveals renal endothelium heterogeneity and metabolic adaptation to water deprivation. JASN 31, 118–138 (2019). - PMC - PubMed
    1. Molema, G. & Aird, W. C. Vascular heterogeneity in the kidney. Semin. Nephrol.32, 145–155 (2012). - PubMed
    1. Jourde-Chiche, N. et al. Endothelium structure and function in kidney health and disease. Nat. Rev. Nephrol.10.1038/s41581-018-0098-z (2019). - PubMed
    1. Brunskill, E. W. et al. Genes that confer the identity of the renin cell. J. Am. Soc. Nephrol.22, 2213–2225 (2011). - PMC - PubMed
    1. van den Berg, C. W. et al. Renal subcapsular transplantation of PSC-derived kidney organoids induces neo-vasculogenesis and significant glomerular and tubular maturation in vivo. Stem Cell Rep.10, 751–765 (2018). - PMC - PubMed

LinkOut - more resources