. 2025 Jul 1;11(1):122.
doi: 10.1038/s41522-025-00744-4.

Microfluidics unveils role of gravity and shear stress on Pseudomonas fluorescens motility and biofilm growth

Affiliations

Microfluidics unveils role of gravity and shear stress on Pseudomonas fluorescens motility and biofilm growth

Daniele Marra et al. NPJ Biofilms Microbiomes. .

Abstract

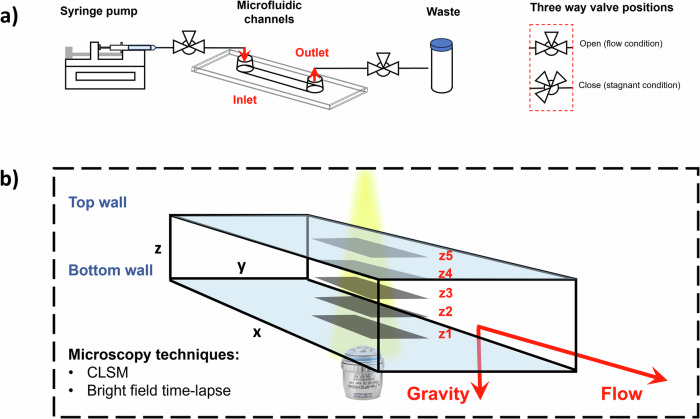
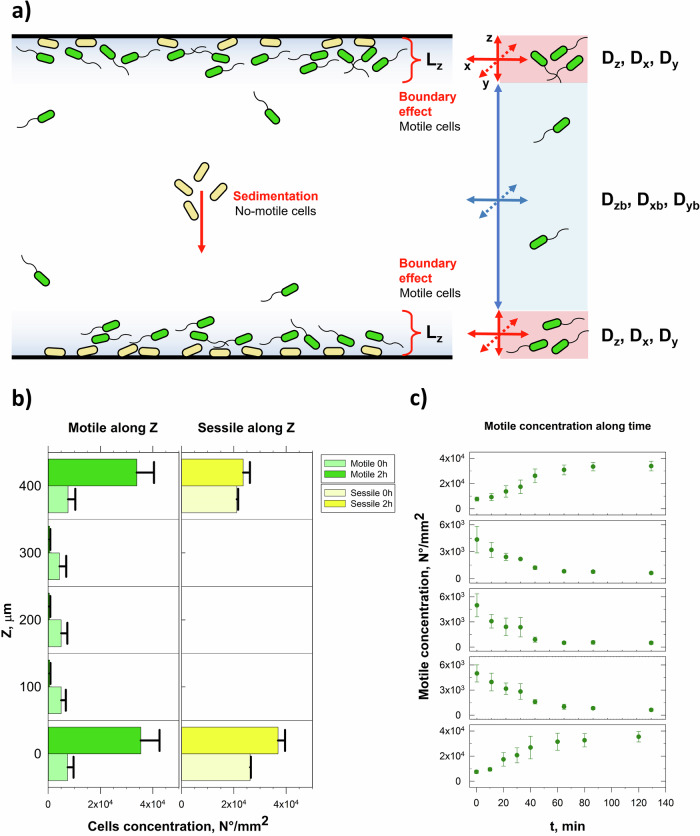
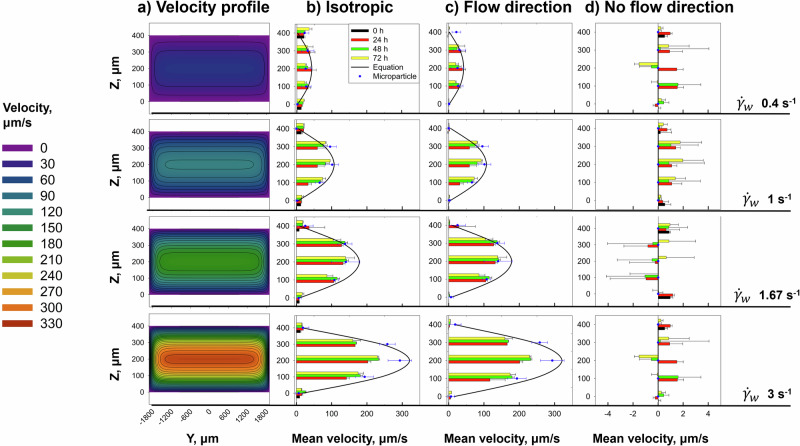
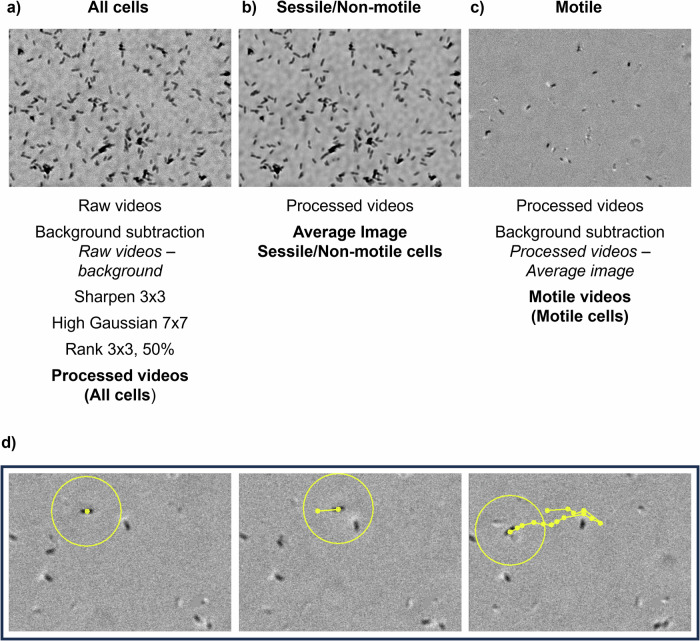
Biofilm proliferation in confined environments is a challenge in biomedical, industrial, and space applications. Surfaces in contact with fluids experience varying bulk stresses due to flow and gravity, factors often overlooked in biofilm studies. This research quantifies the combined effect of gravity and shear stress on Pseudomonas fluorescens SBW25 motility and biofilm growth. Using a rectangular-section microfluidic channel under laminar flow, we compared top and bottom surfaces, where gravity either pulls bacteria away or pushes them toward the surface. Results revealed an asymmetric bacterial distribution, leading to varying surface cell densities and contamination levels. We also analyzed spatial reorganization over time and classified bacterial motility under flow. Findings show that external mechanical stresses influence both motility and biofilm morphology, impacting biocontamination patterns based on shear stress and gravity direction. This study provides insights into biofilm control strategies in diverse environments.


Conflict of interest statement

Competing interests: The authors declare no competing interests.

Figures

Fig. 1
Fig. 1. Schematic representation of the experimental setup used throughout this study.
a The system is composed by a syringe pump, a commercial microfluidic channel (z = 0.4 mm, x = 17 mm, and y = 3.8 mm), and a tank of collection; details about components are reported in the method section. Bacterial were inoculated in stagnant conditions for 2 h before initiating flow imposing a fixed flow rate by the syringe pump. b The cartoon reports the microfluidic channel where sample was imaged in bright field time lapse at five different focal planes: channel bottom wall z1 (0 μm), z2 (100 μm), half-height channel z3 (200 μm), z4 (300 μm), channel top wall z5 (400 μm). CLSM z stack were acquired after sample staining, at the end of each experiment for bottom and top walls.
Fig. 2
Fig. 2. Spatial and time dependent bacterial distribution in a confined stagnant environment.
a Illustration of bacterial spatial distribution in the microfluidic channel. Motile bacteria, in green, experience a trapping effect at channel walls due to the boundary layer effect, while non-motile bacteria, in yellow, slowly sediment at the bottom of the channel. We reported as Lz the characteristic depth of the layer where cell experience the trapping effect, and we distinguished the different diffusivity coefficient near the wall and in the middle of the channel. b Spatial distribution of bacterial density at inoculum and after 2 h in stagnant conditions in a microfluidic channel. The x-axis represents bacterial density in number per square millimetre, while the height is measured relative to reference points in the microfluidic channel. The maximum height (400 μm) corresponds to the top layer z5, and 0 μm represents the bottom layer z1. Motile bacteria are depicted in green, appearing light at time 0 and dark after 2 h. Non-motile bacteria on the surface are shown in yellow, appearing light at time 0 and dark after 2 h. c Temporal evolution of bacterial density over 0 to 2 h corresponding to the layers visualized in graph A. Accumulation of bacteria is observed at the surfaces of the layers, while a depletion is noticeable in the middle layers of the channel.
Fig. 3
Fig. 3. Velocity profile analysis in a rectangular microfluidic channel.
a Contour plots representing the theoretical velocity profiles calculated using the Cornish equation. Each row corresponds to a different shear rate value indicated by the black lines headers, while the colour legend is provided on the left side. b Average velocity values calculated fixing the y position at 0 μm at the centre of the channel where lateral wall effect on flow is negligible. The theoretical values are represented with the continuous black line, microparticles velocities are in blue, and bacterial velocities at various time points are represented by histograms. c Velocity of average cell displacement along the x-flow direction. Data are reported with the same legend of column b. d Velocity of average cell displacement in the direction orthogonal to the flow. Data are reported with the same legend of column b.
Fig. 4
Fig. 4. Motility coefficient on top and bottom channel wall.
Motility coefficient μ, analogous to Fick’s diffusion coefficient, calculated for the bottom (in black) and top (in red) surfaces of the microfluidic channel at various flow hours. Each row represents different shear rate values imposed. a The first column reports isotropic motility coefficient, calculated according to Eq. 7. b Analysis of the same trajectories as plotted in column A, focusing on the MSD along the x-axis (flow direction) only. c Analysis of the same trajectories as plotted in column A, considering the Mean Squared Displacement (MSD) along the y-axis (orthogonal to the flow direction) only.
Fig. 5
Fig. 5. Bacterial motility coefficient and surface cell concentration on top and bottom surfaces.
Relationship between bacterial motility (μ\muμ) and surface cell concentration (cells/mm²) for the top (red) and bottom (black) walls of the microfluidic channel. A decreasing trend in motility is observed as cell density increases, confirming that overcrowding hampers bacterial movement. This effect is more pronounced at the bottom wall, where gravity-driven sedimentation results in higher local cell accumulation. Dashed vertical grey lines indicate the estimated surface cell densities after 2 h under stagnant conditions.
Fig. 6
Fig. 6. Biofilm growth at the top and bottom walls for different flow conditions.
a The top row displays 3D reconstructions obtained in Paraview from z-stack images of the biofilm grown at various investigated shear rates (γ˙w 1.67 was omitted), colorimetric scale bar depicting biofilm thickness in μm was reported on the left. In the second raw images of a single field of view depicting the biofilm growth on the top surface. In the third row, images of biofilm growth at the bottom surface. b Biovolume (μm³/μm²) of the biofilm measured at the top (in blue) and bottom (in red) walls as a function of shear rate (γ˙w, s⁻¹). Box plots illustrate the statistical distribution of biovolume values, showing an increase in biofilm growth with shear rate up to γ˙w 10 s⁻¹, followed by a decrease at higher shear rates. Biofilm growth is more pronounced on the bottom wall compared to the top. c Substratum coverage (A.U.) at the top (in blue) and bottom (in red) walls as a function of shear rate (γ˙w, s⁻¹). Substratum coverage follows a similar trend to biovolume, increasing with shear rate up to γ˙w 1 s⁻¹ before decreasing. The bottom surface exhibits a higher biofilm coverage than the top surface, indicating an asymmetrical biofilm development influenced by gravity.
Fig. 7
Fig. 7. Image processing workflow used to differentiate sessile/non-motile cells from motile bacteria in video recordings.
a Single frame from a processed video. Starting from the raw video (250 frames), the image processing procedure is outlined. Following the described steps, a background image was subtracted from the raw video, and several morphological filters were applied to enhance cell visibility: a sharpening filter (3 × 3), high Gaussian filtering (7 × 7), and a rank filter (3 × 3, 50%). The resulting image is shown. b Average Image. Average image of the processed videos, representing sessile/non-motile cells. The resulting image reports cells that remain in a fixed position over all video duration. c) Single frame from a video including only motile cells. Motile bacteria are identified by subtracting the average image (Panel b) from the processed videos. The resulting motile videos reveal only actively moving cells. Tracking algorithm representation. Example of a bacterial cell tracking was the research area between the first and second frames is described by the yellow circle. Iterating this procedure, the trajectories is acquired over time. Numerical parameters are described in the Materials and Methods section.

References

    1. Hall-Stoodley, L., Costerton, J. W. & Stoodley, P. Bacterial biofilms: from the natural environment to infectious diseases. Nat. Rev. Microbiol.2, 95–108 (2004). - PubMed
    1. Azeredo, J. et al. Critical review on biofilm methods. Crit. Rev. Microbiol.43, 313–351 (2017). - PubMed
    1. Høiby, N. et al. ESCMID guideline for the diagnosis and treatment of biofilm infections 2014. Clin. Microbiol. Infect.21, S1–S25 (2015). - PubMed
    1. Novikova, N. D. Review of the knowledge of microbial contamination of the Russian manned spacecraft. Microb. Ecol.47, 127–132 (2004). - PubMed
    1. Penesyan, A., Paulsen, I. T., Gillings, M. R., Kjelleberg, S. & Manefield, M. J. Secondary effects of antibiotics on microbial biofilms. Front. Microbiol.11, 2109 (2020). - PMC - PubMed

MeSH terms

LinkOut - more resources