Comparative Study
. 2025 Jul 1;16(1):6003.
doi: 10.1038/s41467-025-61054-z.

Proteomic analysis of Down syndrome cerebrospinal fluid compared to late-onset and autosomal dominant Alzheimer´s disease

Affiliations
Comparative Study

Proteomic analysis of Down syndrome cerebrospinal fluid compared to late-onset and autosomal dominant Alzheimer´s disease

Laia Montoliu-Gaya et al. Nat Commun. .

Abstract

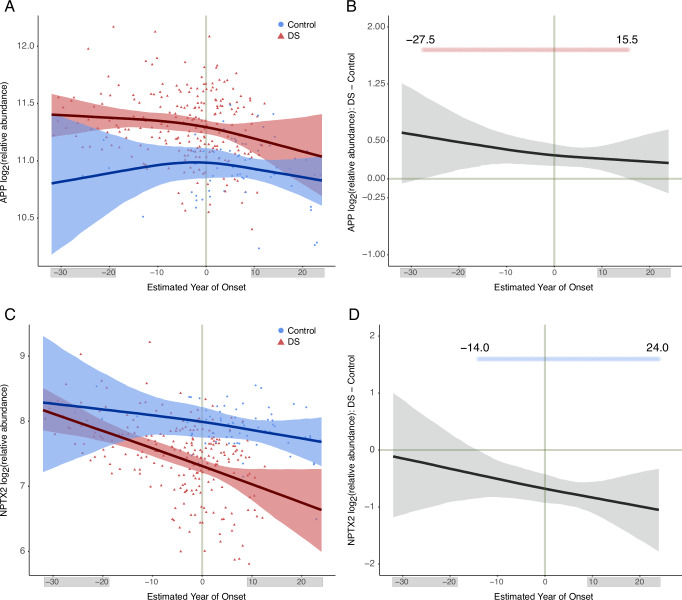
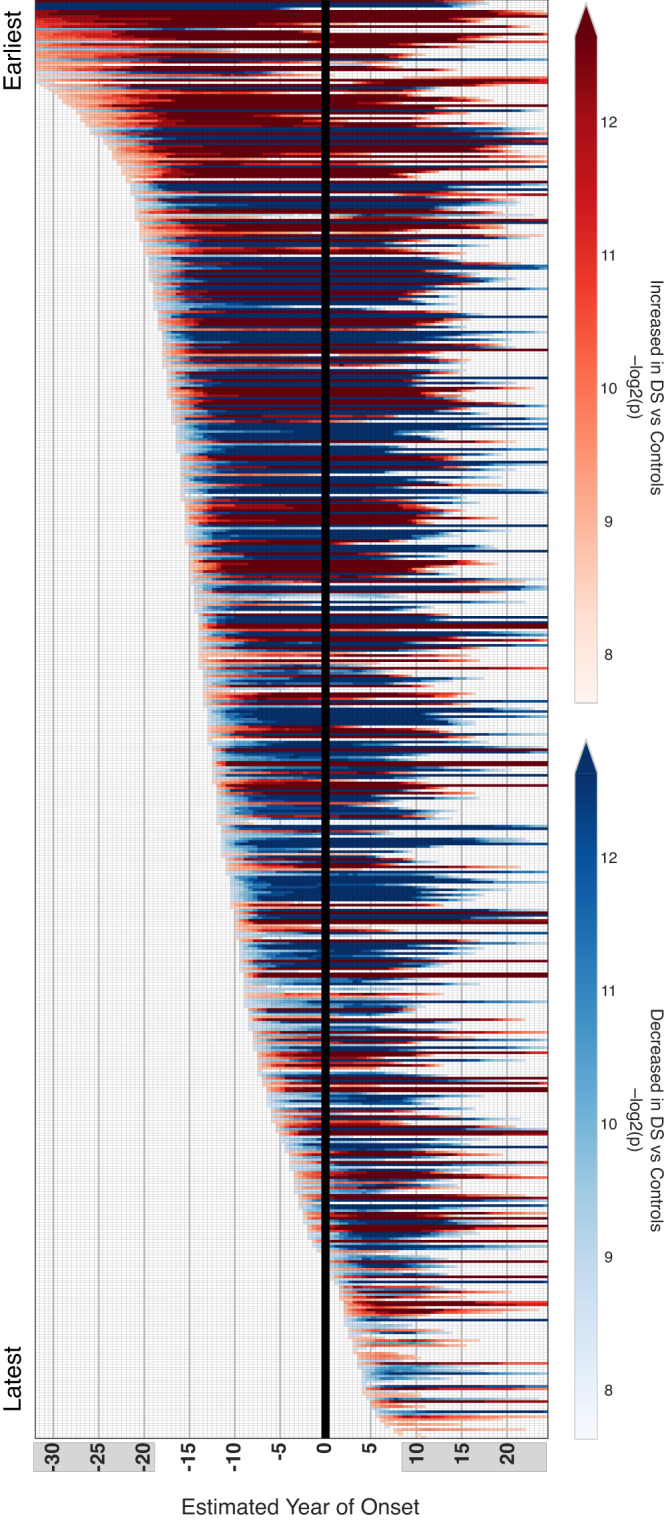
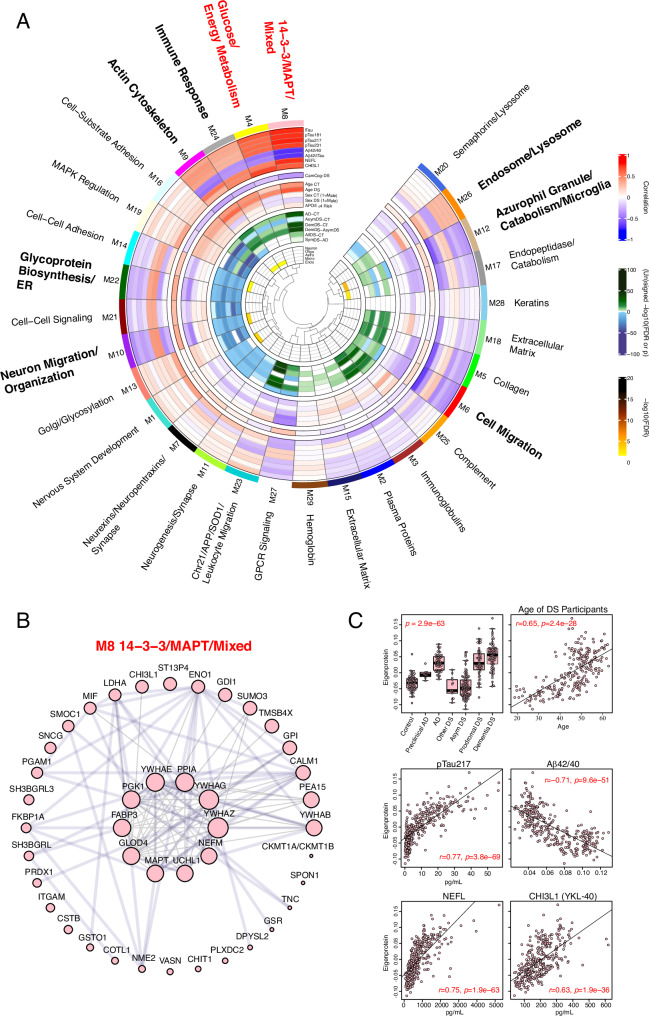
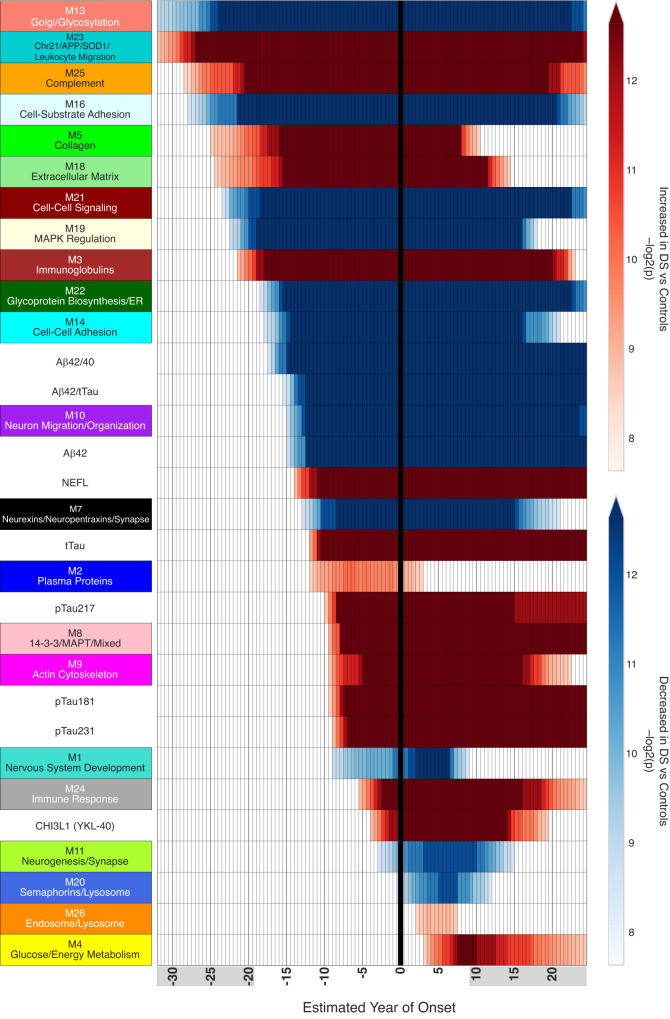
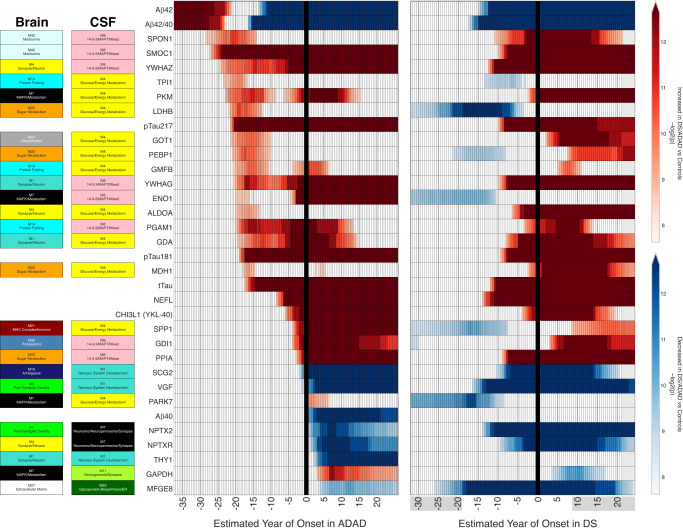
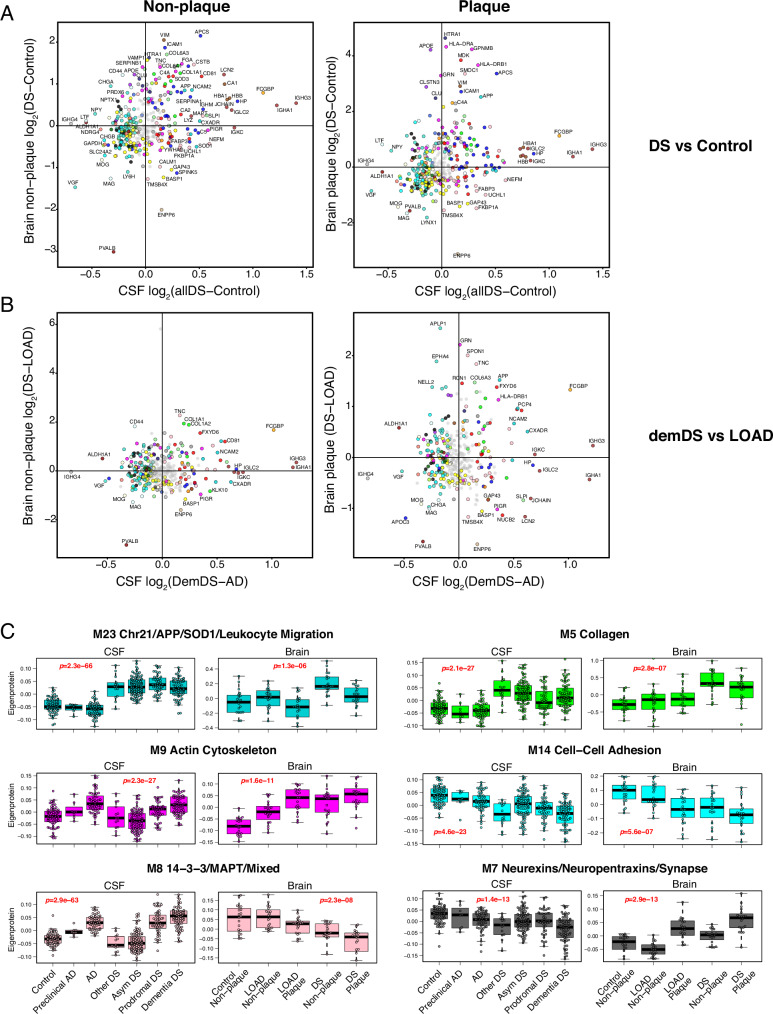
Almost all individuals with Down Syndrome (DS) develop Alzheimer's disease (AD) by mid to late life. However, the degree to which AD in DS shares pathological changes with sporadic late-onset AD (LOAD) and autosomal dominant AD (ADAD) beyond core AD biomarkers such as amyloid-β (Aβ) and tau is unknown. Here, we used proteomics of cerebrospinal fluid from individuals with DS (n = 229) in the Down Alzheimer Barcelona Neuroimaging Initiative (DABNI) cohort to assess the evolution of AD pathophysiology from asymptomatic to dementia stages and compared the proteomic biomarker changes in DS to those observed in LOAD and ADAD. Although many proteomic alterations were shared across DS, LOAD, and ADAD, DS demonstrated more severe changes in immune-related proteins, extracellular matrix pathways, and plasma proteins likely related to blood-brain barrier dysfunction compared to LOAD. These changes were present in young adults with DS prior to the onset of Aβ or tau pathology, suggesting they are associated with trisomy 21 and may serve as risk factors for DSAD. DSAD showed an earlier increase in markers of axonal and white matter pathology and earlier changes in markers potentially associated with cerebral amyloid angiopathy compared to ADAD. The unique features of DSAD may have important implications for treatment strategies in this population.


Conflict of interest statement

Competing interests: E.C.B.J. has served on an advisory board for Eli Lilly and has received royalties from EmTheraPro (outside submitted work). J.F. reported receiving personal fees for service on the advisory boards, adjudication committees or speaker honoraria from AC Immune, Adamed, Alzheon, Biogen, Eisai, Esteve, Fujirebio, Ionis, Laboratorios Carnot, Life Molecular Imaging, Lilly, Lundbeck, Perha, Roche and outside the submitted work. O.B., D.A., A.L., and J.F. report holding a patent for markers of synaptopathy in neurodegenerative disease (WO2019175379, applicant Fundació Institut de Recerca de L’hospital de la Santa Creu, Sant Pau, “Markers of synaptopathy in neurodegenerative diseases”, EP19709749.6, priority date 16/3/2018, patent pending, inventors O Belbin, A Lleó, A Bayés, J Fortea, and D Alcolea, licensed to ADX NeuroSciences, N.V. EPI8382175.0 to develop antibodies and immunoassays for Calsyntenin-1, GluR2, GluR4, Neuroligin-2, neurexin-2a, neurexin-3a, syntaxin-1b, thy-1, tenascin-r, and vamp-2). N.T.S. and A.I.L. are founders of EmTheraPro (outside submitted work). H.Z. has served at scientific advisory boards and/or as a consultant for Abbvie, Acumen, Alector, Alzinova, ALZPath, Annexon, Apellis, Artery Therapeutics, AZTherapies, Cognito Therapeutics, CogRx, Denali, Eisai, Nervgen, Novo Nordisk, Optoceutics, Passage Bio, Pinteon Therapeutics, Prothena, Red Abbey Labs, reMYND, Roche, Samumed, Siemens Healthineers, Triplet Therapeutics, and Wave, has given lectures in symposia sponsored by Cellectricon, Fujirebio, Alzecure, Biogen, and Roche, and is a co-founder of Brain Biomarker Solutions in Gothenburg AB (BBS), which is a part of the GU Ventures Incubator Program (outside submitted work). K.B. has served as a consultant, on advisory boards, or at data monitoring committees for Abcam, Axon, BioArctic, Biogen, and JOMDD/Shimadzu. Julius Clinical, Lilly, MagQu, Novartis, Ono Pharma, Pharmatrophix, Prothena, Roche Diagnostics, and Siemens Healthineers, and is a co-founder of Brain Biomarker Solutions in Gothenburg AB (BBS), which is a part of the GU Ventures Incubator Program, outside the work presented in this paper. T.W. has served as a consultant or on data monitoring committees for Acumen, Biogen, Grifols, Lilly and ProMIS Neurosciences. The remaining authors declare no competing interests.

Figures

Fig. 1
Fig. 1. Modeling of APP and NPTX2 protein levels in DS CSF by estimated year of symptom onset.
A, B Levels of the amyloid precursor protein (APP), located on chromosome 21, in DS (red) and control (blue) cerebrospinal fluid (CSF) (A), and the difference in APP levels between DS and controls (B), by estimated year of symptom onset (EYO). One outlier was removed from A for visualization purposes. C, D CSF levels of neuronal pentraxin-2 (NPTX2), a synaptic protein, in DS and controls (C), and the difference between NPTX2 levels in DS and controls (D). Two outliers were removed from C for visualization purposes. Solid lines indicate the mean protein level; shaded areas indicate the 99% credible interval. Periods of significant difference between DS and controls are highlighted in (B, D) (red indicates significantly increased levels in DS, blue indicates significantly decreased levels in DS). Shaded EYO values on the x-axis indicate periods of lower confidence estimates due to the smaller number of participants over the indicated EYO range. Plots for other proteins are provided in the Supplementary Information.
Fig. 2
Fig. 2. Individual protein changes in DS by EYO.
556 out of 838 CSF proteins analyzed had different levels in DS at any EYO. Differences were assessed in 0.5 EYO intervals. Red indicates increased levels in DS and blue indicates decreased levels in DS. Heat indicates the significance of the difference between DS and controls, with scale provided in the arrows on the right. The vertical black line highlights EYO = 0 (age 50.2). Shaded EYO values on the x-axis indicate periods of lower confidence estimates, including after EYO = 10, where DS data were sparse and therefore only proteins with strong differences are considered significant. Periods of significant change and direction of change for all 556 significant proteins and other CSF ELISA measurements are provided in Supplementary Fig. 2 and Supplementary Data 2. About 266 proteins were increased and 294 proteins were decreased across EYO, with five proteins showing mixed direction of change. Visualization of proteins separated by direction of change in DS is provided in Supplementary Fig. 3. Empirical p values were computed within a Bayesian analysis framework. All tests were two-sided with a pre-specified significance level of 0.01, corresponding to tail probabilities of 0.005 and 0.995. No multiple testing correction was applied.
Fig. 3
Fig. 3. DSAD CSF protein co-expression network.
AC About 1116 proteins measured across control, DS, and AD cases were used to construct a CSF protein co-expression network (A). Modules were annotated with their primary ontologies. Module eigenproteins were correlated to CSF total tau (tTau), pTau181, pTau217, pTau231, Aβ42/40, Aβ42/tTau, neurofilament light polypeptide (NEFL), chitinase-3-like protein 1 (CHI3L1), CamCog score (higher scores reflect better cognitive function in DS), age of controls (CT), age of DS cases, sex in CT (1 = male), sex in DS (1 = male), and APOE ε4 risk (ε2/2 = –2, ε4/4 = +2). Red indicates positive correlation; blue indicates negative correlation. Differences in module eigenprotein levels were assessed between AD and control (AD-CT), asymptomatic DS and control (AsymDS-CT), demented DS and control (DemDS-CT), demented DS and asymptomatic DS (DemDS-AsymDS), all DS and control (allDS-CT), and symptomatic DS (prodromal and demented) and AD (SymDS-AD) using a two-sided t-test without correction for multiple comparisons. Green indicates increased levels; blue indicates decreased levels. Brain cell type enrichment in each module was performed for neurons, oligodendrocytes (oligo), astrocytes (astro), microglia (micro), and endothelia (endo) using one-tailed Fisher’s exact test with Benjamini–Hochberg correction. Only cell type overlaps that reached statistical significance are colored. Module ontologies highlighted in bold demonstrated strong associations with AD traits, with modules highlighted in red showing the strongest associations. Module protein memberships are provided in Supplementary Data 5. Heatmap values are provided in Supplementary Data 6. B Protein members of the M8 14-3-3/MAPT/Mixed module, which was the module most strongly correlated to CSF AD biomarkers. Circle size indicates the strength of correlation to the module eigenprotein. Transparent blue lines represent human protein-protein interactions as provided in the BioGRID database. Gray lines represent top-ranked co-expression network edges. C Differences in M8 eigenprotein levels among groups (boxplot; control n = 72, preclinical AD n = 8, AD n = 56, other DS n = 14, Asym DS n = 96, prodromal DS n = 47, dementia DS n = 72), and correlation of the M8 eigenprotein to age in DS cases, CSF tau phosphorylated at residue 217 (pTau217), CSF amyloid-β 42/40 ratio (Aβ42/40), CSF neurofilament light polypeptide (NEFL) levels, and CSF chitinase-3-like protein 1 (CHI3L1, also known as YKL-40) levels. The difference between groups was assessed by one-way ANOVA and adjusted for age and sex. Correlations were performed using midweight bicorrelation. Boxplots represent the median, 25th, and 75th percentile extremes; thus, hinges of a box represent the interquartile range of the two middle quartiles of data within a group. The farthest data points up to 1.5 times the interquartile range away from box hinges define the extent of whiskers (error bars). Plots for other modules are provided in the Supplementary Information.
Fig. 4
Fig. 4. DSAD protein network module changes by EYO.
Module eigenproteins, representing the first principal component of module protein abundance, were assessed for changes in DS by EYO. Differences were assessed in 0.5 EYO intervals. 22 out of 29 modules were significantly different in DS at any EYO. Module changes were compared to standard amyloid, tau, and neurodegeneration (AT(N)) CSF AD biomarkers. Red indicates increased levels in DS and blue indicates decreased levels in DS. The vertical black line highlights EYO = 0 (age 50.2). Shaded EYO values on the x-axis indicate periods of lower confidence estimates. Periods of significant change and direction of change for each module and CSF ELISA measurement are provided in Supplementary Data 7. Empirical p values were computed within a Bayesian analysis framework. All tests were two-sided with a pre-specified significance level of 0.01, corresponding to tail probabilities of 0.005 and 0.995. No multiple testing correction was applied.
Fig. 5
Fig. 5. Comparison of individual protein measures between DS and ADAD.
Protein level differences between ADAD mutation carriers and non-carriers as described in ref. (left) and DS and euploid individuals (right) were modeled in the same fashion across EYO. Red indicates increased levels in ADAD and DS and blue indicates decreased levels in ADAD and DS. The vertical black line highlights EYO = 0. Shaded EYO values on the x-axis in DS indicate periods of lower confidence estimates. Each protein was mapped to its corresponding brain co-expression network module as described in ref. and DSAD CSF co-expression network module as shown in Fig. 3A. Colors for each module correspond to module numbers in each network (for example, M4 is yellow). Biomarker measurements that do not map to a module were measured using immunoassays. The progression of protein changes in DS were not the same as in ADAD. Empirical p values were computed within a Bayesian analysis framework. All tests were two-sided with a pre-specified significance level of 0.01, corresponding to tail probabilities of 0.005 and 0.995. No multiple testing correction was applied. ALDOA fructose-bisphosphate aldolase A, CHI3L1 chitinase-3-like protein 1, ENO1 alpha-enolase, GAPDH glyceraldehyde-3-phosphate dehydrogenase, GDA guanine deaminase, GDI1 rab GDP dissociation inhibitor alpha, GMFB glia maturation factor beta, GOT1 aspartate aminotransferase, cytoplasmic, LDHB L-lactate dehydrogenase B chain, MDH1 malate dehydrogenase, cytoplasmic, MFGE8 lactadherin, NEFL neurofilament light polypeptide, NPTX2 neuronal pentraxin-2, NPTXR neuronal pentraxin receptor, PARK7 Parkinson disease protein 7, PEBP1 phosphatidylethanoamine-binding protein 1, PGAM1 phosphoglycerate mutase 1, PKM pyruvate kinase PKM, PPIA peptidyl-prolyl cis-trans isomerase A, SCG2 secretogranin-2, SMOC1 SPARC-related modular calcium-binding protein 1, SPON1 spondin-1, SPP1 osteopontin, THY1 thy-1 membrane glycoprotein, TPI1 triosephosphate isomerase, VGF neurosecretory protein VGF, YWHAG 14-3-3 protein gamma, YWHAZ 14-3-3 protein zeta/delta.
Fig. 6
Fig. 6. Comparison of CSF and Brain Proteomic Changes in DS and LOAD.
CSF proteomic data were compared to localized brain proteomic data from Aβ plaque and non-plaque tissue in DS and LOAD. A CSF proteomic changes in all participants with DS (allDS) compared to control versus DS non-plaque tissue (left) and DS plaques (right) compared to control. B CSF proteomic changes in participants with dementia due to DSAD compared to LOAD versus DS non-plaque tissue (left) and DS plaques (right) compared to LOAD. Proteins that were significantly different in either CSF or brain at FDR <0.05 in each contrast are colored by the CSF network module in which they reside. (C) CSF network module eigenproteins were tested for differences in DS and LOAD brain tissue in both plaque and non-plaque regions (control n = 72, preclinical AD n = 8, AD n = 56, other DS n = 14, Asym DS n = 96, prodromal DS n = 47, dementia DS n = 72; n = 20 for each brain group). Differences in module eigenprotein by case status were assessed by Kruskal-Wallis one-way ANOVA. Boxplots represent the median, 25th, and 75th percentile extremes; thus, hinges of a box represent the interquartile range of the two middle quartiles of data within a group. The farthest data points up to 1.5 times the interquartile range away from box hinges define the extent of whiskers (error bars). Plots for other CSF network modules are provided in the Supplementary Information.

Similar articles

References

    1. Chen, L. et al. Global, regional, and national burden and trends of Down syndrome from 1990 to 2019. Front. Genet.13, 908482 (2022). - PMC - PubMed
    1. Hithersay, R. et al. Association of dementia with mortality among adults with Down syndrome older than 35 years. JAMA Neurol.76, 152–160 (2019). - PMC - PubMed
    1. McCarron, M. et al. A prospective 20-year longitudinal follow-up of dementia in persons with Down syndrome. J. Intellect. Disabil. Res.61, 843–852 (2017). - PubMed
    1. Iulita, M. F. et al. Association of Alzheimer disease with life expectancy in people with Down syndrome. JAMA Netw. Open5, e2212910 (2022). - PMC - PubMed
    1. Fortea, J. et al. Clinical and biomarker changes of Alzheimer’s disease in adults with Down syndrome: a cross-sectional study. Lancet395, 1988–1997 (2020). - PMC - PubMed

Publication types

LinkOut - more resources