

Multilocus analysis uncovers the evolution of the Rhodniini tribe, vectors of Trypanosoma cruzi
- PMID: 40595761
- PMCID: PMC12218322
- DOI: 10.1038/s41598-025-03789-9
Multilocus analysis uncovers the evolution of the Rhodniini tribe, vectors of Trypanosoma cruzi
Abstract
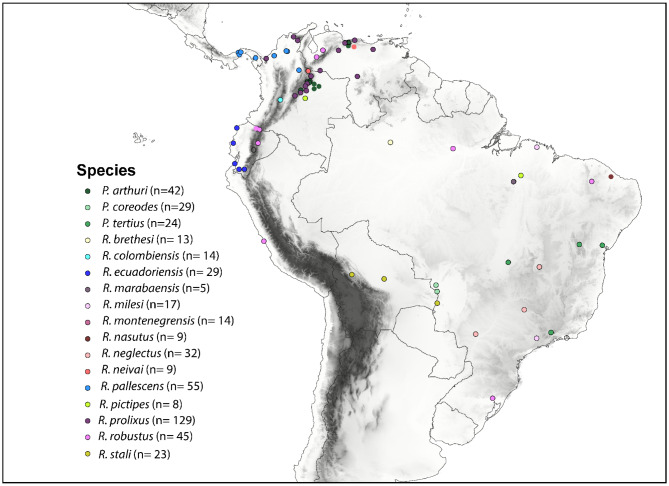
In this study, we investigate the origin and diversification of Trypanosoma cruzi vectors within the Rhodniini tribe (Triatominae subfamily) through phylogenetic analyses based on eight genes from 17 species and 497 specimens-the largest sampling of this tribe to date. Our results predominantly support the paraphyly of the genus Rhodnius, with the three Psammolestes species forming a well-supported monophyletic clade nested within it. In two reconstructions, however, Psammolestes and Rhodnius are recovered as reciprocally monophyletic, each with strong support. In Rhodnius, we find monophyletic pallescens and pictipes groups, but a paraphyletic prolixus group, with persistent phylogenetic discordances underscoring uncertainties in species placements. Divergence estimates suggest Rhodniini originated around 5.26 million years ago, notably more recent than previously thought. Evolution within the tribe appears shaped by geography, gene flow, and incomplete lineage sorting rather than traditional taxonomy. Only four species-P. arthuri, R. ecuadoriensis, R. neivai, and R. neglectus-are consistently supported across analyses, likely diversifying during Pleistocene climate changes. Other Rhodniini species may represent a panmictic population with minor structuring influenced by the Andes uplift. This study underscores the need for integrative research combining genetic, ecological, and biogeographical data to fully understand Rhodniini speciation and diversification.
Keywords: Psammolestes; Rhodnius; Chagas disease; Evolutionary history; Genetic structure; Insect vectors; Multilocus analysis; Phylogenetic analysis; Phylogenetic discordances; Pleistocene arc hypothesis; Population genetics; Rhodniini tribe; Speciation patterns; Vector-borne diseases.
© 2025. The Author(s).
Conflict of interest statement
Declarations. Competing interests: The authors declare no competing interests.
Figures


Similar articles
-
Allozyme relationships among ten species of Rhodniini, showing paraphyly of Rhodnius including Psammolestes.Med Vet Entomol. 2002 Mar;16(1):83-90. doi: 10.1046/j.0269-283x.2002.00343.x. Med Vet Entomol. 2002. PMID: 11963985
-
Phylogeny and molecular taxonomy of the Rhodniini derived from mitochondrial and nuclear DNA sequences.Am J Trop Med Hyg. 2000 Apr;62(4):460-5. doi: 10.4269/ajtmh.2000.62.460. Am J Trop Med Hyg. 2000. PMID: 11220761
-
Genetic, cytogenetic and morphological trends in the evolution of the Rhodnius (Triatominae: Rhodniini) trans-Andean group.PLoS One. 2014 Feb 3;9(2):e87493. doi: 10.1371/journal.pone.0087493. eCollection 2014. PLoS One. 2014. PMID: 24498330 Free PMC article.
-
Triatomine Fauna and Natural Infection by Trypanosoma (Schizotrypanum) cruzi (Kinetoplastea: Trypanosomatidae) in the Caribbean Region of Panama, Colombia, and Venezuela: A Systematic Review.Neotrop Entomol. 2025 Mar 19;54(1):46. doi: 10.1007/s13744-025-01254-w. Neotrop Entomol. 2025. PMID: 40106199
-
Over Six Thousand Trypanosoma cruzi Strains Classified into Discrete Typing Units (DTUs): Attempt at an Inventory.PLoS Negl Trop Dis. 2016 Aug 29;10(8):e0004792. doi: 10.1371/journal.pntd.0004792. eCollection 2016 Aug. PLoS Negl Trop Dis. 2016. PMID: 27571035 Free PMC article.
References
MeSH terms
Grants and funding
LinkOut - more resources
Full Text Sources
Medical
