. 2025 Jul 2;15(1):22893.
doi: 10.1038/s41598-025-05227-2.

Unveiling diagnostic biomarkers and therapeutic targets in lung adenocarcinoma using bioinformatics and experimental validation

Affiliations

Unveiling diagnostic biomarkers and therapeutic targets in lung adenocarcinoma using bioinformatics and experimental validation

Sixuan Wu et al. Sci Rep. .

Abstract

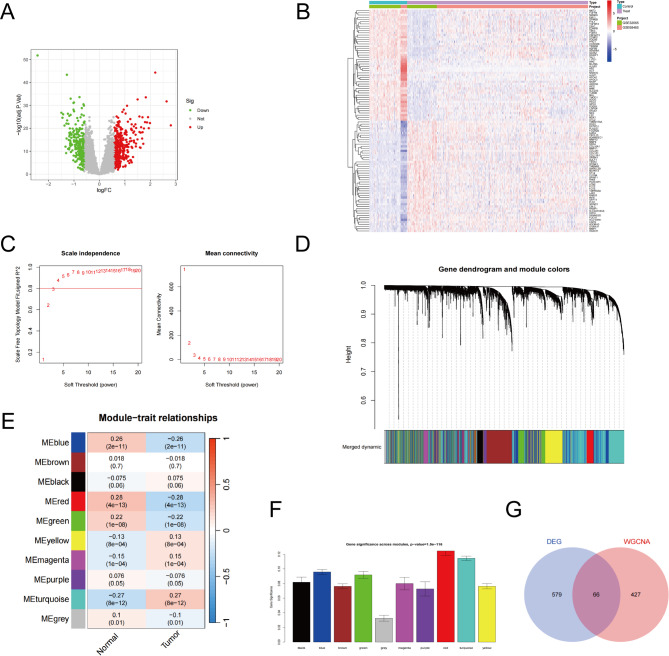
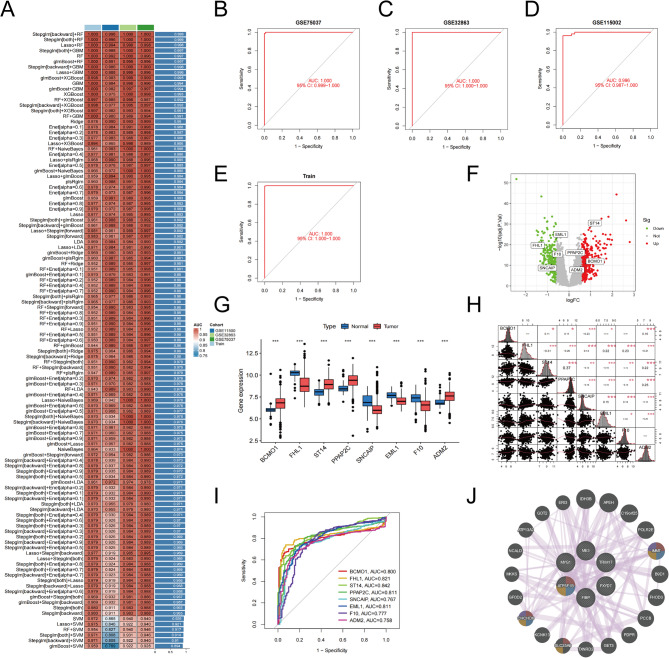
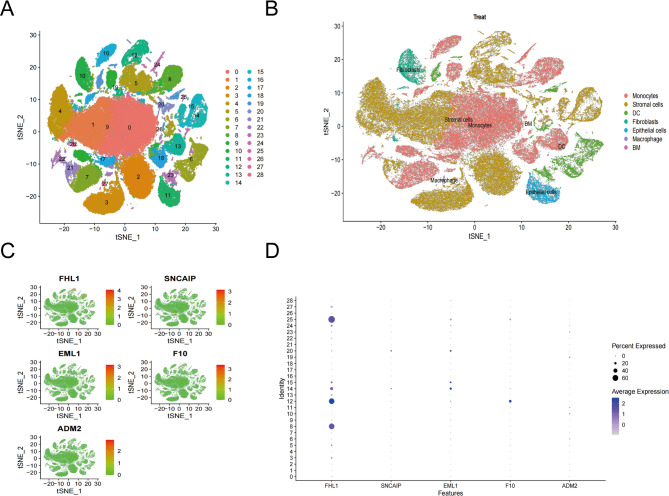
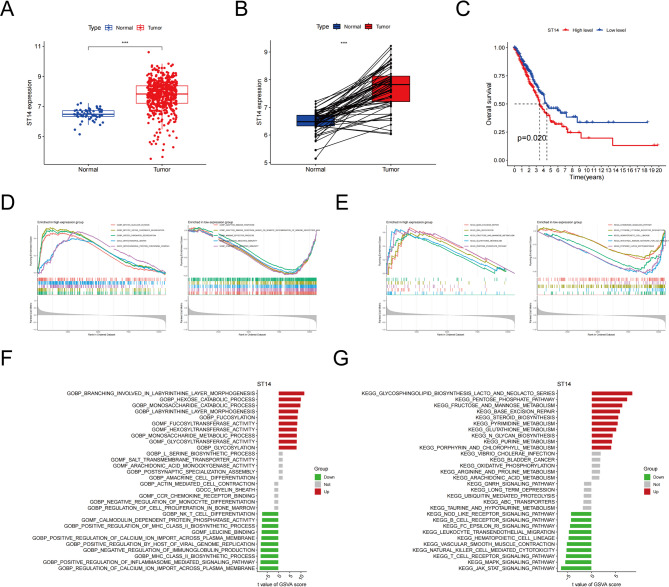
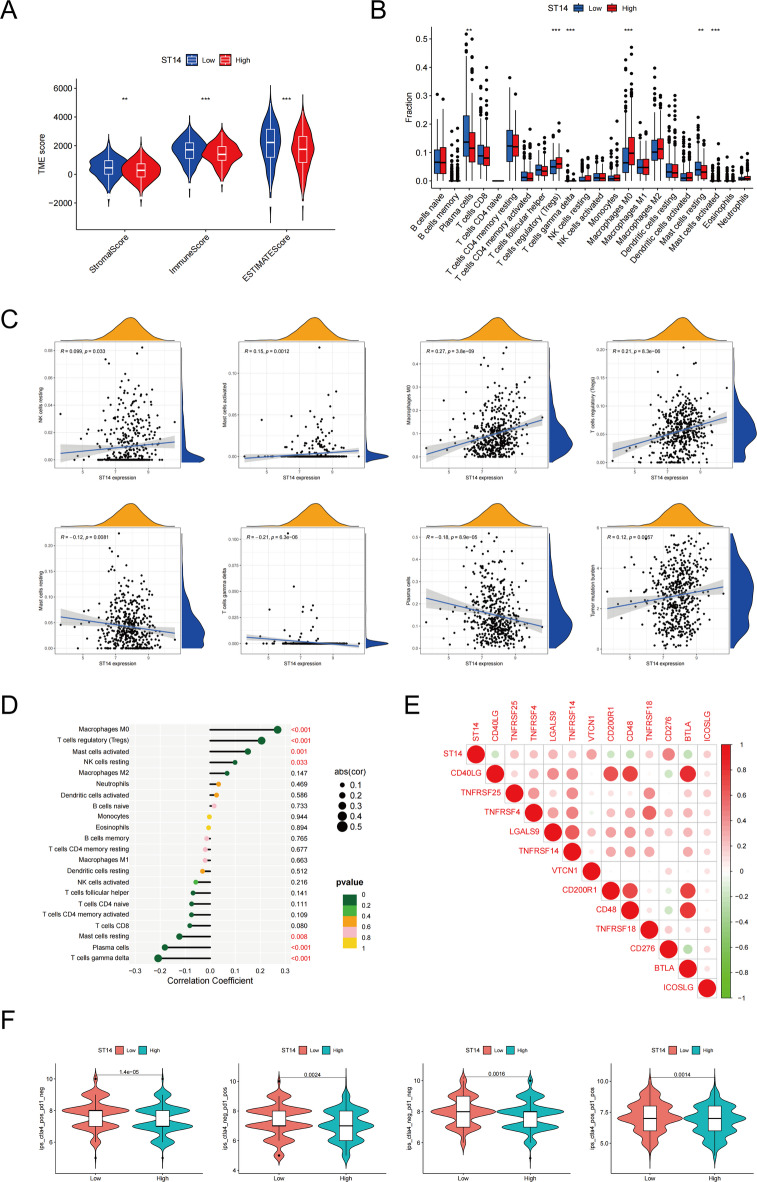
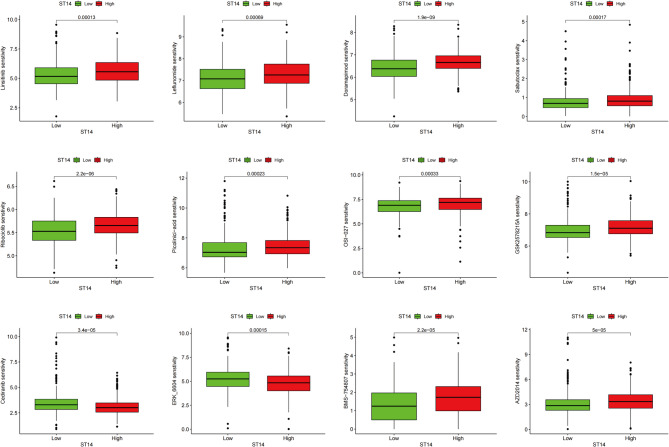
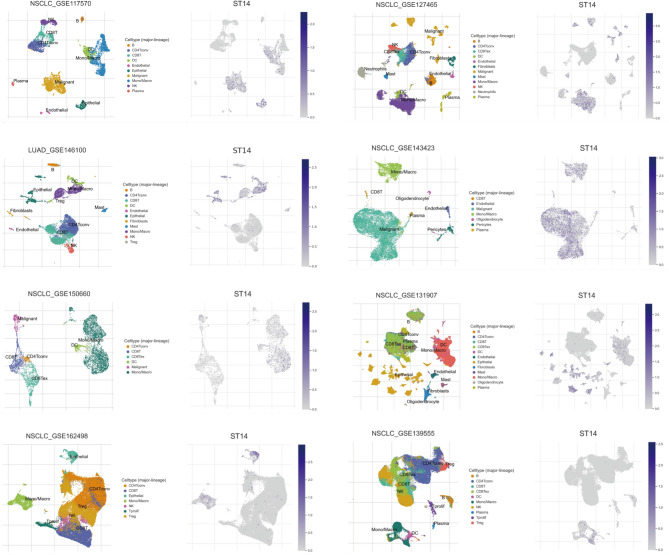
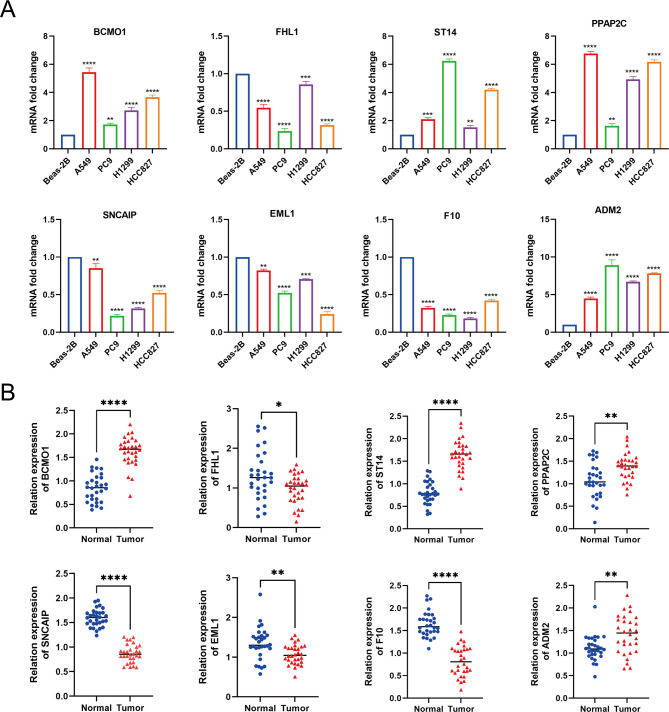
Lung adenocarcinoma (LUAD) is a major challenge in oncology due to its complex molecular structure and generally poor prognosis. The aim of this study was to find diagnostic markers and therapeutic targets for LUAD by integrating differential gene expression analysis, weighted gene co-expression network analysis (WGCNA), and machine learning methods. Differentially expressed genes (DEGs) were identified through the analysis of gene expression data from the Gene Expression Omnibus (GEO) database. Ten of the gene co-expression modules constructed by WGCNA were identified, with the red module having the most significant correlation with clinical features. In addition, a machine learning model constructed based on Stepglm[backward] with the random forest algorithm achieved the highest C-index (0.999) and screened eight core genes, among which ST14 was noted for its excellent predictive ability. Single-cell RNA sequencing of the LUAD samples further analyzed the expression patterns of these genes in 29 cellular subtypes, revealing their significant association with immune cell infiltration. Of particular note, the association of ST14 with clinical prognosis, drug responsiveness, and immune infiltration was validated, while enrichment analysis further clarified its role in key biological pathways. Ultimately, the expression of the core genes was validated experimentally. This study provides new insights into the pathogenesis of LUAD, clarifies potential diagnostic markers and therapeutic targets, and provides an important basis for future clinical interventions.

Keywords: Lung adenocarcinoma; Machine learning in oncology; ST14; Single-cell analysis; Weighted gene co-expression network analysis.


Conflict of interest statement

Declarations. Ethics approval and consent to participate: All procedures performed in studies involving human participants were in accordance with the ethical standards of the institutional and national research committee and with the 1964 Helsinki declaration and its later amendments. The project was approved by the institutional ethics committee of the Fujian Cancer Hospital. Informed consent was obtained from all participants included in the study. Competing interests: The authors declare no competing interests.

Figures

Fig. 1
Fig. 1
Results of differential gene expression analysis and WGCNA module construction. (A) Volcano plot depicting DEGs; (B) Heatmap demonstrating the expression patterns of DEGs; (C) Soft-threshold screening results; (D) Module results of gene clustering tree and dynamic shear tree delineation; (E) Association heatmap of clinical features and modules; (F) Histogram of gene significance of different modules, with the red module has the highest significance; (G) Venn diagram showing the gene intersection of DEG and WGCNA results.
Fig. 2
Fig. 2
A model was built and validated by a machine learning-based approach. (A) The best model was identified using 113 different machine learning algorithms; (B–E) ROC curves of each dataset and training set, with the AUC values close to 1.0, indicating that the model has good discriminatory ability; (F) Volcano plot of the model genes; (G) Expression levels of the model genes in normal and tumor samples; (H) Correlation analysis between the model genes; (I) Model genes’ ROC curves, with ST14 gene showing the best performance; (J) Protein interaction network of model genes. *p < 0.05; **p < 0.01; ***p < 0.001.
Fig. 3
Fig. 3
Single-cell RNA sequencing analysis of LUAD samples in the GSE189357 dataset. (A) T-SNE plot illustrating 29 distinct cell subpopulations; (B) T-SNE plot depicting the distribution pattern of cell types; (C) T-SNE plot showing the expression distribution of five model genes (FHL1, SNCAIP, EML1, F10, ADM2). (D) Bubble plot showing the proportion of expression (bubble size) and the average expression level (color intensity) of the five model genes in different cell subpopulations.
Fig. 4
Fig. 4
Analysis of the role of ST14 gene in LUAD. (A) The variation in ST14 gene expression between tumor and normal tissues; (B) The expression variation of the ST14 gene in paired tumor and normal tissues; (C) The differences in survival rates based on varying ST14 expression levels (p = 0.020); (D) The GO analysis bar graphs; (E) The KEGG analysis bar graphs; (F) GSVA analysis showing t-value bar graphs for different GO functions in ST14 samples, reflecting the degree of enrichment or inhibition of each gene set; (G) GSVA analysis showing t-values for different KEGG pathways in ST14 samples bar graphs reflecting the degree of enrichment or inhibition of each pathway. ***p < 0.001.
Fig. 5
Fig. 5
Analysis of the role of ST14 gene in TME. (A) The comparison of StromalScore, ImmuneScore, and ESTIMATEScore between groups with high and low ST14 expression; (B) The variation in proportions of high and low ST14 expression groups among multiple immune cell types; (C) Correlation analysis shows significant associations between ST14 and different immune cell types; (D) Lollipop plot demonstrating the correlation between ST14 and multiple immune cell types; (E) Correlation of 12 ICP genes associated with ST14 is demonstrated; (F) Impact of ST14 high and low expression groups on immunotherapy efficacy is shown. **p < 0.01; ***p < 0.001.
Fig. 6
Fig. 6
Drug sensitivity analysis based on ST14 expression. The figure shows the IC50 value, and the lower the IC50 value, the higher the drug sensitivity.
Fig. 7
Fig. 7
Expression patterns of ST14 gene in different NSCLC single cell datasets. The figure shows the ST14 expression levels of various cell populations.
Fig. 8
Fig. 8
Gene expression analysis in LUAD cell lines and tumor tissues. (A) qRT-PCR was performed to detect the expression of BCMO1, FHL1, ST14, PPAP2C, SNCAIP, EML1, F10, and ADM2 in LUAD cell lines versus Beas-2B control. (B) qRT-PCR analysis of gene expression in 30 pairs of LUAD normal and tumors tissues. *p < 0.05; **p < 0.01; ****p < 0.0001.

Similar articles

References

    1. Cui, J. J. et al. Gene-gene and gene-environment interactions influence platinum-based chemotherapy response and toxicity in non-small cell lung cancer patients. Sci. Rep.7, 5082. 10.1038/s41598-017-05246-8 (2017). - PMC - PubMed
    1. Zhang, H. et al. ARNTL2 is an indicator of poor prognosis, promotes epithelial-to-mesenchymal transition and inhibits ferroptosis in lung adenocarcinoma. Transl. Oncol.26, 101562. 10.1016/j.tranon.2022.101562 (2022). - PMC - PubMed
    1. Duma, N., Santana-Davila, R. & Molina, J. R. Non-small cell lung cancer: epidemiology, screening, diagnosis, and treatment. Mayo Clin. Proc.94, 1623–1640. 10.1016/j.mayocp.2019.01.013 (2019). - PubMed
    1. Lee, Y. S., Yeo, I. J., Kim, K. C., Han, S. B. & Hong, J. T. Inhibition of lung tumor development in ApoE knockout mice via enhancement of TREM-1 dependent NK cell cytotoxicity. Front. Immunol.10, 1379. 10.3389/fimmu.2019.01379 (2019). - PMC - PubMed
    1. Chen, C., Jia, F., Hou, Z., Ruan, S. & Lu, Q. Delivery of Paeonol by nanoparticles enhances its in vitro and in vivo antitumor effects. Int. J. Nanomed.12, 6605–6616. 10.2147/ijn.S143938 (2017). - PMC - PubMed

Substances

LinkOut - more resources