

Unravelling root system architecture plasticity in response to abiotic stresses in maize
- PMID: 40595846
- PMCID: PMC12216579
- DOI: 10.1038/s41598-025-04123-z
Unravelling root system architecture plasticity in response to abiotic stresses in maize
Abstract
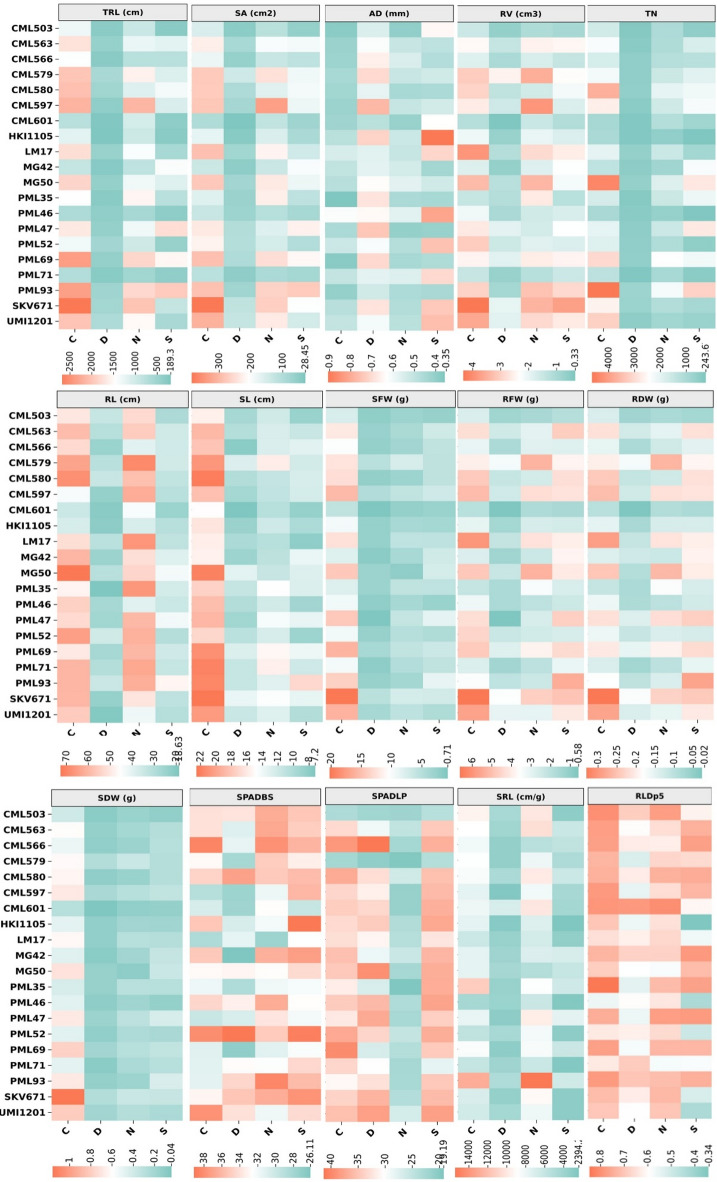
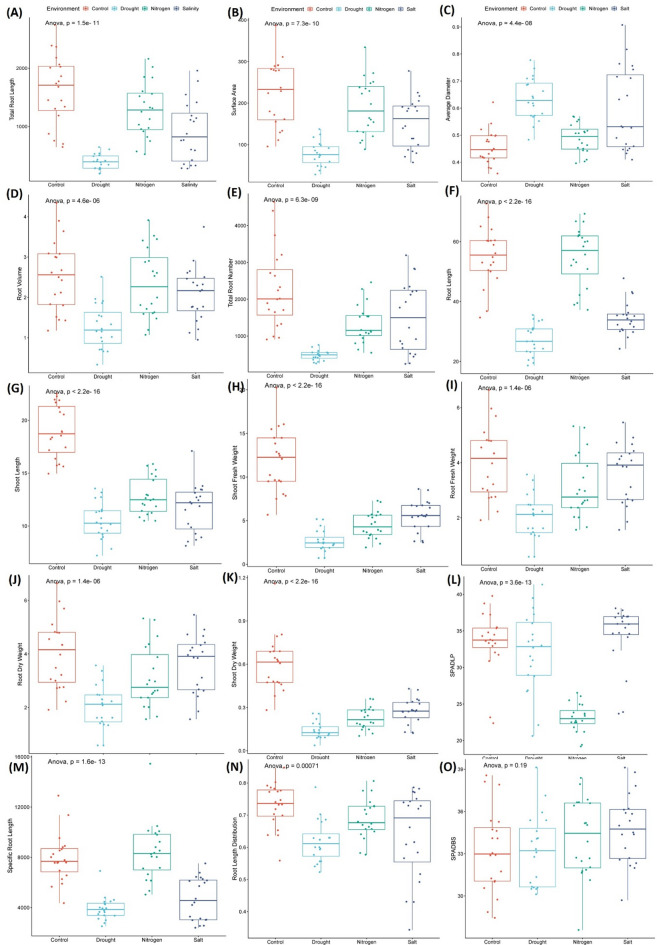
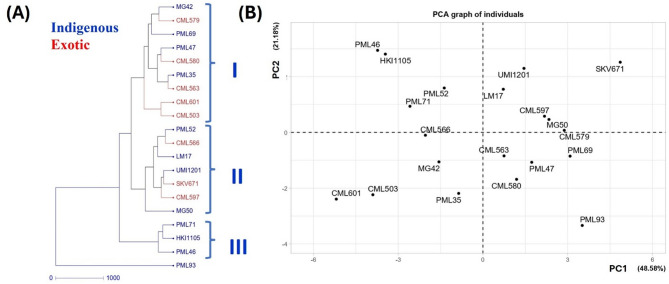
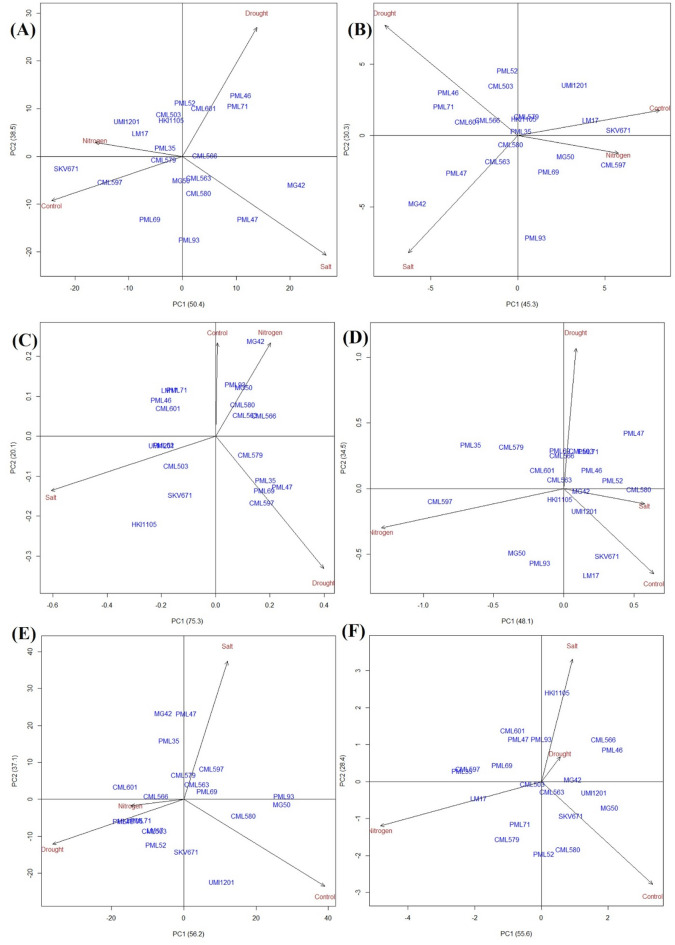
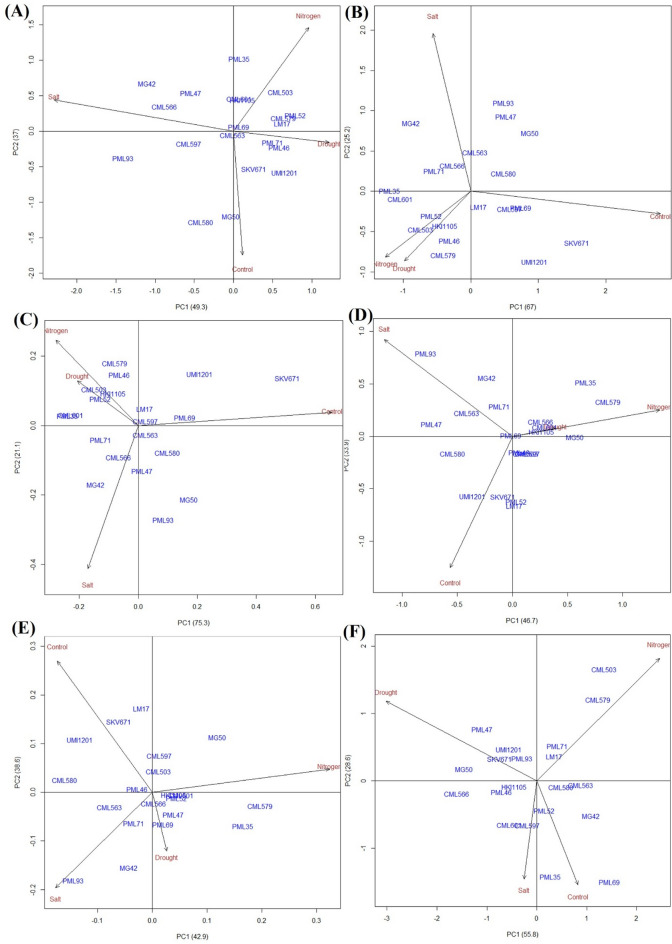
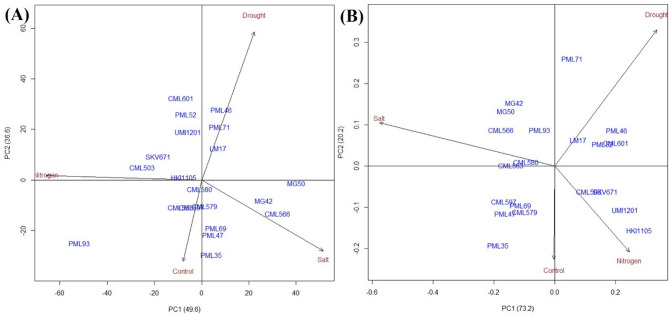
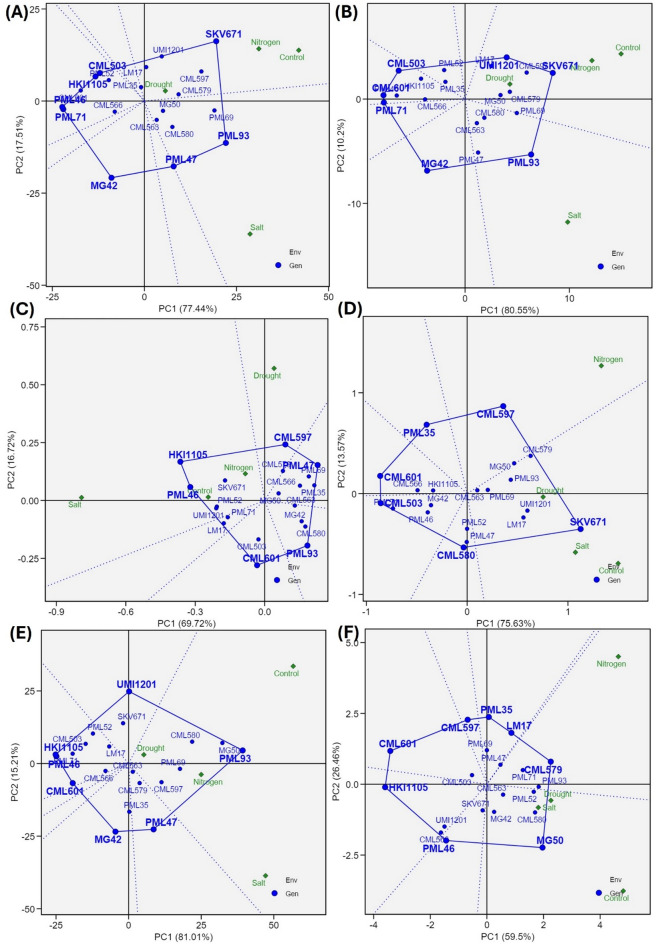
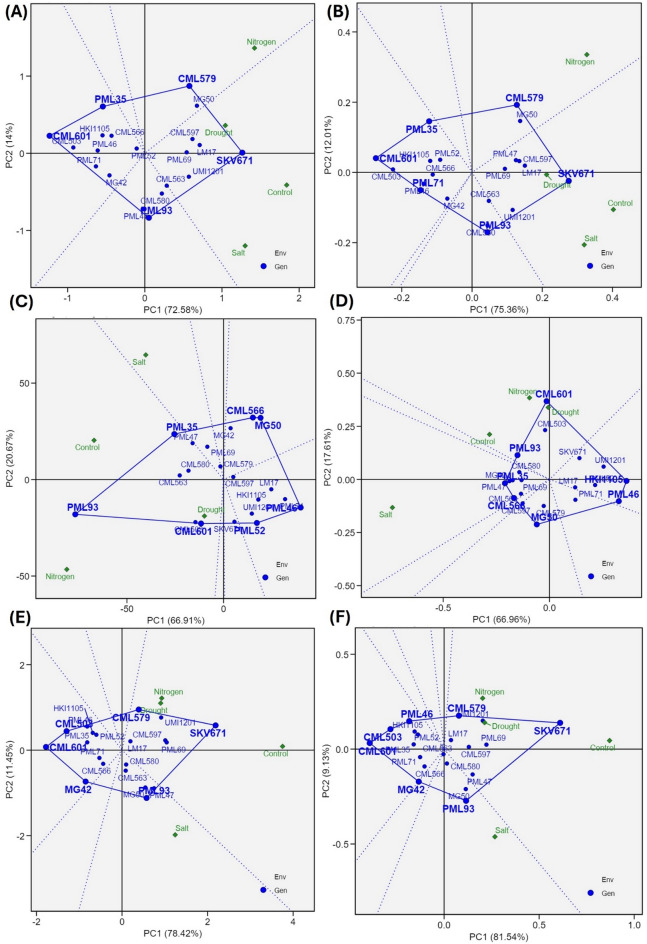
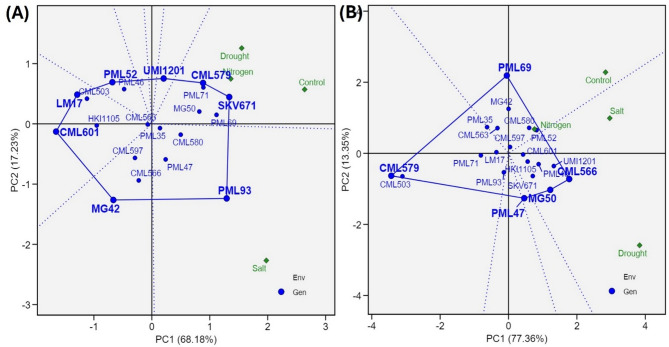
Maize (Zea mays L.) production is often limited by edaphic stresses, viz., drought, salinity and nutrient deficiencies. The root system architecture (RSA) in is essential for efficient water and nutrient acquisition and overall plant stability under adverse conditions. Thus, identifying maize genotypes with desirable root characteristics under stress is a valuable strategy for breeding maize with enhanced abiotic stress tolerance and improved resource-use efficiency. The hydroponics-based root phenotyping offers control over the root environment, reduced labour, and almost damage-free phenotyping over field-based phenotyping. Here, we have investigated the adaptive RSA plasticity of maize under drought, low nitrogen, salinity, and non-stress environments. The results revealed significant variability for all the RSA-associated and related traits. The salinity-stressed genotypes showed adaptive plasticity with enhanced average root diameter (AD), whereas the enhanced total root length (TRL) and surface area (SA) were reduced along with average root diameter under low-N stress. The RSA traits TRL (total root length), SA (surface area), RV (root volume), SFW (shoot fresh weight), SDW (shoot dry weight), RFW (root fresh weight) and RDW (root dry weight) showed positive and significant correlations across the stress conditions (0.47 to 0.99; p < 0.001 to 0.05). Conversely, AD showed significantly negative correlations with SRL (-0.70 to -0.95; p < 0.001) of genotypes, stress (environment) and genotypes × stress (environment) interactions suggested the possibility of developing stress-specific maize cultivars by selecting inbred lines with high adaptive plasticity to specific stress environments or broad adaptability by selecting lines with high stability across stress environments. The results suggested that the maize RSA adapts not only specific root types and traits to cope with various environmental stress conditions but also the strength and directions of trait association. Notably, inbreds SKV671 and CML597 exhibited superior performance for various RSA traits under drought and low nitrogen conditions, while PML93 and MG42 excelled in salinity stress.
Keywords: Drought; Low-nitrogen; Maize; Plasticity; Root system; Salinity.
© 2025. The Author(s).
Conflict of interest statement
Declarations. Competing interests: The authors declare no competing interests.
Figures
Similar articles
-
Association mapping for root system architecture under varying levels of phosphorus application in Brassica juncea L. Czern & Coss.BMC Genomics. 2025 Aug 11;26(1):740. doi: 10.1186/s12864-025-11840-2. BMC Genomics. 2025. PMID: 40790467 Free PMC article.
-
Heat-induced modulation of growth parameters and gene expression profiles in maize (Zea mays L.) seedlings.Mol Biol Rep. 2025 Jul 22;52(1):745. doi: 10.1007/s11033-025-10807-6. Mol Biol Rep. 2025. PMID: 40694244
-
Broad environmental adaptation is associated with root anatomical phenotypes in maize landraces: An in silico study.Ann Bot. 2025 Aug 13:mcaf179. doi: 10.1093/aob/mcaf179. Online ahead of print. Ann Bot. 2025. PMID: 40802792
-
Systemic pharmacological treatments for chronic plaque psoriasis: a network meta-analysis.Cochrane Database Syst Rev. 2017 Dec 22;12(12):CD011535. doi: 10.1002/14651858.CD011535.pub2. Cochrane Database Syst Rev. 2017. Update in: Cochrane Database Syst Rev. 2020 Jan 9;1:CD011535. doi: 10.1002/14651858.CD011535.pub3. PMID: 29271481 Free PMC article. Updated.
-
Systemic pharmacological treatments for chronic plaque psoriasis: a network meta-analysis.Cochrane Database Syst Rev. 2021 Apr 19;4(4):CD011535. doi: 10.1002/14651858.CD011535.pub4. Cochrane Database Syst Rev. 2021. Update in: Cochrane Database Syst Rev. 2022 May 23;5:CD011535. doi: 10.1002/14651858.CD011535.pub5. PMID: 33871055 Free PMC article. Updated.
References
-
- Tebaldi, C. & Lobell, D. Estimated impacts of emission reductions on wheat and maize crops. Clim. Change. 146, 533–545 (2018).
-
- Zandalinas, S. I., Casal, J., Rouached, H. & Mittler, R. Stress combination: from genes to ecosystems. Plant. J.117, 1639–1641 (2024). - PubMed
-
- Mittler, R. Abiotic stress, the field environment and stress combination. Trends Plant. Sci.11, 15–19 (2006). - PubMed
MeSH terms
Substances
Grants and funding
LinkOut - more resources
Full Text Sources
Miscellaneous
