. 2025 Jul 1;15(1):20560.
doi: 10.1038/s41598-025-05054-5.

Repurposing of CNS accumulating drugs Gemfibrozil and Doxylamine for enhanced sensitization of glioblastoma cells through modulation of autophagy

Affiliations

Repurposing of CNS accumulating drugs Gemfibrozil and Doxylamine for enhanced sensitization of glioblastoma cells through modulation of autophagy

Smita Dey et al. Sci Rep. .

Abstract

GBM is one of the most aggressive malignancies, having the greatest fatality rate and average life years lost. The current standard medicine, temozolomide (TMZ), is ineffective, requiring the development of new treatments. However, identifying and introducing a novel medicine takes time and money. In this context, repurposing FDA-approved drugs can be a novel yet efficient alternative method. Here, we, therefore, investigated the differential expression signatures of genes of patients suffering from GBM from publicly available GEO datasets and constructed a connectivity map. Functional annotation and KEGG pathway analysis showed dysregulated molecular activities and pathways. Based on their gene ontologies, putative key genes and hub genes linked with the disease were identified, and the C-MAP database was scanned for FDA-approved medicinal compounds that could alter hub gene expression or associated pathways. Our in-silico investigation showed that Gemfibrozil (Gem) and Doxylamine (Doxy) might reverse GBM disease patterns by deregulating GBM-related genes. Evaluation of the GBM inhibitory potential of these drugs through in-vitro and three-dimensional spheroid assay showed promising results. These drugs were more cytotoxic than TMZ; however, they synergised with TMZ as well. Interestingly, the cellular homeostatic process autophagy which has been implicated significantly in GBM pathogenesis and therapy resistance, was found to be inhibited by the drugs Gemfibrozil and Doxylamine, signifying their prospective potential. Therefore, in this study, we, for the first time, identify drugs with the ability to cross the blood brain barrier (BBB), with potential cytotoxic effects beyond TMZ, and with autophagy inhibitory potential, which can be further explored for repurposing against GBM.

Keywords: Autophagy; Disease reversal; Drug repurposing; Glioblastoma multiform; Temozolomide.


Conflict of interest statement

Declararions. Competing interests: The authors declare no competing interests.

Figures
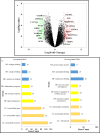
Fig. 1
Fig. 1
Identification of differentially expressed genes in GBM patients and their functional enrichment: (a) Volcano Plot of all the genes obtained on comparing the GBM samples from patients to normal brain samples. All the red dots correspond to the differentially upregulated genes, while all the green dots correspond to differentially downregulated genes. (b) Gene Ontology (GO) analysis of differentially expressed genes (DEGs) using DAVID (i) Functional annotation of upregulated DEGs. (ii) Functional annotation of downregulated DEGs (c.i) Bar graph representing all the significantly enriched KEGG pathways associated with upregulated DEGs, (c.ii) Bar graph representing all the significantly enriched KEGG pathways associated with downregulated DEGs, (d) Venn Diagram representing differentially expressed genes which were found to regulate cellular processes, intracellular processes, and receptor-mediated processes.
Fig. 1
Fig. 1
Identification of differentially expressed genes in GBM patients and their functional enrichment: (a) Volcano Plot of all the genes obtained on comparing the GBM samples from patients to normal brain samples. All the red dots correspond to the differentially upregulated genes, while all the green dots correspond to differentially downregulated genes. (b) Gene Ontology (GO) analysis of differentially expressed genes (DEGs) using DAVID (i) Functional annotation of upregulated DEGs. (ii) Functional annotation of downregulated DEGs (c.i) Bar graph representing all the significantly enriched KEGG pathways associated with upregulated DEGs, (c.ii) Bar graph representing all the significantly enriched KEGG pathways associated with downregulated DEGs, (d) Venn Diagram representing differentially expressed genes which were found to regulate cellular processes, intracellular processes, and receptor-mediated processes.
Fig. 2
Fig. 2
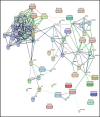
Protein–protein interaction (PPI) network of the ‘key’ genes and identification of hub genes: (a) Protein–Protein Interaction network of the 45 key genes generated using STRING, (b) A network of ten hub genes were obtained using cytoHubba, an application of Cytoscape. The nodes are colored based on their scores obtained using MCC. The darker the node, the greater its score (red) and the lower scores are represented as yellow.
Fig. 3
Fig. 3
Analysis of GBM gene signature reveals drugs that can be repurposed for GBM: PPI network of hub genes predicted for GBM and the predicted drugs, along with the gene targets of the predicted drugs. This network was generated using STITCH. The drugs are depicted as rectangular boxes, while the proteins are shown as circles.
Fig. 4
Fig. 4
Doxylamine and Gemfibrozil induce cytotoxicity in GBM cells: (a) Bar graph representing dose and time kinetics of Doxylamine (Doxy), Gemfibrozil (Gem), Diprophylline (Dipro), and Valproic Acid (VPA), and compared with the Standard Drug TMZ by MTT assay, (b) Crystal violet images capturing the viable cells after 24 h, 48 h, and 72 h of drugs treatment, scale bar represents 10 μm (c) Immunoblot showing expression of proliferation marker PCNA after (i) 24 h and (ii) 48 h of incubation, (d) Cleaved Caspase 3 expression by Immunoblotting confirming apoptosis of the cells (cropped image of the blot is provided), (e) Analysis of the total number of cell death by AnnexinV/PI data assay obtained after 48 h of drug treatment. p-value ≤ 0.05 is considered significant, and * refers to a p-value less than or equal to 0.03, ** refers to a p-value less than or equal to 0.002, and *** signifies a p-value less than 0.0001 between control and different test groups. All experiments were performed in triplicate unless stated otherwise, and all data were generated using the U87 cell line, unless specified differently.
Fig. 5
Fig. 5
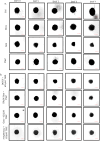
Gemfibrozil and Doxylamine show cytotoxicity in 3-D spheroid cultures of GBM cells: (a) Phase contrast images of the 3-D spheroids cultures post-treatment with drugs or drug combinations, (b) Microscopic images of 3-D spheroids of Doxy/Gem/ Drugs + TMZ captured after 0, 1, 3, 5, and 7 days respectively. The scale bar represents 20 μm. (c) Fluorescent images of 3-D spheroid cultures were captured after 1, 5, 10, 15, and 20 days of Doxylamine and Gemfibrozil treatment and stained with propidium iodide. (d) DIC images were captured post-20 days of drug treatment, and the scale bar represents 100 µm.
Fig. 5
Fig. 5
Gemfibrozil and Doxylamine show cytotoxicity in 3-D spheroid cultures of GBM cells: (a) Phase contrast images of the 3-D spheroids cultures post-treatment with drugs or drug combinations, (b) Microscopic images of 3-D spheroids of Doxy/Gem/ Drugs + TMZ captured after 0, 1, 3, 5, and 7 days respectively. The scale bar represents 20 μm. (c) Fluorescent images of 3-D spheroid cultures were captured after 1, 5, 10, 15, and 20 days of Doxylamine and Gemfibrozil treatment and stained with propidium iodide. (d) DIC images were captured post-20 days of drug treatment, and the scale bar represents 100 µm.
Fig. 6
Fig. 6
Doxylamine and Gemfibrozil inhibit autophagic flux in GBM cells: (a) Immunoblotting showing the expression of p62 and LC3 post-TMZ and TMZ plus CQ co-treatment for 48 h in (i) U87 cells and (ii) U373 cells, (b) Determination of cell death in TMZ and/or CQ (10 μM) treated cells as analyzed through Annexin V-PI staining in GBM cells [(i) U87 and (ii) U373], (c.i) Fluorescence intensity of the cells stained with MDC after Doxy, Gem, and TMZ treatment for 48 h. Scale bar represents 10 μm, (c.ii) Dot plot representing the fold change of fluorescence intensity plotted, (d) Fluorometric analysis of MDC fluorescence in cells treated with each drug for 48 h, (e) Flow cytometric analysis representing a shift in AO fluorescence after individual drug treatment, (f.i,f.ii) Immunoblotting of LAMP2A protein post-Doxy and gem treatment confirming lysosomal accumulation in both 2-D and 3-D U87 cultures, (g.i,g.ii) Immunoblots showing the expression of p62 and LC3 in U87 cells after 48 h of drug incubation confirming autophagic flux inhibition, (h.i) Immunoblotting of p62 and LC3B of the U87 Spheroid cultures post 5 days of drug treatment showing accumulations of the autophagic proteins, (cropped image of the blot is provided), (h.ii) Bar graph representing the expression of the autophagic proteins after Doxylamine and Gemfibrozil treatment to the spheroids confirming inhibition of the autophagic flux, (i.i) GFP and RFP fluorescence intensity measurement in the cells transfected with GFP-RFP-LC3 followed by individual drug treatment. The scale bar represents 10 μm. (i.ii) Bar graph plotted to represent the fold change in fluorescence. p-value ≤ 0.05 is considered significant, and * refers to a p-value less than or equal to 0.03, ** refers to a p-value less than or equal to 0.002, and *** signifies a p-value less than 0.0001 between control and different test groups. All experiments are replicated thrice unless mentioned otherwise.
Fig. 6
Fig. 6
Doxylamine and Gemfibrozil inhibit autophagic flux in GBM cells: (a) Immunoblotting showing the expression of p62 and LC3 post-TMZ and TMZ plus CQ co-treatment for 48 h in (i) U87 cells and (ii) U373 cells, (b) Determination of cell death in TMZ and/or CQ (10 μM) treated cells as analyzed through Annexin V-PI staining in GBM cells [(i) U87 and (ii) U373], (c.i) Fluorescence intensity of the cells stained with MDC after Doxy, Gem, and TMZ treatment for 48 h. Scale bar represents 10 μm, (c.ii) Dot plot representing the fold change of fluorescence intensity plotted, (d) Fluorometric analysis of MDC fluorescence in cells treated with each drug for 48 h, (e) Flow cytometric analysis representing a shift in AO fluorescence after individual drug treatment, (f.i,f.ii) Immunoblotting of LAMP2A protein post-Doxy and gem treatment confirming lysosomal accumulation in both 2-D and 3-D U87 cultures, (g.i,g.ii) Immunoblots showing the expression of p62 and LC3 in U87 cells after 48 h of drug incubation confirming autophagic flux inhibition, (h.i) Immunoblotting of p62 and LC3B of the U87 Spheroid cultures post 5 days of drug treatment showing accumulations of the autophagic proteins, (cropped image of the blot is provided), (h.ii) Bar graph representing the expression of the autophagic proteins after Doxylamine and Gemfibrozil treatment to the spheroids confirming inhibition of the autophagic flux, (i.i) GFP and RFP fluorescence intensity measurement in the cells transfected with GFP-RFP-LC3 followed by individual drug treatment. The scale bar represents 10 μm. (i.ii) Bar graph plotted to represent the fold change in fluorescence. p-value ≤ 0.05 is considered significant, and * refers to a p-value less than or equal to 0.03, ** refers to a p-value less than or equal to 0.002, and *** signifies a p-value less than 0.0001 between control and different test groups. All experiments are replicated thrice unless mentioned otherwise.
Fig. 7
Fig. 7
Doxylamine and Gemfibrozil synergize with TMZ or CQ, inducing enhanced cell death: (a) MTT assay performed to determine the percent survival of U87 cells when co-treated with Doxy or Gem and/or TMZ for 48 h, (b.i) Fluorescence intensity of MDC staining visualized under the microscope to confirm the increased accumulation of autophagosomes post-treatment in U87 cells. The scale bar represents 10 μm. (b.ii) Dot plot representing the change in fluorescence intensity, (c) Fluorimetric analysis of the MDC stain post-treatment. A bar graph was plotted, (d.i) GFP and RFP intensity of the cells transfected with GFP-RFP-LC3 vector post-co-treatment with CQ and drugs. Scale bar represents 10 μm, (d.ii) Bar graph plotted to represent the change in GFP to RFP fluorescence, (e) MTT assay performed to confirm the cytotoxicity of the drugs when co-treated with an autophagic inhibitor, CQ, (f) Analysis of the total number of dead cells post CQ and CQ plus drugs treatment for 48 h by AnnexinV-PI assay. p-value less than or equal to 0.03, ** refers to a p-value less than or equal to 0.002, and *** signifies a p-value less than 0.0001 between control and different test groups. All experiments are replicated thrice unless mentioned otherwise.
Fig. 8
Fig. 8
Gemfibrozil and Doxylamine generate reactive oxygen species (ROS) to induce cytotoxicity: (a) Fluorimetric analysis of ROS generation post-drug treatment for 48 h, (b) Analysis of cell death with and without NAC treatment prior to Doxy and Gem by MTT assay, (c.i.-iv.) Western blotting analysis of p62 and LC3 co-treated with NAC and Doxy or Gem treatment for 48 h in U87 cells, (cropped image of the blot is provided), (d) Fluorimetric analysis of ROS generation of cells co-treated with CQ and Doxy or Gem treatment for 48 h, (e) Fluorimetric analysis of ROS generation of the cells treated with CQ and Doxy or Gem treatment for 48 h in (i) U87 cells and (ii) U373 cells. * indicates the significant difference between control & different groups, calculated using the student’s t-test and one-way or two-way ANOVA with Bonferroni post-test. p-value ≤ 0.03 is considered significant. Unless otherwise stated, experiments are replicated three times.

Similar articles

References

    1. Iacob, G. & Dinca, E. B. Current data and strategy in glioblastoma multiforme. J. Med. Life2, 386–393 (2009). - PMC - PubMed
    1. Watkins, S. & Sontheimer, H. Unique biology of gliomas: Challenges and opportunities. Trends Neurosci.35, 546–556. 10.1016/j.tins.2012.05.001.Unique (2013). - PMC - PubMed
    1. Maher, E. A. & Bachoo, R. M. Glioblastoma (2014). 10.1016/B978-0-12-410529-4.00078-4
    1. Burnet, N. G. et al. Clinical and practical considerations for the use of intensity- modulated radiotherapy and image guidance in neuro-oncology statement of search strategies used and general considerations of IMRT for central nervous system tumours. Clin. Oncol.26, 395–406. 10.1016/j.clon.2014.04.024 (2014). - PubMed
    1. Lassman, A. B. Molecular biology of gliomas. Curr. Neurol. Neurosci. Rep.4(3), 228–233. 10.1007/s11910-004-0043-3 (2004). - PubMed

MeSH terms