. 2025 Jul 1;15(1):22390.
doi: 10.1038/s41598-025-04990-6.

Single-cell RNA sequencing reveals the potential role of Postn(+) fibroblasts in promoting the progression of myocardial fibrosis after myocardial infarction

Affiliations

Single-cell RNA sequencing reveals the potential role of Postn(+) fibroblasts in promoting the progression of myocardial fibrosis after myocardial infarction

Wenyang Nie et al. Sci Rep. .

Abstract

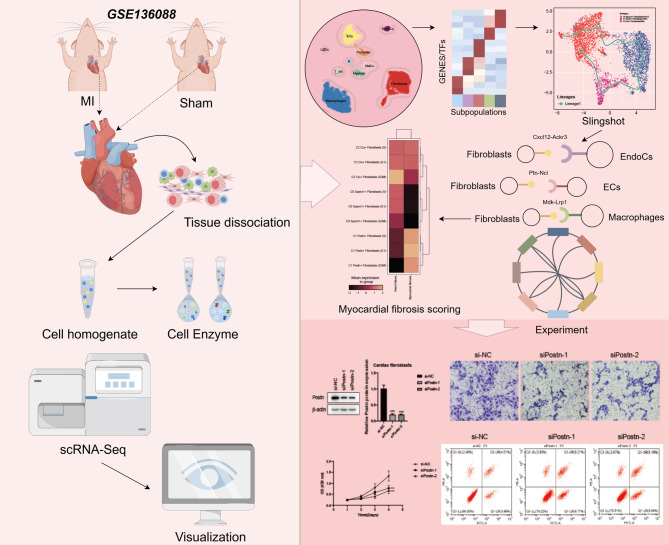
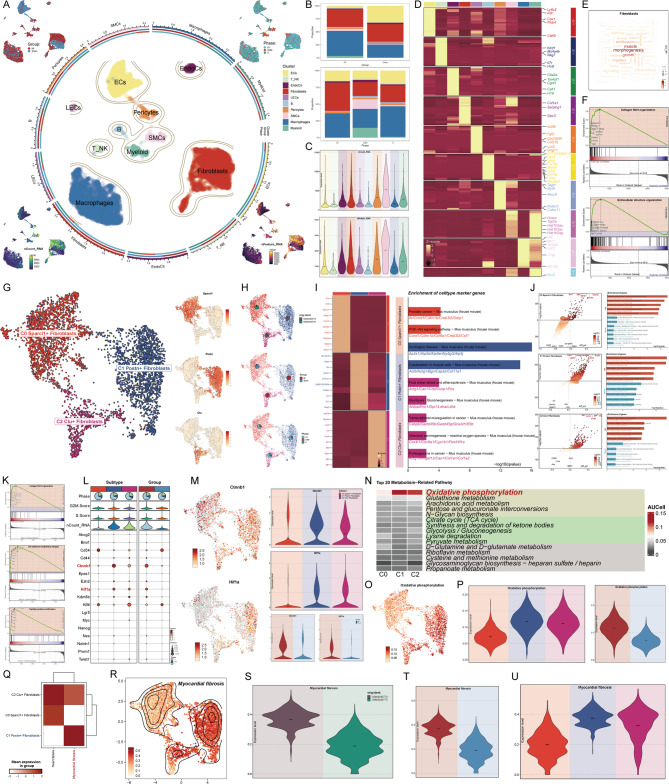
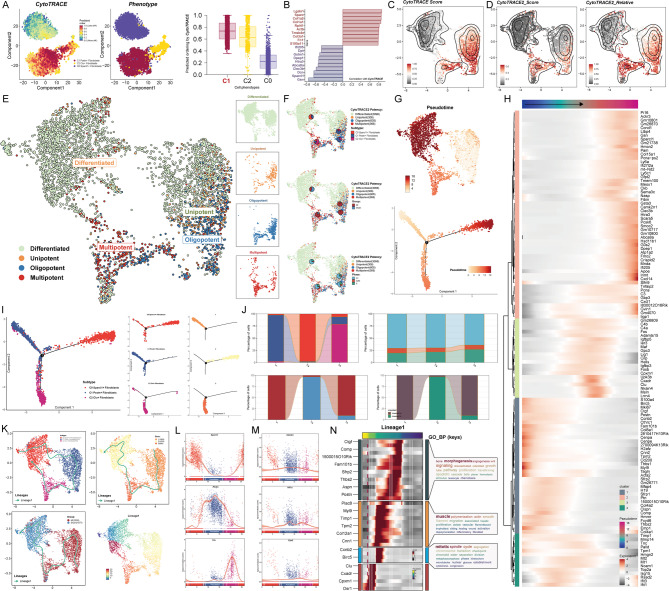
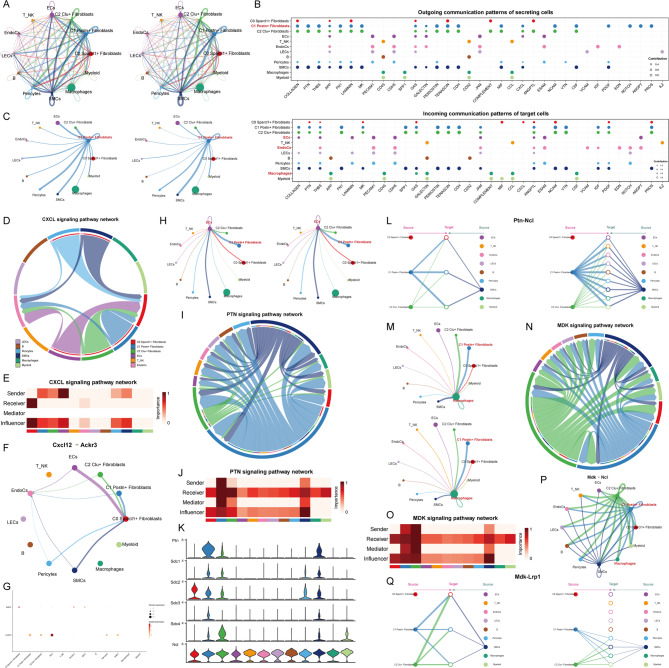
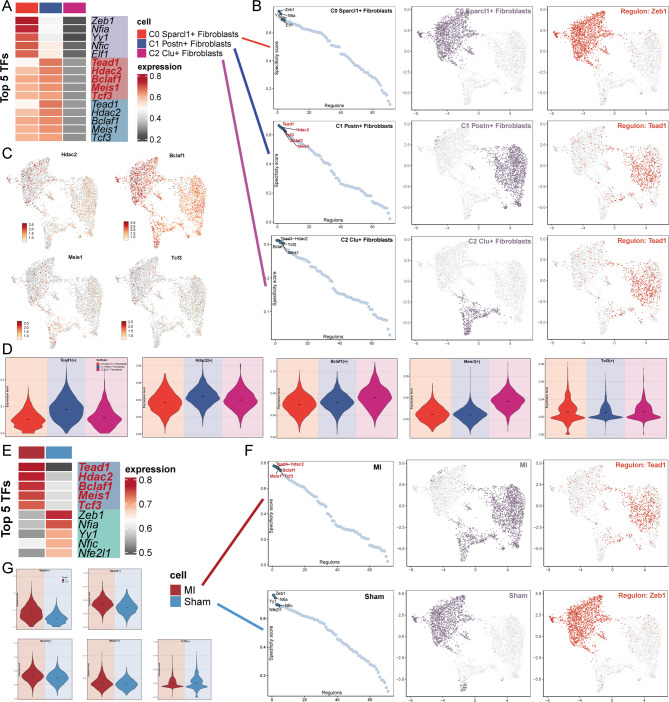
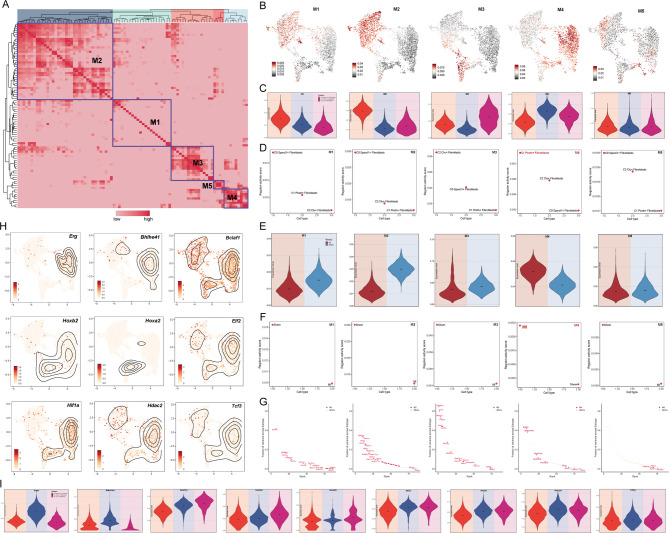
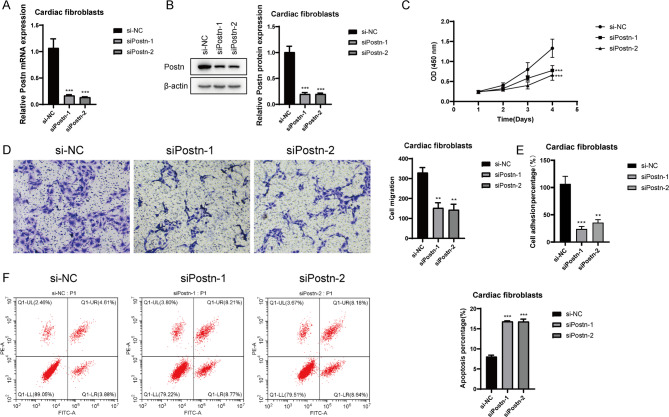
Myocardial infarction (MI) is a life-threatening coronary artery-related pathology characterized by sudden cardiac death, often leading to cardiac fibrosis and heart failure (HF). Despite advances in emergency care and treatment measures such as percutaneous coronary intervention (PCI), the mortality rate due to HF following MI remains high, making it the leading cause of death in MI patients. While cardiac fibroblasts are known to be closely associated with the adverse outcomes of cardiac fibrosis and HF post-MI, the cellular landscape of fibroblasts after MI and their role in myocardial fibrosis and HF progression has not been fully explored. Our study identified a key, highly proliferative fibroblast subpopulation, named C1 Postn + Fibroblasts, which showed high myocardial fibrosis scores. C1 Postn + Fibroblasts were primarily located at the early stage of the pseudo-time trajectory and exhibited high stemness. These cells interact with EndoCs, ECs, and macrophages through the Cxcl12-Ackr3, Ptn-Ncl, and Mdk-Lrp1 signaling pathways, thereby influencing myocardial fibrosis progression. Additionally, Tead1 and Hdac2 were found to be key and highly active transcription factors in this subpopulation. In vitro experiments showed that knocking down Postn significantly decreased the activity of cardiac fibroblasts, inhibited their migration and adhesion capabilities, and induced apoptosis. This subpopulation may be more sensitive to post-MI adverse events, while other subpopulations may exhibit more inhibited responses. Stemness genes Ctnnb1 and Hifla, as well as oxidative phosphorylation and glutathione metabolism pathways, should be closely monitored in efforts to prevent myocardial fibrosis post-MI. The Cxcl12-Ackr3, Ptn-Ncl, and Mdk-Lrp1 pathways may represent potential routes to disrupt the key interactions between C1 Postn + Fibroblasts and EndoCs, ECs, and macrophages. Tead1 and Hdac2 may be potential targets for inhibiting myocardial fibrosis and preventing adverse outcomes of MI after further experimental verification. The gene Postn, expressed in C1 Postn + Fibroblasts, may contribute to the inhibition of abnormal fibroblast activation post-MI. These findings open new perspectives for the prevention and treatment of myocardial fibrosis after MI and the prevention of its progression to HF.

Keywords: Fibroblasts; Myocardial fibrosis; Myocardial infarction; Postn; Single-cell RNA sequencing.


Conflict of interest statement

Declarations. Competing interests: The authors declare no competing interests. Ethical approval: The study was reviewed and approved by Ethics Committee of the Affiliated Hospital of Shandong University of Traditional Chinese Medicine (Designation: AF/SC-08/03.0). All the authors confirm that all experiments were performed in accordance with the relevant specified guidelines and regulations. It was confirmed that the study was reported in accordance with ARRIVE guidelines.

Figures

Fig. 1
Fig. 1
Research Overview. Myocardial fibrosis after myocardial infarction is closely related to cardiac fibroblasts. Single-cell RNA sequencing revealed that C1 Postn + Fibroblasts was a key subset that exhibite higher myocardial fibrosis scores. The potential effect of Postn was demonstrated by in vitro experiments.Pathways such as Cxcl12-Ackr3 may provide new directions for intervention.
Fig. 2
Fig. 2
Characterization of Fibroblast Subpopulations in the MI and Sham Groups. (A) Differentially expressed genes were used to identify 10 distinct cell types from high-quality filtered cells in the MI and Sham groups. The distribution of cells from both groups across these cell types was depicted, along with their cell cycle states. Additionally, differences in nCount RNA and nFeature RNA across cell types were presented. (B) Bar plots illustrated the proportion of various cell types in the MI and Sham groups, as well as the composition of cell cycle states within each cell type. (C) Violin plots provided a comparative visualization of nCount RNA and nFeature RNA levels among different cell types. (D) Differentially expressed genes were identified for each of the 10 cell types. (E) The word cloud map displayed enriched terms related to fibroblasts. (F) GSEA results for fibroblasts were presented. (G) Based on differentially expressed marker genes, three fibroblast clusters were annotated as subpopulations and named Sparcl1+, Postn+, and Clu + Fibroblasts, according to their most distinct marker genes. (H) UMAP plots showed the sample origin and grouping of the three fibroblast subpopulations, along with the proportions of cells in different cell cycle states within each subpopulation (It is worth noting that in the data used in this study, the sample source GSM number corresponds to the group one by one: GSM4040774 corresponds to the MI group, and GSM4040775 corresponds to the Sham group). (I) Differentially expressed genes of the three fibroblast subpopulations were analyzed using GO-BP analysis. (J) Volcano plots highlighted the upregulated and downregulated genes in the three fibroblast subpopulations, with separate GO-BP analyses performed for each group. (K) GSEA results for C1 Postn + Fibroblasts were presented. (L) Bubble plots demonstrated differences in stemness gene expression among the subpopulations and between the groups. (M) UMAP and violin plots showed the expression levels of the stemness-related genes Ctnnb1 and Hif1a in the C1 subpopulation, comparing their rankings across subpopulations and groups. (N–P) The significant metabolic pathways for the three fibroblast subpopulations were analyzed using AUC values. The highest-scoring pathway for C1 Postn + Fibroblasts was oxidative phosphorylation, and its differences across subpopulations were visualized using UMAP and violin plots. Additionally, differences between the MI and Sham groups were highlighted. (Q) The heatmap compared heart failure and myocardial fibrosis scores across the three fibroblast subpopulations. (R) The UMAP plot displayed the distribution and density variations of myocardial fibrosis scores. (S–U) Violin plots compared myocardial fibrosis scores across different samples, groups, and subpopulations.
Fig. 3
Fig. 3
Pseudotime Analysis Reveals the Heterogeneity of Fibroblast Subpopulations. (A) CytoTRACE analysis highlighted differences in differentiation states among the three fibroblast subpopulations. (B) Genes positively and negatively correlated with CytoTRACE scores were identified. (C) The UMAP plot depicted the distribution of CytoTRACE scores across subpopulations, showing variations in score magnitude and density. (D) The UMAP plots displayed CytoTRACE2 scores and CytoTRACE2 relative scores, along with their distribution density across subpopulations. (E) The UMAP plots illustrated differences in stemness potential among the fibroblast subpopulations. (F) The proportions of each fibroblast subpopulation within high-stemness cells were analyzed, alongside the proportions of cells from different groups and cell cycle states within these high-stemness populations. (G) Pseudotime trajectories constructed using Monocle were visualized on UMAP plots, where the progression was indicated by a gradient of colors. The trajectory developed from the top-left to the right, featuring a bifurcation point. (H) Expression of subpopulation-specific marker genes along the pseudotime trajectory was analyzed. (I) Subpopulation distributions along the pseudotime trajectory were mapped based on marker gene expression. The trajectory was divided into three states (state1-state3) according to the bifurcation point. (J) Bar plots illustrated the composition of subpopulations, cell cycle states, groups, and samples within state1, state2, and state3. (K) Slingshot analysis revealed a pseudotime developmental trajectory (Lineage1), visualized on UMAP plots. The trajectory’s progression across fibroblast subpopulations was as follows: C0 Sparcl1 + Fibroblasts → C1 Postn + Fibroblasts → C2 Clu + Fibroblasts → C0 Sparcl1 + Fibroblasts. Lineage1 trajectories were also mapped across different groups and states. (L) Temporal changes in the expression of subpopulation-specific marker genes along Lineage1 were analyzed. (M) Temporal expression patterns of the stemness-related genes Ctnnb1, Hif1a, and Ezh2 along Lineage1 were presented. (N) Differentially expressed genes across all subpopulations showed distinct temporal patterns along Lineage1. These genes were categorized into four gene clusters based on their expression timing, followed by enrichment analysis for each cluster.
Fig. 4
Fig. 4
Crosstalk Between the C1 Subpopulation and EndoCs, ECs, and Macrophages. (A) Circos plots displayed the intensity and number of interactions between all fibroblast subpopulations and other cell types. (B) The expression levels of ligand-receptor pairs when all cell types acted as signal senders (top) and as signal receivers (bottom). (C) Circos plots highlighted the interaction intensity and count when C1 Postn + Fibroblasts acted as signal senders and interacted with other cell types. (D) Chord diagrams illustrated the interactions of all cell types within the CXCL signaling pathway. (E) The heatmap quantified the influence of each cell type in the CXCL signaling pathway as signal senders, receivers, or intermediaries. (F) The circos plot represented the interactions among all cell types within the Cxcl12-Ackr3 signaling pathway. (G) The differential expression of ligand Cxcl12 and receptor Ackr3 across all cell types. (H) Circos plots displayed the interaction intensity and count when ECs acted as signal receivers from other cell types. (I) Chord diagrams illustrated the interactions among all cell types in the PTN signaling pathway. (J) The heatmap evaluated the influence scores of all cell types acting as different roles within the PTN signaling pathway. (K) Expression differences of PTN-related receptor proteins across cell types in the PTN signaling pathway were analyzed. (L) All cell types interact autocrine and paracrine in the Ptn-Ncl signaling pathway. (M) Circos plots displayed the interaction intensity and count when macrophages acted as signal receivers from other cell types. (N) Chord diagrams represented the interactions of all cell types within the MDK signaling pathway. (O) The heatmaps scored the influence of all cell types in different roles within the MDK signaling pathway. (P) The circos plot showed the interactions among all cell types in the Mdk-Ncl signaling pathway. (Q) Autocrine and paracrine roles in Mdk-Lrp1 signaling in all cell types.
Fig. 5
Fig. 5
Gene Regulatory Networks of Fibroblast Subpopulations in the MI and Sham Groups. (A) The heatmap displayed the differential expression of the top five TFs in the three fibroblast subpopulations. (B) Fibroblast subpopulations were highlighted as light purple dots in the UMAP plot (middle). The ranking of regulatory factors within subpopulations based on their Regulator Specificity Scores (RSS) was shown (left). The binary Regulator Activity Scores (RAS) of the highest regulatory factors (normalized by Z-score with a cutoff of 2.5, converted to 0 or 1) were mapped as red dots on the UMAP plot (right). (C) UMAP plots illustrated the expression patterns of Hdac2, Bclaf1, Tcf3, and Meis1 across all subpopulations, excluding Tead1. (D) Violin plots compared the AUC values of five TFs (Tead1, Hdac2, Bclaf1, Tcf3, and Meis1), ranking their activity across fibroblast subpopulations. (E) The heatmap highlighted the differential expression of the top five TFs between the MI and Sham groups. (F) The MI and Sham group distributions were highlighted as light purple dots in the UMAP plot (middle). The ranking of regulatory factors in the two groups based on their RSS scores was displayed (left). Binary RAS scores of the top regulatory factors, mapped as red dots, illustrated their distribution across the UMAP plot (right). (G) Violin plots depicted the differences in AUC values for the five TFs (Tead1, Hdac2, Bclaf1, Tcf3, and Meis1) between the MI and Sham groups.
Fig. 6
Fig. 6
Identification of TFs Regulatory Modules in Fibroblasts. (A) The heatmap illustrated the regulatory modules identified across all fibroblast subpopulations in the MI and Sham groups using PySCENIC. Modules were determined based on the similarity of regulatory rules and AUCell scores, leading to the identification of five regulatory submodules (M1–M5) based on rule similarity. (B) UMAP plots visualized the distribution of the five regulatory submodules (M1–M5) across all fibroblast subpopulations. (C) Violin plots displayed the proportions of fibroblast subpopulations within each module (M1–M5). (D) Rankings of regulatory activity scores for the three fibroblast subpopulations were shown within each module (M1–M5). (E) Violin plots compared the proportions of cells from the MI and Sham groups within each of the five regulatory submodules. (F) Regulatory activity scores for cells from the MI and Sham groups were shown for each module (M1–M5). (G) The top-ranking TFs with the highest activity in the five regulatory submodules were identified. (H) Intensity and density plots depicted the activity levels of the nine top-ranking TFs within module M4. (I) Violin plots compared the activity levels of the nine TFs among the three fibroblast subpopulations.
Fig. 7
Fig. 7
In Vitro Experiments on Postn Knockdown in Cardiac Fibroblasts. (A) Relative expression of Postn mRNA in cardiac fibroblasts with si-Postn knockdown. (B) Relative expression of Postn protein in cardiac fibroblasts with si-Postn knockdown. (C) CCK-8 assay demonstrated a significant decrease in cell viability following Postn knockdown. (D) Transwell migration assays showed that Postn knockdown significantly reduced the migration ability of cardiac fibroblasts. (E) Adhesion assays revealed a significant reduction in cell adhesion ability following Postn knockdown. (F) Annexin V-FITC/PI double staining flow cytometry showed that Postn knockdown significantly induced apoptosis in cardiac fibroblasts compared to the NC group.

Similar articles

References

    1. Salari, N. et al. The global prevalence of myocardial infarction: A systematic review and meta-analysis. BMC CARDIOVASC. DISOR. 23, 206 (2023). - PMC - PubMed
    1. Kayikcioglu, M., Ozkan, H. S. & Yagmur, B. Premature myocardial infarction: A rising threat. BALK. MED. J.39, 83–95 (2022). - PMC - PubMed
    1. Krittanawong, C., Khawaja, M., Tamis-Holland, J. E., Girotra, S. & Rao, S. V. Acute myocardial infarction: Etiologies and mimickers in young patients. J. AM. HEART ASSOC.12, e029971 (2023). - PMC - PubMed
    1. Wang, L. et al. Fibroblast-specific knockout of METTL1 attenuates myocardial infarction-induced cardiac fibrosis. LIFE SCI.329, 121926 (2023). - PubMed
    1. Li, X. et al. Development and comparison of machine learning-based models for predicting heart failure after acute myocardial infarction. BMC MED. Inf. DECIS.23, 165 (2023). - PMC - PubMed

Substances