

Optimal timing to estimate moose Alces alces demographic parameters using remote cameras
- PMID: 40595881
- PMCID: PMC12214549
- DOI: 10.1038/s41598-025-05603-y
Optimal timing to estimate moose Alces alces demographic parameters using remote cameras
Abstract
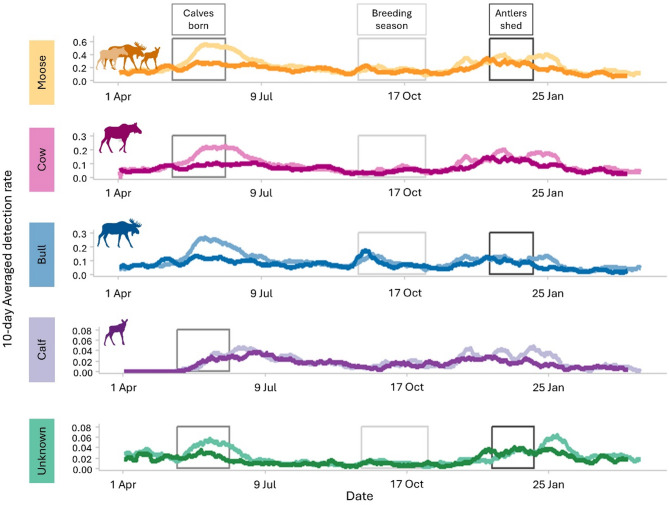
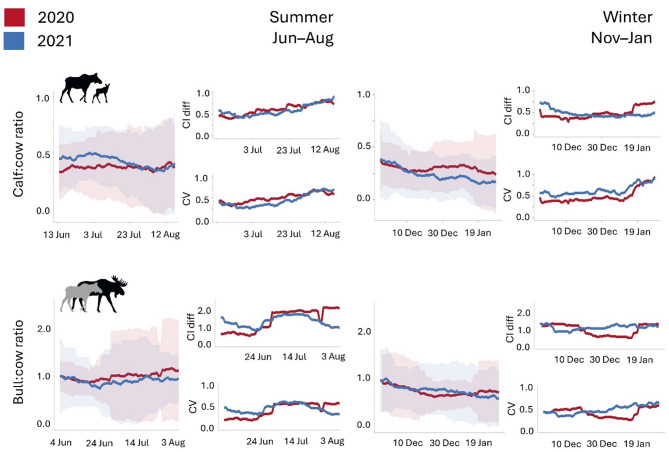
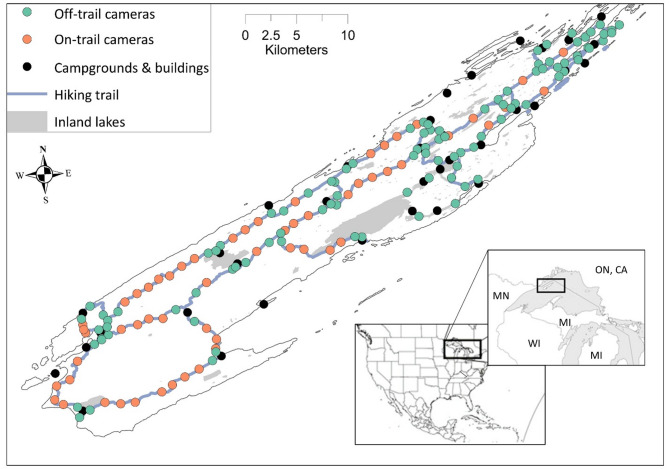
Obtaining estimates of demographic parameters are fundamental for managing species. However, survey timing and duration influences the precision and accuracy of estimates. We used motion-activated camera images to investigate the effect of survey duration, timing, camera density and on- or off-trail placement on detection rates, sex and age ratios, and relative abundance estimates of moose (Alces alces) in Isle Royale National Park (IRNP), Michigan, USA. Variations in detection rates reflected moose life history patterns and suggested the optimal times to estimate demographic ratios and population relative abundance. We recommend camera surveys of 25-days during mid-June-mid-July and early December-early January to produce consistent and precise calf: cow and bull: cow ratios. On-trail cameras returned greater detection rates and relative abundance estimates, but decreased precision for summer bull: cow and calf: cow ratios than off-trail cameras. Subsampling camera densities to 3 cameras/km2 decreased precision and consistency for density and ratio estimates. We recommend estimating moose relative abundance during early December-early January, using > 3 cameras/km2 placed on and off-trail. Pairing life history events with high detection rates can be used to identify optimal survey periods and could be applied to other species.
Keywords: Alces alces; Age ratios; Detection rate; Moose; Relative abundance; Ungulate.
© 2025. The Author(s).
Conflict of interest statement
Declarations. Competing interests: The authors declare no competing interests.
Figures


Similar articles
-
Red-light cameras for the prevention of road traffic crashes.Cochrane Database Syst Rev. 2005 Apr 18;2005(2):CD003862. doi: 10.1002/14651858.CD003862.pub2. Cochrane Database Syst Rev. 2005. PMID: 15846684 Free PMC article.
-
Sex-specific trade-offs influence thermoregulation under climate change.Ecology. 2025 Jun;106(6):e70138. doi: 10.1002/ecy.70138. Ecology. 2025. PMID: 40528510 Free PMC article.
-
Estimating abundance of harvested populations at the management unit scale.PLoS One. 2025 Jun 18;20(6):e0326454. doi: 10.1371/journal.pone.0326454. eCollection 2025. PLoS One. 2025. PMID: 40531923 Free PMC article.
-
Systemic corticosteroids for the treatment of COVID-19: Equity-related analyses and update on evidence.Cochrane Database Syst Rev. 2022 Nov 17;11(11):CD014963. doi: 10.1002/14651858.CD014963.pub2. Cochrane Database Syst Rev. 2022. PMID: 36385229 Free PMC article.
-
Mammographic density, endocrine therapy and breast cancer risk: a prognostic and predictive biomarker review.Cochrane Database Syst Rev. 2021 Oct 26;10(10):CD013091. doi: 10.1002/14651858.CD013091.pub2. Cochrane Database Syst Rev. 2021. PMID: 34697802 Free PMC article.
References
-
- Yoccoz, N. G., Nichols, J. D. & Boulinier, T. Monitoring of biological diversity in space and time. Trends Ecol. Evol.16, 446–453 (2001).
-
- Lindenmayer, D. B. et al. Value of long-term ecological studies. Austral Ecol.37, 745–757 (2012).
-
- Harris, N. C., Kauffman, M. J. & Mills, L. S. Inferences about ungulate population dynamics derived from age ratios. J. Wildl. Manage.72, 1143–1151 (2008).
-
- DeCesare, N. J. et al. Estimating ungulate recruitment and growth rates using age ratios. J. Wildl. Manage.76, 144–153 (2012).
-
- Van Ballenberghe, V. Productivity estimates of moose populations: a review and re- evaluation. Alces: J. Devoted Biology Manage. Moose. 15, 1–18 (1979).
MeSH terms
LinkOut - more resources
Full Text Sources
