. 2025 Jul 1;15(1):20891.
doi: 10.1038/s41598-025-05105-x.

Identification of a LncRNA based CeRNA network signature to establish a prognostic model and explore potential therapeutic targets in gastric cancer

Affiliations

Identification of a LncRNA based CeRNA network signature to establish a prognostic model and explore potential therapeutic targets in gastric cancer

Yuanqing An et al. Sci Rep. .

Abstract

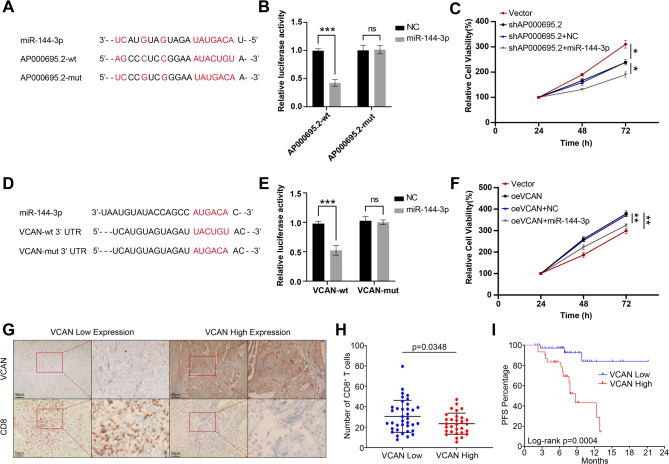
Numerous studies have demonstrated that long non-coding RNA (lncRNA) play critical roles in regulating physiological processes and contributing to pathological diseases. This study aimed to develop lncRNA-based signatures to predict the prognostic risk of gastric cancer (GC) patients and provide therapeutic guidance. Gene expression profiles and clinical information were obtained from The Cancer Genome Atlas (TCGA) database. Differentially expressed RNAs, including lncRNA, miRNA, and mRNA, in cancerous and adjacent non-cancerous tissues were analyzed using Weighted correlation network analysis (WGCNA) and construction of a lncRNA-miRNA-mRNA competing endogenous RNA (ceRNA) network. Then, a lncRNA-based risk model was constructed by Cox regression and Lasso regression analyses. A ceRNA network comprising 235 lncRNAs, 60 miRNAs, and 52 mRNAs was identified. Based on the expression of five lncRNAs (including AC010333.1, LINC01579, AP000695.2, LINC00922 and AL121772.1) screened from the ceRNA network, a lncRNA-based risk model was developed, which effectively predict the prognosis of GC patients. The expression of AP000695.2 was significantly associated with poor prognosis and higher T stage. The knockdown of AP000695.2 inhibited the growth of GC cells both in vitro and in vivo. Transfection with miR-144-3p and miR-7-5p mimics attenuate the up-regulation of targets genes, including CDH11, COL5A2, COL12A1, and VCAN, which was induced by AP000695.2, suggesting a ceRNA mechanism. Additionally, elevated VCAN expression was correlated with poorer survival and a reduced response to anti-PD-1 immune checkpoint inhibitor treatment of GC. This study established a lncRNA-based risk model for predicting the prognosis of GC patients and identified a ceRNA mechanism involving AP000695.2-miR-144-3p-VCAN, presenting novel biomarkers and therapeutic targets for GC treatment.

Keywords: Gastric cancer; Immunotherapy; LncRNA; Prognostic model; Tumor microenvironment; WGCNA.


Conflict of interest statement

Declarations. Competing interests: The authors declare no competing interests.

Figures

Fig. 1
Fig. 1
Construction of ceRNA network. (A) The volcano plot of the 5578 DElncRNAs. (B, C) Scale-free index analysis and mean connectivity analysis, for selecting the best soft threshold of WGCNA for lncRNAs. (D, E) Clustering dendrograms of lncRNAs: Different colors below indicate different co-expression modules. (F) Module-trait associations: Each row represents a module eigengene and each column represents a clinical trait. Each cell includes the corresponding correlation and P -value. (G) The intersected lncRNAs from MEblue and DElncRNAs. (H) The volcano plot of the 238 DEmiRNAs. (I, J) Scale-free index analysis and mean connectivity analysis, for selecting the best soft power of WGCNA for miRNAs. (K, L) Clustering dendrograms of miRNAs: Different colors below indicate different co-expression modules. (M) Module-trait relationship. (N) The intersected miRNAs from MEturquoise and DEmiRNAs. (O) The volcano plot of the 4480 DEmRNAs. (P, Q) Scale-free index analysis and mean connectivity analysis, for selecting the best soft power of WGCNA for miRNAs. (R, S) Clustering dendrograms of miRNAs. (T) Module-trait relationship. (U) The intersected mRNAs from MEgreen and DEmRNAs. (V) lncRNA-miRNA-mRNA regulatory network.
Fig. 2
Fig. 2
Construction and validation of the lncRNA-related prognostic model based ceRNA network. (A) Coefficient curve. Different colors represent different genes. No zero values were selected as a penalty coefficient. (B) Partial likelihood deviance of overall survival for the LASSO coefficient profiles. Twelve features with non-zero coefficients were selected by optimal lambda. (C) Heatmap expression of the prognostic lncRNAs in the different risk groups in the training cohort. (D, E) The risk score distributions and the survival times in the training cohort. Patients were divided according to their median risk score. (F) Kaplan-Meier analysis of OS between the high- and low-risk groups in the training cohort. (G) The time-dependent ROC curve for OS prediction at 5 years in the training cohort. (H) Heatmap expression of the prognostic lncRNAs in the different risk groups in the test cohort. (I, J) The risk score distributions and the survival times in the test cohort. The patients were divided according to their median risk score. (K) Kaplan-Meier analysis of OS between the high- and low-risk groups in the test cohort. (L) The time-dependent ROC curve for predicting OS at 5 years in the test cohort. (M, N) Forrest plot of the univariate (M) and multivariate (N) association of the risk-score model and clinicopathological characteristics with overall survival. (O) Multi-index ROC curve of the 5-lncRNA signature risk score and other indicators. (P) The nomogram is based on risk score, age, and clinicopathological characteristics to predict the 1-, 2-, and 3-year survival in STAD patients. (Q) Calibration curves for the 1, 2, and 3 years of training cohort.
Fig. 3
Fig. 3
Characteristics of the five lncRNAs included in the risk model. (AE) Kaplan-Meier survival curves for the 5 prognostic lncRNAs, including AL121772.1 (A), AP000695.2 (B), AC010333.1 (C), LINC00922 (D) and LINC01579 (E) in the TCGA-STAD cohort. (F–J) Differential expression of AL121772.1 (F), AP000695.2 (G), AC010333.1 (H), LINC00922 (I) and LINC01579 (J) in GC and adjacent tissues in TCGA-STAD cohort. (K–O) The expression of AL121772.1 (K), AP000695.2 (L), AC010333.1 (M), LINC00922 (N) and LINC01579 (O) in GC and adjacent tissues in clinical GC patients. (P-R) The expression of the 5 prognostic lncRNAs in differential T (P), N (Q) and M (R) staging. (S) Verification of AP000695.2 knockdown in MKN-45-shAP000695.2 cells. (T) Proliferation of MKN-45 cells after knockdown of AP000695.2. (U) Growth curve of transplanted tumor in nude mice. (V) Visual image and weight map of the transplanted tumor in mice after dissection. P values were shown as: ns, not significant; *P < 0.05; **P < 0.01; ***P < 0.001.
Fig. 4
Fig. 4
Function and downstream genes of AP000695.2. (A) Sankey diagram showing the lncRNA-miRNA-mRNA axis of AP000695.2. (B–N) Kaplan-Meier survival curves for the 13 mRNAs co-expressed with AP000695.2, including CDH11 (B), COL11A11 (C), COL12A1 (D), COL1A2 (E), COL5A1 (F), COL5A2 (G), LOXL2 (H), PRRX1 (I), STC2 (J), THBS2 (K), TIMP3 (L), TNFSF11 (M) and VCAN (N) in TCGA-STAD cohort. (O–R) The relative expression level of CDH11 (O), COL5A2 (P), COL12A1 (Q), and VCAN (R) in MKN-45-shAP000695.2 cells after transfection with miR-144-3p mimic. (S-U) The relative expression level of COL5A2 (S), COL12A1 (T) and VCAN (U) in MKN-45-shAP000695.2 cells after transfection with miR-7-5p mimic. (V–Y) Enrichment of GSEA in high and low-expression of CDH11 (V), COL5A2 (W), COL12A1 (X) and VCAN (Y). *P < 0.05; **P < 0.01; ***P < 0.001.
Fig. 5
Fig. 5
Effect of key genes of 13 mRNAs co-expressed with AP000695.2 on immune cell infiltration and immune treatment. (A) Differential expression of 13 genes co-expressed with AP000695.2 of GC patients in the Pembrolizumab treatment-sensitive group and treatment-resistant group. (B–E) The ROC curves for the impact of expression of COL12A1 (B), COL1A2 (C), COL5A1 (D) and VCAN (E) on ORR. (F) The differences in the proportions of 22 immune cells between high- and low-expression groups of COL12A1. (G) Infiltration of fibroblasts between high- and low-expression groups of COL12A1. (H) The differences in the proportions of 22 immune cells between high- and low-expression groups of COL1A2. (I) Infiltration of fibroblasts between high- and low-expression groups of COL1A2. (J) The differences in the proportions of 22 immune cells between high- and low-expression groups of COL5A1. (K) Infiltration of fibroblasts between high- and low-expression groups of COL5A1. (L) The differences in the proportions of 22 immune cells between high- and low-expression groups of VCAN. (M) Infiltration of fibroblasts between high- and low-expression groups of VCAN. (N–Q) Expression of immune checkpoint in the low- and high-expression groups of COL12A1 (N), COL1A2 (O), COL5A1 (P) and VCAN (Q). *P < 0.05; **P < 0.01; ***P < 0.001.
Fig. 6
Fig. 6
Verification of AP000695.2/miR-144-3p/VCAN axis. (A) The predicted binding sites of miR-144-3p to AP000695.2 sequence using starbase. (B) Dual-luciferase reporter assay of luciferase activity in MKN-45 cells co-transfected with miR-144-3p and AP000695.2-wt/AP000695.2-mut. (C) Proliferation of MKN-45 cells with knockdown of AP000695.2 or with AP000695.2 knockdown and transfection of miR-144-3p. (D) Binding sites of miR-144-3p to the 3’UTR of VCAN predicted in the TargetScan website. (E) Relative luciferase activity in MKN-45 cells co-transfected with miR-144-3p and either VCAN-wt or VCAN-mut. (F) Proliferation curve of MKN-45 cells with transfection of VCAN overexpression vector or transfection of VCAN overexpression vector and miR-144-3p mimic. (G) Representative images of CD8+ T cell infiltration in gastric cancer tissues with different level of VCAN expression. (H) The level of CD8+ T cells infiltration in gastric cancer tissues with high and low VCAN expression. (I) Kaplan-Meier survival curve of 65 clinical gastric cancer patients in high and low-expression groups of VCAN. *P < 0.05; **P < 0.01; ***P < 0.001.

Similar articles

References

    1. Machlowska, J. et al. Gastric cancer: epidemiology, risk factors, classification, genomic characteristics and treatment Strategies[J]. Int. J. Mol. Sci.21 (11), 4012 (2020). - PMC - PubMed
    1. Sexton, R. E. et al. Gastric cancer: a comprehensive review of current and future treatment strategies[J]. Cancer Metastasis Rev.39 (4), 1179–1203 (2020). - PMC - PubMed
    1. Zhou, J. et al. Clinical significance of circulating tumor cells in gastric cancer patients[J]. Oncotarget8 (15), 25713–25720 (2017). - PMC - PubMed
    1. Djebali, S. et al. Landscape of transcription in human cells[J]. Nature489 (7414), 101–108 (2012). - PMC - PubMed
    1. Xie, S. S. et al. Emerging roles of non-coding rnas in gastric cancer: pathogenesis and clinical implications[J]. World J. Gastroenterol.22 (3), 1213–1223 (2016). - PMC - PubMed