. 2025 Jul 1;15(1):22134.
doi: 10.1038/s41598-025-04745-3.

Metabolic features of patients with repeated Omicron infections highlight new targets for therapeutic intervention

Affiliations

Metabolic features of patients with repeated Omicron infections highlight new targets for therapeutic intervention

Jiaying Zhang et al. Sci Rep. .

Abstract

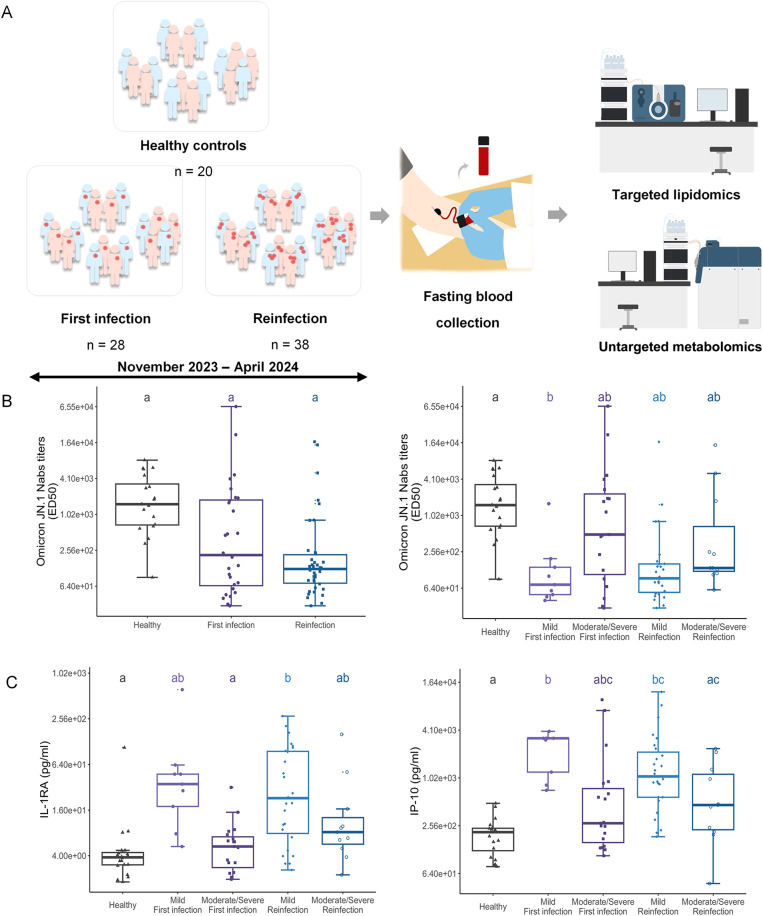
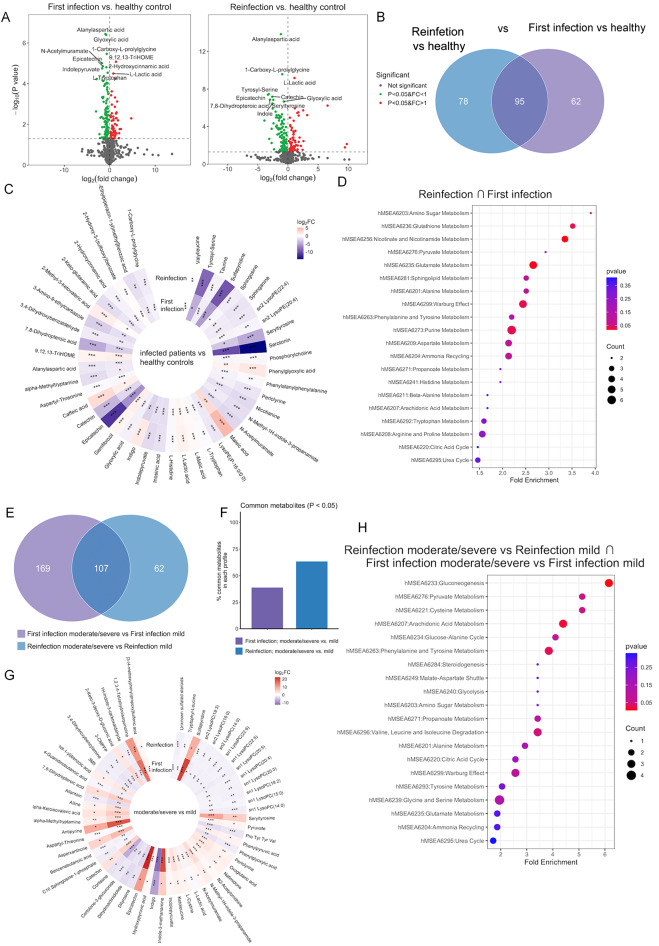
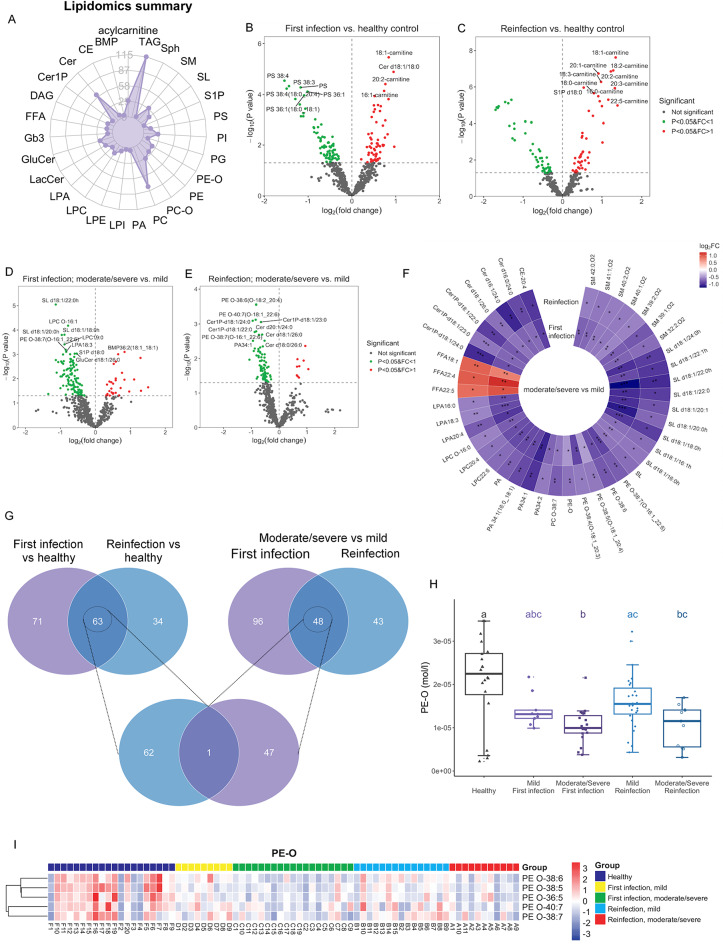
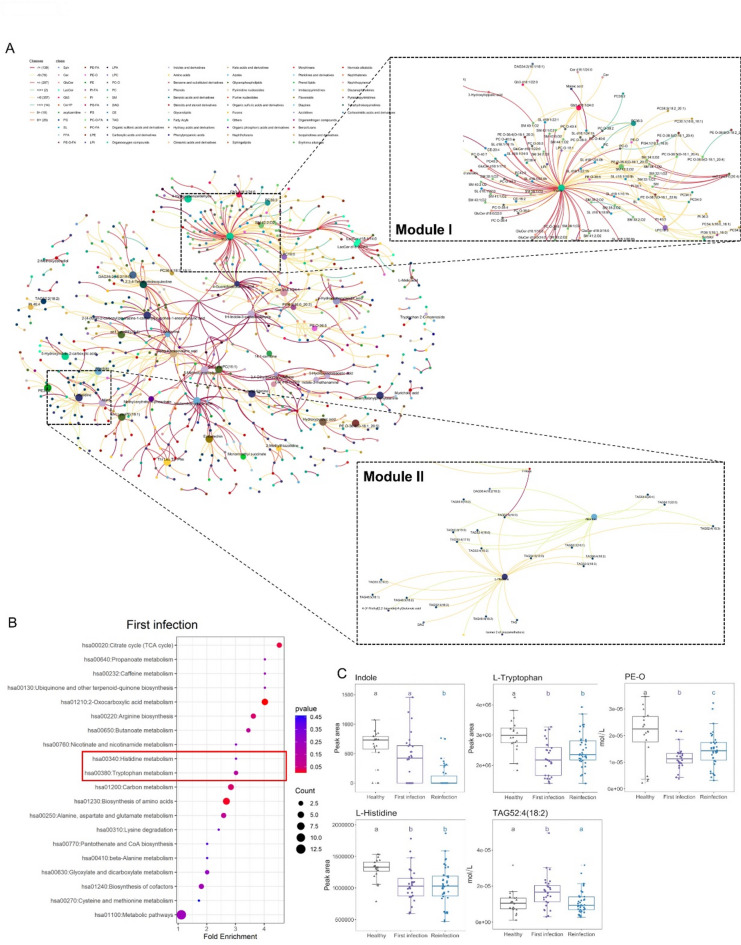
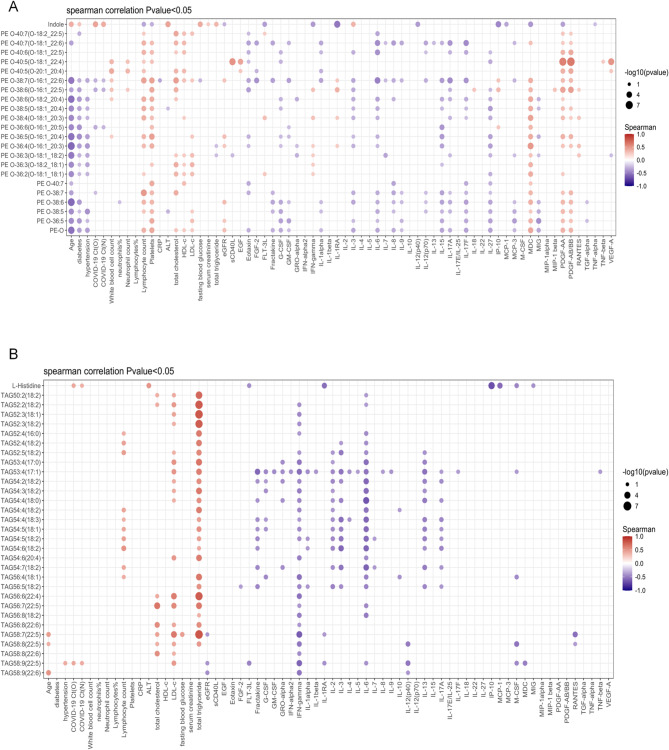
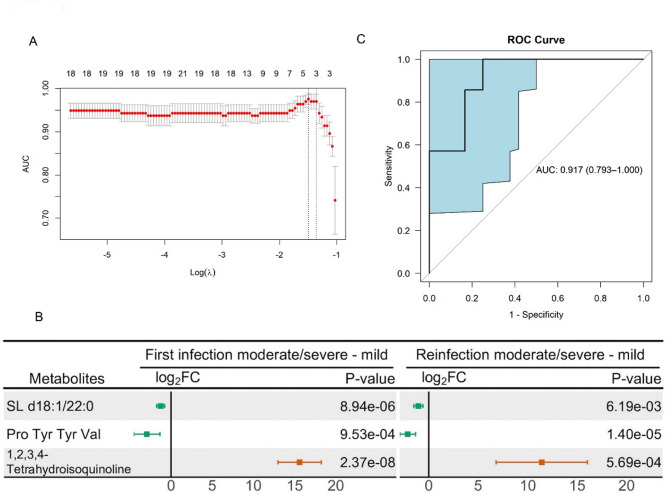
Emerging evidence underscores the role of metabolites in immunomodulation. We surmise that specific metabolic signatures might be conserved during repeated Omicron infections. To verify our hypothesis, patients with first (n = 28) and repeated Omicron infections (n = 38) between November 2023 to April 2024 were recruited into this study. Healthy controls (n = 20) were enrolled in the same period. Comprehensive serum metabolome and lipidome were quantitated using mass spectrometric approaches. The neutralizing activity of sera against the pseudotyped Omicron variant JN.1 was determined. Circulating cytokines/chemokines were quantified using a Bioplex Kit Assay. The proportion of severe/moderate infections was 2.9-fold higher in first infection patients compared to reinfection patients (67.9% vs. 23.7%, p = 0.004). Geometric mean titers (GMT) for the Omicron variant JN.1 were higher in moderate/severe infections than mild infections, but non-significant between first and repeated infections. We observed perturbed coregulation between plasma indoles and circulating plasmalogen phospholipids in Omicron-infected patients, while disrupted histidine-triacylglycerol coregulation was specific to first-infections. A panel of three lasso-selected metabolites (SL d18:1/22:0 h, tetra-peptide Pro Tyr Tyr Val, and 1,2,3,4-Tetrahydroisoquinoline) effectively differentiated moderate/severe Omicron infections from mild ones (AUROC at 0.917, 95% CI 0.793-1.000). Our findings highlight modifiable metabolic signatures as possibly new therapeutic interventions against rapidly evolving variants of SARS-CoV-2.

Keywords: Host-microbe interactions; Metabolites; Omicron; Reinfection; Severity.


Conflict of interest statement

Declarations. Competing interests: The authors declare no competing interests.

Figures

Fig. 1
Fig. 1
Study design and clinical demographics. (A) This study enrolled a group of healthy controls (n = 20), patients first infected with Omicron (n = 28) and patients repeatedly infected with Omicron (n = 38) during the Omicron outbreak from November 2023 to April 2024. High-coverage, quantitative targeted lipidomics and untargeted metabolomics were conducted on fasting plasma samples collected within 7 days of symptom onset to elucidate metabolic features associated with Omicron infections. (B,C) Changes in the levels of neutralizing antibodies (Nabs) against Omicron JN.1 (B) and selected plasma cytokines including IL-1RA, IP-10, IL-7 and MDC. (C) across healthy controls (n = 20), first infection (n = 28) and reinfection (n = 38) Omicron patients categorized by different disease severity (mild and moderate/severe). In all boxplots, median is indicated by the horizontal line and the first and third quartiles are represented by the box edges. The lower and upper whiskers extend from the hinges to the smallest and largest values, respectively, with individual samples indicated as dots. P values of pairwise comparisons based on two-sided Games-Howell test were presented using letter-based representation, with two groups sharing a common letter being not statistically different at P < 0.05.
Fig. 2
Fig. 2
Plasma metabolome signatures of Omicron infections. For all pairwise comparisons, P values from two-sided Student’s t-test were presented, where n = 20 for healthy controls, n = 28 for first infection and n = 38 for reinfection Omicron patients. (A) Volcano plots illustrate differential plasma metabolites in first infection (left panel) and reinfection (right panel) patients compared to healthy controls. (B) Venn diagram displays the number of significant (P < 0.05) differential metabolites that overlapped between first infection compared to healthy controls and reinfection compared to healthy controls. (C) Circos plot illustrates top 30 differential metabolites ranked by ascending P values in first infection patients (inner rim) and reinfection patients (outer rim) relative to healthy controls. * P < 0.05, ** P < 0.01, *** P < 0.001. Color bar indicates log2(fold-change), where red indicates increase and blue indicates decrease in moderate/severe infection relative to mild infection, respectively. (D) Over-representation analysis of dysregulated pathways from the small molecule pathway database (SMPD) based on differential metabolites that were conserved between first infection and reinfection patients compared to healthy controls. (E) Venn diagram displays the number of significant (P < 0.05) metabolites in moderate/severe infections compared to mild infections that were conserved between first infection and reinfection Omicron patients. (F) Barplot on the percentages of differential metabolites (P < 0.05) in moderate/severe infections relative to mild infections that were conserved between first infection and reinfection patients. (G) Circos plot illustrates top 30 differential metabolites ranked by ascending P values in moderate/severe infections relative to mild infections amongst first infection patients (inner rim) and reinfection patients (outer rim). * P < 0.05, ** P < 0.01, *** P < 0.001. Color bar indicates log2(fold-change), where red indicates increase and blue indicates decrease in moderate/severe infection relative to mild infection, respectively. (H) Over-representation analysis of dysregulated pathways from the small molecule pathway database (SMPD) based on differential metabolites between moderate/severe infections compared to mild infections that were conserved in first infection and reinfection patients. FC, fold change; LysoPE, lysophosphatidylethanolamine; LysoPC, lysophosphatidylcholine.
Fig. 3
Fig. 3
Plasma lipidome signatures of Omicron infections. For all pairwise comparisons, P values from a two-sided Student’s t-test were used (n = 20 healthy controls, n = 28 first infection, n = 38 reinfection Omicron patients). (A) Radar plot of plasma lipidome diversity comprising 565 lipids from 27 classes. (B-E) Volcano plots illustrate differential plasma lipids in first infection (B) and reinfection (C) patients versus healthy controls, as well as in moderate/severe infections relative to mild infections amongst first infection (D) and reinfection (E) patients, respectively. (F) Circos plot ranks the top 30 differential lipids in moderate/severe infections (inner rim: first infection, outer rim: reinfection). * P < 0.05, ** P < 0.01, *** P < 0.001. Color bar indicates log2(fold-change): red (increase), blue (decrease) in severe vs. mild cases. (G) Venn diagrams display the number of significant (P < 0.05) lipids that were conserved between Omicron infection (infected vs. healthy controls) and symptom severity (moderate/severe vs. mild infections) in both first infection and reinfection patients. (H) Boxplot illustrates changes in summed PE-Os across healthy controls (n = 20), first infection mild patients (n = 9), first infection moderate/severe patients (n = 19), reinfection mild patients (n = 27), reinfection moderate/severe patients (n = 11). Median is indicated by the horizontal line and the first and third quartiles are represented by the box edges. The lower and upper whiskers extend from the hinges to the smallest and largest values, respectively, with individual samples indicated as dots. P values of pairwise comparisons based on two-sided Games-Howell test were presented using letter-based representation, with two groups sharing a common letter being not statistically different at P < 0.05. (I) Heatmap displays changes in individual PE-O species across healthy controls (n = 20), first-infection mild patients (n = 9), first infection moderate/severe patients (n = 19), reinfection mild patients (n = 27), reinfection moderate/severe patients (n = 11). Lipid levels were expressed and plotted as Z-scores. BMP, bis(monoacylglycerol)phosphate; CE, Cholesterol ester; Cer, ceramides; Cer1P, ceramide-1-phosphate; DAG, diacylglycerol; FFA, free fatty acid; Gb3, globotroaosylceramide; GluCer, glucosylceramide; LacCer, lactosylceramide; LPA, lysophosphatidic acid; LPC, lysophosphatidylcholine; LPE, lysophosphatidylethanolamine; LPI, lysophosphatidylinositol; PA, phosphatidic acid; PC, phosphatidylcholine; PC-O, plasmalogen phosphatidylcholine; PE, phosphatidylethanolamine; PE-O, phosphatidylethanolamine; PG, phosphatidylglycerol; PI, phosphatidylinositol; PS, phosphatidylserine; SIP, sphingosine-1-phosphate; SL, sulfatide; SM, sphingomyelin; Sph, sphingosine; TAG, triacylglycerol.
Fig. 4
Fig. 4
Trans-omics integration of lipidome and metabolome changes. (A) MEGENA network illustrates differential correlations between lipid and metabolites in first infection (n = 28) relative to healthy controls (n = 20). Only lipid/metabolite pairs with significant differential correlations (pValDiff < 0.0001) were included. Sign/sign indicates direction and strength of correlation in healthy controls and first infection, respectively, and number that follows indicates number of lipid/metabolite pairs in the global network exhibiting this pattern of change. For instance, mustard yellow edges +/0 (357) in the upper legend of the global network indicates that correlation between connected lipid/metabolite pair was positive + in healthy controls, and the correlation was lost (became 0) in first infection patients. Two modules of interest were boxed and enlarged for emphasis. (B) Over-representation analysis of dysregulated pathways from the Kyoto Encyclopedia of Genes and Genomes (KEGG) database based on differential metabolites (P < 0.05 from Student’s t-test) between first infection patients (n = 28) relative to healthy controls (n = 20). (C) Boxplots of changes in specific metabolites and lipids from Module I (upper panel) and Module II (lower panel) of the global differential correlation network. In all box plots, the median is indicated by the horizontal line and the first and third quartiles are represented by the box edges. The lower and upper whiskers extend from the hinges to the smallest and largest values, respectively, with individual samples indicated as dots. P values from Student’s t-test were indicated using a letter-based representation with two groups sharing a common letter being not statistically different at P < 0.05. TCA, tricarboxylic acid; PE-O, plasmalogen phosphatidylethanolamine; TAG, triacylglycerol.
Fig. 5
Fig. 5
Correlations with clinical demographics and laboratory biochemistry. Correlation plots illustrate spearman correlations between clinical indices and specific plasma metabolites and lipids in Module I and Module II of the MEGENA global network. Only correlations with P < 0.05 were indicated with colored circles. Positive correlations were shown in red and negative correlations were shown in blue, with sizes of circles representing the strength of the significance p-value and intensity of color representing the magnitude of the correlation coefficients. (A) Correlation analyses between plasma indoles and PE-Os with clinical and biochemical measures amongst Omicron-infected patients (n = 66). (B) Correlation analyses between plasma L-histidine and top 30 differential TAGs with clinical and biochemical measures amongst first infection Omicron patients (n = 28). Differential TAGs were selected based on ascending P values from Student’s t-test between first infection patients (n = 28) and healthy controls (n = 20). PE O, plasmalogen phosphatidylethanolamine; CRP, C-reactive protein; ALT, alanine transaminase; HDL-c, high-density lipoprotein cholesterol; LDL-c, low-density lipoprotein cholesterol; eGFR, estimated glomerular filtration rate; sCD40L, soluble cluster of differentiation 40 ligand; EGF, epidermal growth factor; FGF-2, fibroblast growth factor 2; FLT-3 L, FMS-like tyrosine kinase 3 ligand; G-CSF, granulocyte colony stimulating factor; GM-CSF, granulocyte-macrophage colony stimulating factor; GRO-alpha, growth regulated protein alpha; IFN, interferon; IL, interleukin; MCP, monocyte chemoattractant protein; MDC, macrophage-derived chemokine; MIG, monokine induced by interferon-gamma; MIP, macrophage inflammatory protein; PDGF, platelet-derived growth factor; RANTES, regulated upon activation, normal T cell expressed and presumable secreted; TGF, transforming growth factor; TNF, tumor necrosis factor; VEGF, vascular endothelial growth factor; TAG, triacylglycerol; CRP, C-reactive protein. ALT, alanine transaminase.
Fig. 6
Fig. 6
Metabolite panel segregating Omicron-infected patients of different severity. (A) Plot of test MSE by log (λ) value from lasso analysis that selects significant variables differentiating moderate/severe infections from mild infections amongst Omicron-infected patients (n = 66) based on optimal λ. (B) Three lasso-selected variables that discriminate Omicron-infected patients of different disease severity. (C) Area under receiver operating characteristic curve illustrates the performance of three lasso-selected variables in differentiating Omicron patients of different severity, with age and gender as covariates. AUC, area under the curve; Log, logarithm; ROC, receiver operating curve; FC, fold change; SL, sulfatide; Pro, proline; Tyr, tyrosine; Val, valine.

Similar articles

References

    1. Roemer, C. et al. SARS-CoV-2 evolution in the Omicron era. Nat. Microbiol.8, 1952–1959. 10.1038/s41564-023-01504-w (2023). - PubMed
    1. Araf, Y. et al. Omicron variant of SARS-CoV-2: genomics, transmissibility, and responses to current COVID-19 vaccines. J. Med. Virol.94, 1825–1832. 10.1002/jmv.27588 (2022). - PMC - PubMed
    1. Dyer, O. Covid-19: South africa’s surge in cases deepens alarm over Omicron variant. Bmj375, n3013. 10.1136/bmj.n3013 (2021). - PubMed
    1. Shanmugaraj, B., Malla, A., Khorattanakulchai, N. & Phoolcharoen, W. SARS-CoV-2 Omicron variant: could it be another threat? J. Med. Virol.94, 1284–1288. 10.1002/jmv.27532 (2022). - PMC - PubMed
    1. Uemura, K., Kanata, T., Ono, S., Michihata, N. & Yasunaga, H. The disease severity of COVID-19 caused by Omicron variants: A brief review. Ann. Clin. Epidemiol.5, 31–36. 10.37737/ace.23005 (2023). - PMC - PubMed

Supplementary concepts