

Effects of ATF2/TSC1 on epilepsy by modulating the microphages polarization of microglia
- PMID: 40595935
- PMCID: PMC12214619
- DOI: 10.1038/s41598-025-04914-4
Effects of ATF2/TSC1 on epilepsy by modulating the microphages polarization of microglia
Abstract
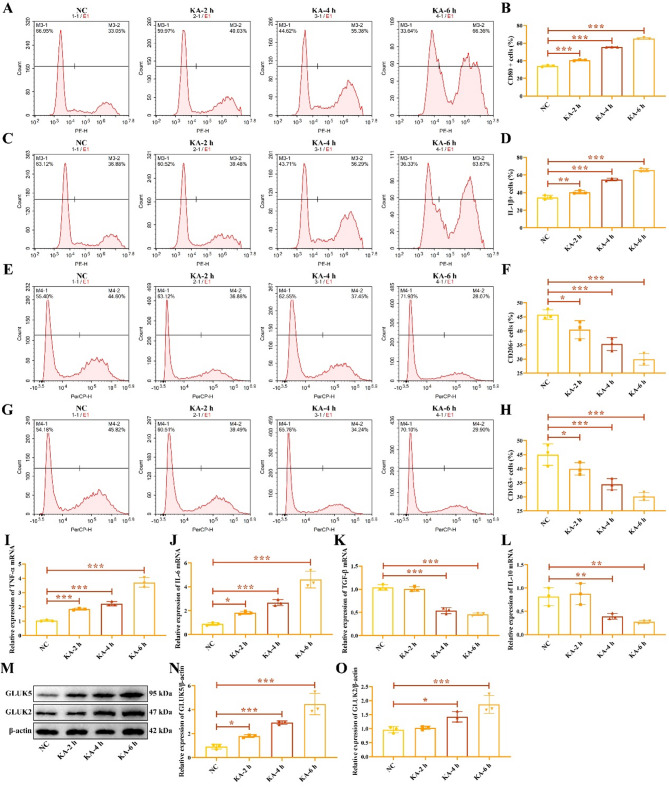
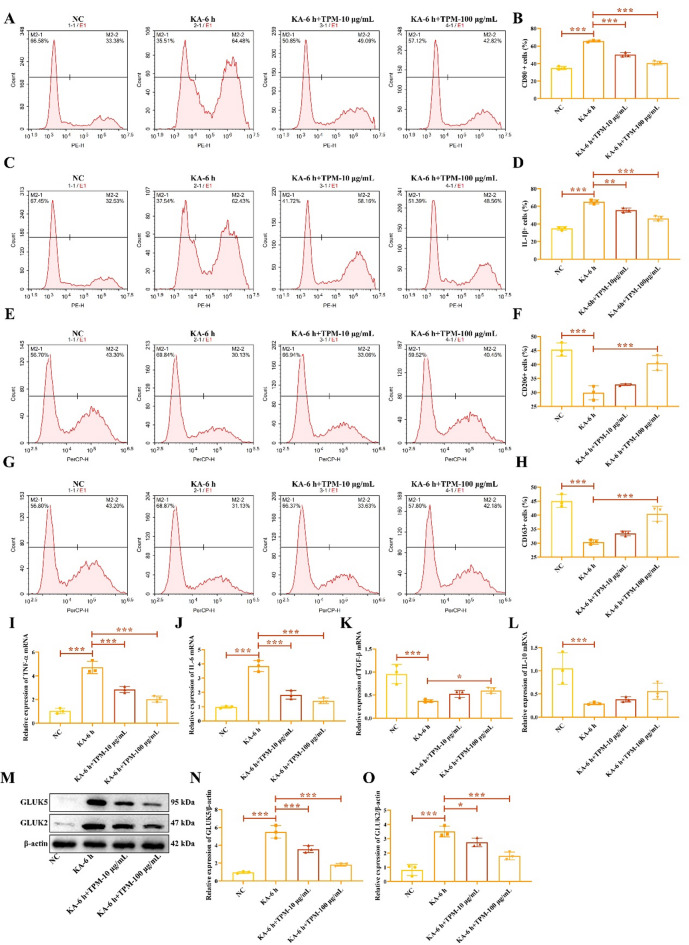
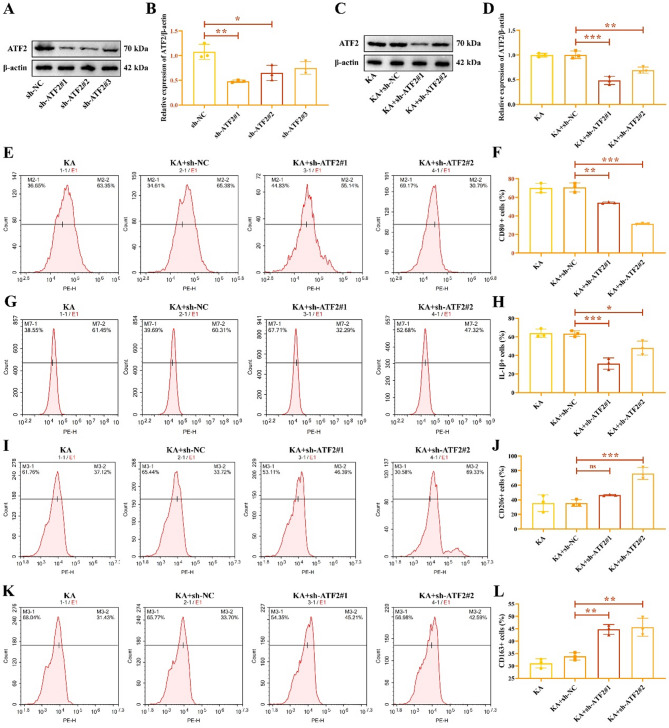
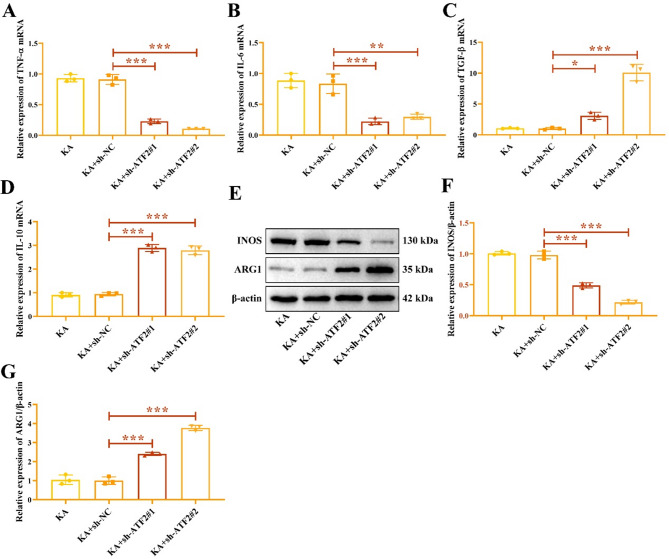
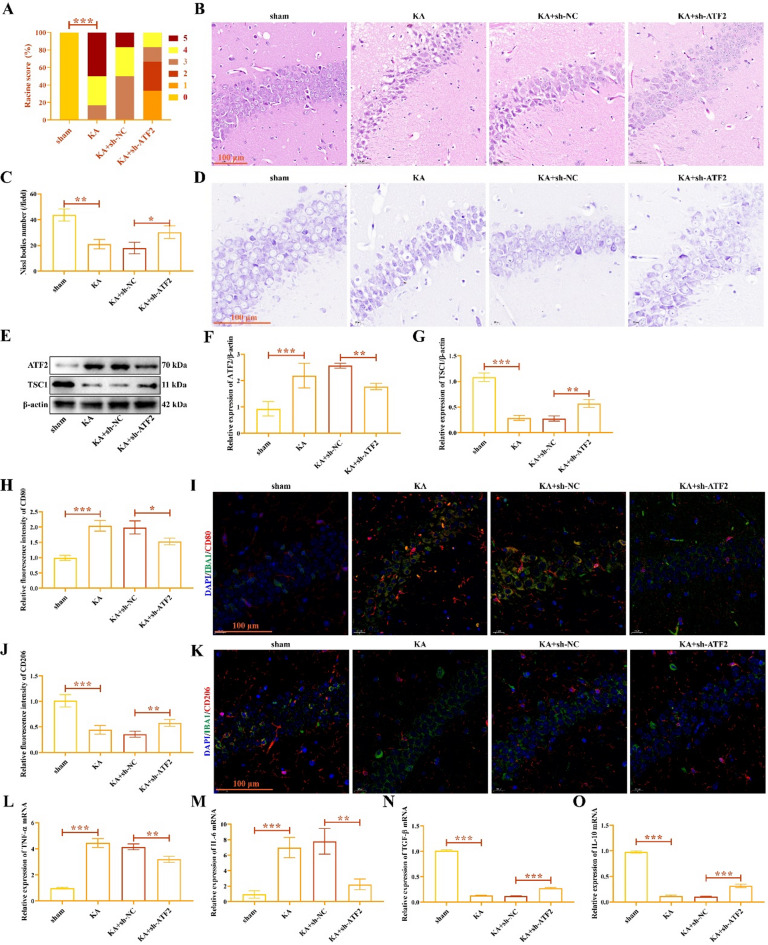
Epilepsy (EP) is a chronic nervous system disease characterized by recurrent attacks, and its causes are complicated. Inflammatory reaction mediated by microglia is an important factor in the progression of EP. Activating transcription factor 2 (ATF2) can be used as a transcription factor to regulate the microglia-mediated inflammatory response, but its role in EP is unclear. In this study, kainic acid (KA) was used to induce the EP cell and mouse model. Real-time polymerase chain reaction was used to detect ATF2, TNF-α, IL-6, TGF-β, and IL-10 mRNA expression. ATF2, INOS, ARG1, and TSC1 protein levels was examined by western blot. The fluorescence intensity of ATF2, IBA1, CD80, and CD206 was examined by immunofluorescence staining. The cell ratios of CD80, IL-1β, CD206, and CD63 were detected by flow cytometry. Dual-luciferase reporter and chromatin immunoprecipitation assays were conducted to verify the interaction between ATF2 and TSC1. Hematoxylin & eosin and Nissl staining were used to observe the structure of hippocampus and Nissl bodies. The results indicated that KA induced M1 polarization of HMC3 cells and increased the levels of TNF-α and IL-6 mRNA by activating KA receptors, and inhibiting KA receptors attenuated the M1 polarization of KA-induced HMC3 cells. ATF2 expression was increased in KA-induced HMC3 cells and hippocampal tissues of mouse, while TSC1 expression was repressed. ATF2 knockdown diminished the M1 polarization of KA-induced HMC3 cells, enhanced the M2 polarization, and relieved neuroinflammation in EP mouse. TSC1 overexpression inhibited M1 polarization in KA-induced HMC3 cells. Dual luciferase and chromatin immunoprecipitation results revealed that ATF2 bound to the promoter of TSC1 and negatively regulated the transcription of TSC1. In conclusion, inhibition of ATF2 and promotion of TSC1 transcription may be a new pathophysiological mechanism for the treatment of EP neuroinflammation.
Keywords: Activating transcription factor 2; Epilepsy; Microglia; Microphages polarization; Tuberous sclerosis complex 1.
© 2025. The Author(s).
Conflict of interest statement
Declarations. Competing interests: The authors declare no competing interests. Ethics: The animal experiments were approved by the Experimental Animal Ethics Committee of Yunnan Labreal Biotechnology Co., Ltd (PZ20231012).
Figures


Similar articles
-
Hydroxysafflor yellow A attenuates the inflammatory response in cerebral ischemia-reperfusion injured mice by regulating microglia polarization per SIRT1-mediated HMGB1/NF-κB signaling pathway.Int Immunopharmacol. 2025 Feb 6;147:114040. doi: 10.1016/j.intimp.2025.114040. Epub 2025 Jan 10. Int Immunopharmacol. 2025. PMID: 39798476
-
Myricetin alleviates DNCB-induced atopic dermatitis by modulating macrophage M1/M2 polarization.Int Immunopharmacol. 2025 Jul 23;163:115212. doi: 10.1016/j.intimp.2025.115212. Online ahead of print. Int Immunopharmacol. 2025. PMID: 40706204
-
USP22 inhibits microglial M1 polarization by regulating the PU.1/NLRP3 inflammasome pathway.Brain Res Bull. 2025 Jan;220:111157. doi: 10.1016/j.brainresbull.2024.111157. Epub 2024 Dec 2. Brain Res Bull. 2025. PMID: 39631712
-
Levetiracetam add-on for drug-resistant focal epilepsy: an updated Cochrane Review.Cochrane Database Syst Rev. 2012 Sep 12;2012(9):CD001901. doi: 10.1002/14651858.CD001901.pub2. Cochrane Database Syst Rev. 2012. PMID: 22972056 Free PMC article.
-
Cordycepin Ameliorates Kainic Acid-Induced HT22 Cell Neurotoxicity by Activating GPR120-Mediated Mitophagy.Dev Neurobiol. 2025 Apr;85(2):e22961. doi: 10.1002/dneu.22961. Dev Neurobiol. 2025. PMID: 40007070 Review.
References
-
- Thijs, R. D., Surges, R., O’Brien, T. J. & Sander, J. W. Epilepsy in adults. Lancet (Lond. Engl.). 393, 689–701. 10.1016/s0140-6736(18)32596-0 (2019). - PubMed
-
- Palma, E. et al. Modulation of GABAA receptors in the treatment of epilepsy. Curr. Pharm. Des. 23, 5563–5568. 10.2174/1381612823666170809100230 (2017). - PubMed
-
- Acevedo, C. S., Mesa, T. L., Caraballo, R. & Medina, M. T. Strategy and plan of action for epilepsy 2018. Epilepsy Behav. E&B. 96, 234–236. 10.1016/j.yebeh.2019.01.046 (2019). - PubMed
-
- Pedrero, S. G., Staedler, D. & Gerber-Lemaire, S. Recent developments on the use of nanomaterials for the treatment of epilepsy. Mini Rev. Med. Chem.22, 1460–1475. 10.2174/1389557521666210805113647 (2022). - PubMed
-
- Borst, K., Dumas, A. A., Prinz, M. & Microglia Immune and non-immune functions. Immunity54, 2194–2208. 10.1016/j.immuni.2021.09.014 (2021). - PubMed
MeSH terms
Substances
Grants and funding
LinkOut - more resources
Full Text Sources
Medical
Research Materials
Miscellaneous
